What is the Best Time to Trade Forex?

Best Time to Trade Forex: A Comprehensive Guide

In this article, you’ll discover the best time to trade forex, exploring how different trading sessions influence market liquidity, volatility, and trading opportunities. Whether you’re a scalper seeking fast price movements or a long-term trader focusing on broader trends, this guide will help you identify the most favorable trading hours.

Understand Forex Trading

The forex market operates 24 hours a day, five days a week, offering global traders the flexibility to trade at their convenience. However, understanding the market’s structure and identifying the best hours to trade forex can significantly impact a trader’s success. The forex market consists of different trading sessions, each offering unique levels of liquidity and volatility.

Learn how to trade forex for beginners

Forex Market Operations

The forex market consists of four major trading sessions:

Trading SessionMarket Hours (GMT)Volatility LevelBest Pairs to TradeKey Characteristics
New York Session1 PM – 10 PMHigh – USD/CAD

– EUR/USD

– USD/JPY
– The second most active session

– Driven by economic releases and stock market influence

– Overlaps with London for peak movement
London Session8 AM – 5 PMHigh – EUR/USD

– GBP/USD

– USD/CHF
– The most liquid session

– Large institutional orders

– Overlaps with the New York session
Sydney Session10 PM – 7 AMLow – AUD/USD

– NZD/USD

– AUD/JPY
– The first session to open

– Ideal for early trend analysis
Tokyo Session12 AM – 9 AMModerate – USD/JPY

– EUR/JPY

– GBP/JPY
– Focus on Asian economic news

– Often leads to breakouts before the  London session

1. New York Session (1 PM – 10 PM GMT)

The New York session sees high volatility, particularly for USD pairs, driven by major economic releases such as NFP and GDP data. The overlap with London provides the highest liquidity, while US stock market activity further influences currency movements. Traders should expect sharp price swings and adjust strategies accordingly.

Best Pairs to Trade: USD/CAD, EUR/USD, USD/JPY

Trading Tip: Monitor economic releases closely to capitalize on market reactions.

2. London Session (8 AM – 5 PM GMT)

The London session is the most liquid and volatile, attracting major market participants. Economic releases from the UK and Eurozone, such as inflation and employment reports, create sharp price movements. The overlap with New York increases trading opportunities, making it the most popular trading period.

Best Pairs to Trade: EUR/USD, GBP/USD, USD/CHF

Trading Tip: Optimal for short-term and long-term traders due to high liquidity.

3. Sydney Session (10 PM – 7 AM GMT)

The Sydney session marks the start of the forex trading week with relatively low liquidity, making it ideal for analyzing early market trends. Price movements are usually steady, influenced by economic releases from Australia and New Zealand, such as employment data and interest rate decisions. The session overlaps with the late New York hours, providing some volatility for AUD and NZD pairs.

Best Pairs to Trade: AUD/USD, NZD/USD, AUD/JPY

Trading Tip: Ideal for position traders and those seeking early trend formation.

4. Tokyo Session (12 AM – 9 AM GMT)

Also known as the Asian session, Tokyo accounts for around 20% of daily forex turnover. This session is characterized by moderate volatility, suitable for range trading strategies. Economic data from Japan and China, such as GDP and central bank policies, drive price movements, especially for JPY pairs. The session’s close overlaps with the London open, often leading to breakouts.

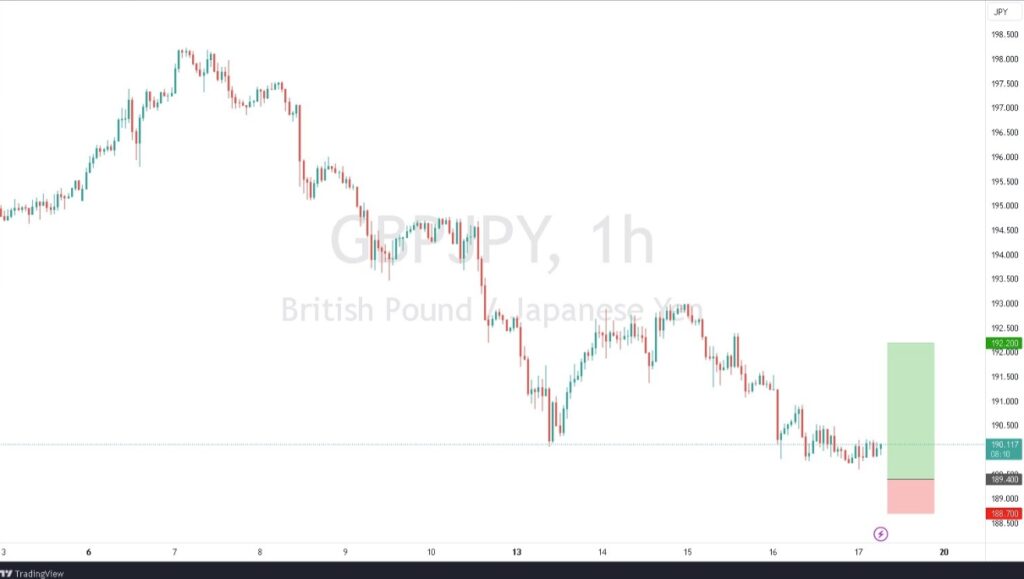
Best Pairs to Trade: USD/JPY, EUR/JPY, GBP/JPY

Trading Tip: Focus on yen pairs for consistent liquidity and stable price action.

Discover the forex market hours

Best Time to Trade Forex

The best time to trade forex is when the market experiences the highest liquidity and volatility, which typically occurs during major session overlaps, such as the London-New York overlap. These periods provide tighter spreads, faster execution, and greater price movements, creating more trading opportunities. Understanding the most active sessions, key economic events, and how different time zones impact the market can help traders optimize their strategies and maximize their profits.

The Overlap Time: London-New York (1 PM – 5 PM GMT)

The London-New York overlap is considered the most active and liquid period in the forex market. During this time, two of the world’s largest financial centers operate simultaneously, leading to increased market participation and tighter spreads. This overlap accounts for the highest trading volume, making it the best time to trade forex for major currency pairs such as EUR/USD, GBP/USD, and USD/JPY. Volatility is at its peak, offering lucrative opportunities for traders who thrive in fast-moving markets. Key economic data from both regions, such as US Non-Farm Payroll (NFP) and UK employment reports, can lead to significant price movements.

Trading Forex During the London Session

The London session is known for its high liquidity and substantial price movements, making it one of the most favorable times to trade forex. As major banks and financial institutions begin their trading day, large volumes of orders flow into the market. This session is often characterized by strong trends and breakouts, particularly in currency pairs involving the euro and British pound. Traders can expect sharp moves during economic releases such as European Central Bank (ECB) meetings and inflation reports. The London session sets the tone for the rest of the day, as many global traders take their cues from early price action.

Trading Forex During the New York Session

The New York session is the second most active trading period and overlaps with London during its first few hours, creating the most volatile period of the day. As the US financial markets open, traders react to key economic releases, such as interest rate decisions and employment data, which heavily impact USD pairs. The New York session is heavily influenced by US stock market activity, and traders should be mindful of correlations between forex and equities. Price action during this session can be dynamic, with quick reversals and strong momentum moves, making it a prime opportunity for experienced traders.

Trading Forex During the Tokyo Session 

The Tokyo session, also known as the Asian session, is known for its relatively lower volatility compared to London and New York. However, it presents unique opportunities for traders focusing on JPY-related pairs. Market participants primarily react to economic data from Japan and China, including industrial production and trade balance figures. Due to the low liquidity, price movements tend to be more predictable, making it a preferred session for range traders. Additionally, the session can set the tone for later sessions, as traders assess Asian market sentiment.

Find out the 10 most volatile forex pairs.

Choosing the Best Time to Trade Forex Based on Trading Style

Each trader has a unique approach to the market, and finding the best hours to trade forex depends on the chosen strategy:

1. Scalpers

Scalping involves making multiple quick trades within short time frames to capture small price movements. Scalpers thrive during the London-New York overlap, when the market is most volatile and liquid, allowing for fast price changes and tight spreads. The high trading volume during this period ensures rapid order execution, minimizing slippage and providing ample opportunities to profit from short-term fluctuations in major currency pairs such as EUR/USD and GBP/USD.

2. Day Traders

Day traders seek to capitalize on intraday price movements and typically prefer trading during sessions with high liquidity and steady volatility. The London session provides the highest trading volume, followed closely by the New York session, both of which allow traders to open and close positions within the same day without exposure to overnight risk. These sessions feature critical economic announcements and trend-setting price action that day traders can exploit for consistent gains.

Discover the difference between scalping vs day trading

3. Swing Traders

Swing traders hold positions for several days or weeks, aiming to profit from broader market trends rather than short-term fluctuations. Unlike scalpers and day traders, swing traders analyze multiple trading sessions to identify optimal entry and exit points based on technical and fundamental analysis. They often monitor price action during the Tokyo session for trend consolidation, the London session for breakout opportunities, and the New York session for market reactions to economic events.

Discover the 9 best forex trading strategies and techniques

Conclusion

Choosing the best time to trade forex is crucial for maximizing trading opportunities and improving overall performance. Each trading session offers unique characteristics in terms of liquidity, volatility, and market activity. To succeed in the forex market, it’s essential to stay informed about market conditions and leverage the right tools to navigate market volatility effectively.

Why Trade Forex with VT Markets

VT Markets offers optimal trading conditions with tight spreads, ultra-fast execution, and daily market analysis to help traders seize opportunities and boost profits. Whether you’re a scalper or a long-term trader, VT Markets provides advanced trading tools and 24/5 customer support to elevate your trading experience during peak liquidity hours. Sign up today and trade with confidence!

Frequently Asked Questions (FAQs) 

1. What is the best time to trade forex?

The best time to trade forex is during the London-New York overlap (1 PM – 5 PM GMT) when market liquidity and volatility are at their highest. This period offers the most trading opportunities due to increased participation from institutional and retail traders, leading to tighter spreads and more significant price movements.

2. What time does the New York session open?

The New York forex session opens at 1 PM GMT and closes at 10 PM GMT. This session is known for high volatility, particularly for USD pairs, as it coincides with major economic releases and overlaps with the London session, creating the most active trading hours.

3. What time does the London session open?

The London forex session opens at 8 AM GMT and closes at 5 PM GMT. It is the most liquid session, attracting a high number of market participants and large institutional trades. The London session often sets the market trend for the day and overlaps with the New York session for increased trading activity.

4. What time does the Sydney session open?

The Sydney forex session opens at 10 PM GMT and closes at 7 AM GMT. It marks the start of the forex trading week and is ideal for traders looking to analyze early market trends. Although liquidity is relatively low, this session provides opportunities for trading AUD and NZD pairs.

5. What time does the Tokyo session open?

The Tokyo forex session opens at 12 AM GMT and closes at 9 AM GMT. As the first major Asian market to open, it focuses on JPY pairs and often sets the tone for the Asian trading day. The session overlaps with Sydney and precedes the London session, creating potential breakout opportunities.

Oil price forecast for 2025: Key factors that could shape the market

When Donald Trump assumed the presidency, the oil markets immediately felt the tremors of his bold energy policies. Within days of his inauguration, oil prices tumbled, with Brent crude plummeting 1.1% to USD 79.29 per barrel and WTI futures dropping 2.6% to USD 75.89.

Trump’s declaration of a national energy emergency and aggressive stance on maximising US oil production signalled a fundamental shift in global energy dynamics.

This historical snapshot illustrates the volatile nature of oil markets, where geopolitical decisions, economic policies, and global tensions can dramatically impact prices.

As we look ahead to 2025, understanding the key factors influencing oil prices becomes crucial for traders and investors seeking to navigate this complex landscape.

Global demand dynamics: A shifting landscape

The global oil demand landscape is experiencing significant transformations.

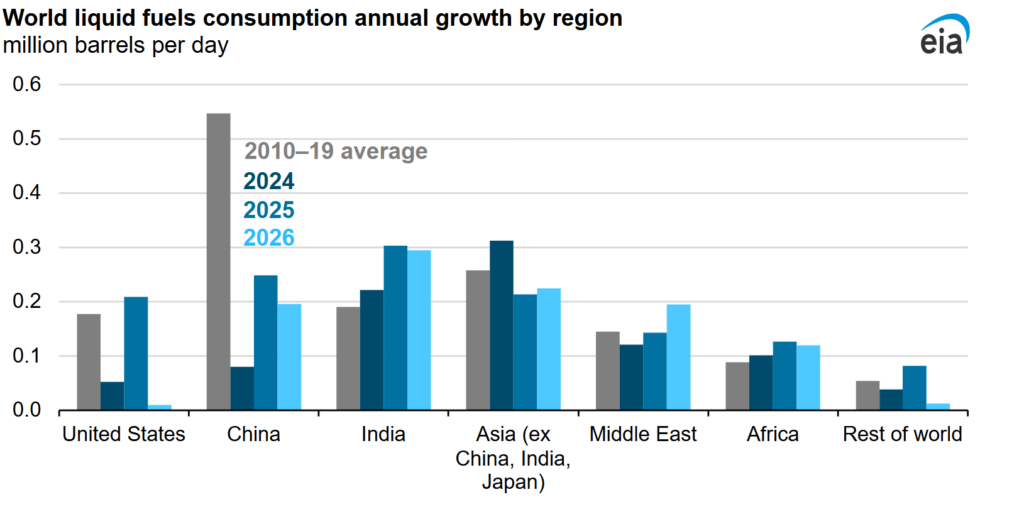
According to the International Energy Agency (IEA), global oil demand is expected to grow by 1.05 million barrels per day in 2025, reaching total consumption of 104 million barrels daily. This growth, while substantial, represents a moderation compared to historical trends.

Emerging markets are driving this expansion, with a fascinating geographic shift in energy consumption. India stands out as a particularly critical player, with its rapidly growing economy and increasing energy needs. While China’s oil demand is anticipated to peak between 2025 and 2027, India’s consumption continues to rise dramatically.

The Chinese National Petroleum Corporation (CNPC) predicts peak oil demand in 2025, attributed to increasing electric vehicle adoption and growth in liquefied natural gas (LNG) truck usage.

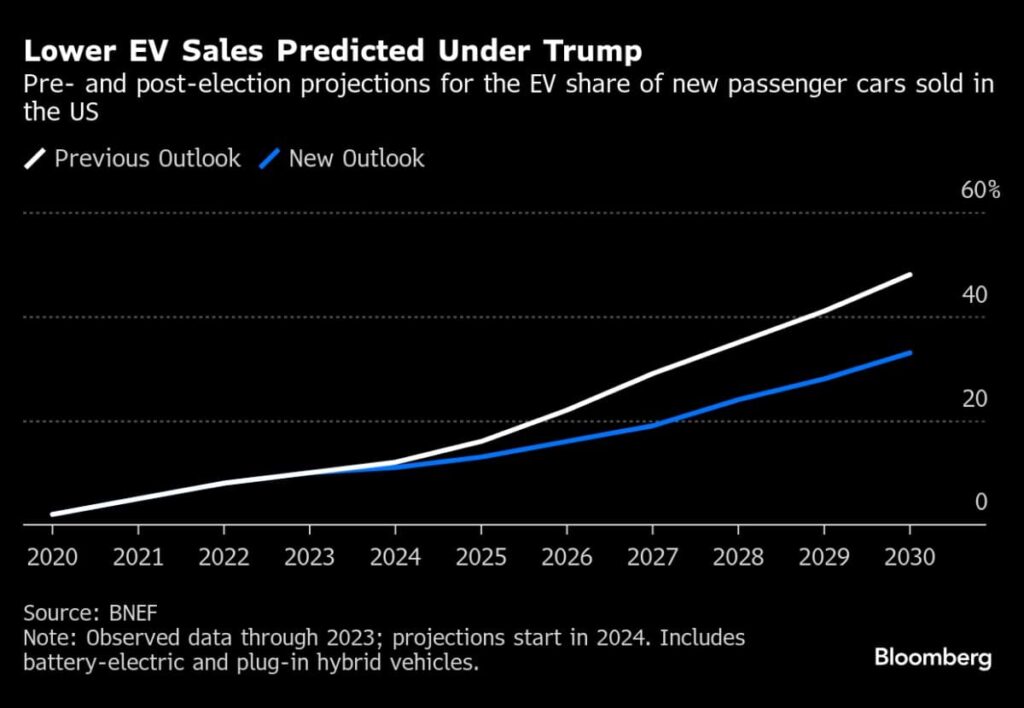
The electric vehicle (EV) market plays a pivotal role in these demand projections. Goldman Sachs research suggests that global EV sales will increase from 11 million in 2024 to 17 million in 2026, potentially reducing oil demand by nearly 0.6 million barrels per day by 2026. This transition underscores the growing impact of green technologies on traditional energy markets.

Price forecast: A multifaceted outlook

The 2025 oil price landscape presents a nuanced picture, with leading financial institutions offering varied perspectives.

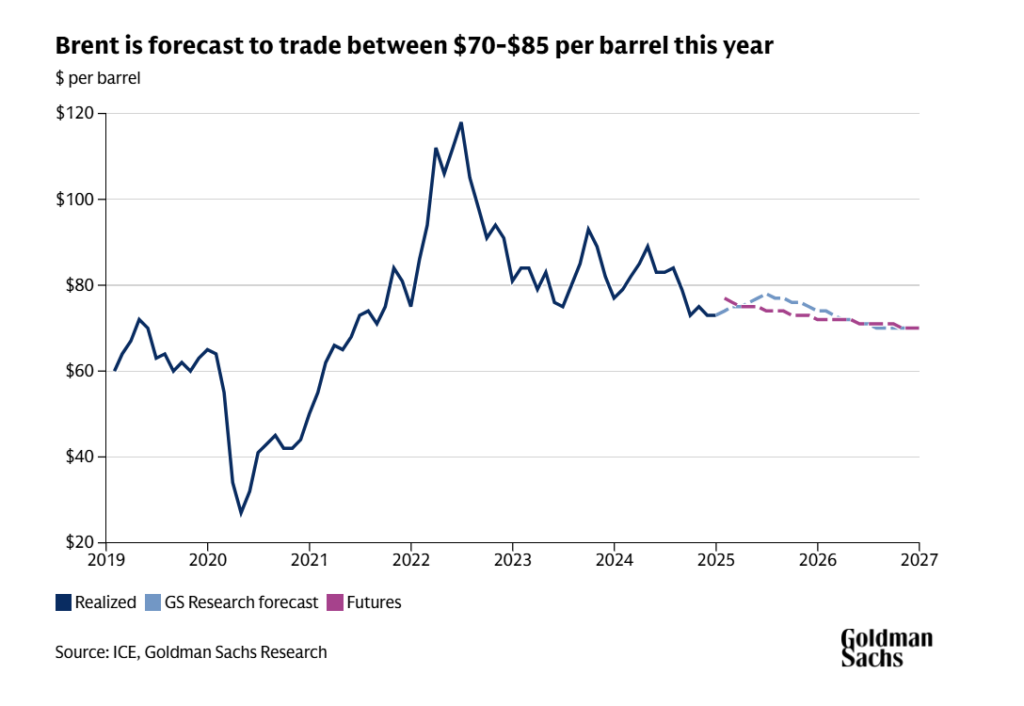
The U.S. Energy Information Administration (EIA) forecasts Brent crude at USD 74 per barrel in 2025, with a potential decline to USD 66 in 2026.

Citi Research provides a more optimistic view, raising its Brent crude projection to USD 67 per barrel and suggesting quarterly variations from USD 75 in the first quarter to USD 60 by year-end.

Goldman Sachs takes a broader approach, anticipating Brent crude trading between USD 70 and USD 85 per barrel, with an average of USD 76.

The International Energy Agency adds depth to these projections, highlighting a global oil demand increase of 1.05 million barrels per day, pushing total consumption to 104 million barrels daily.

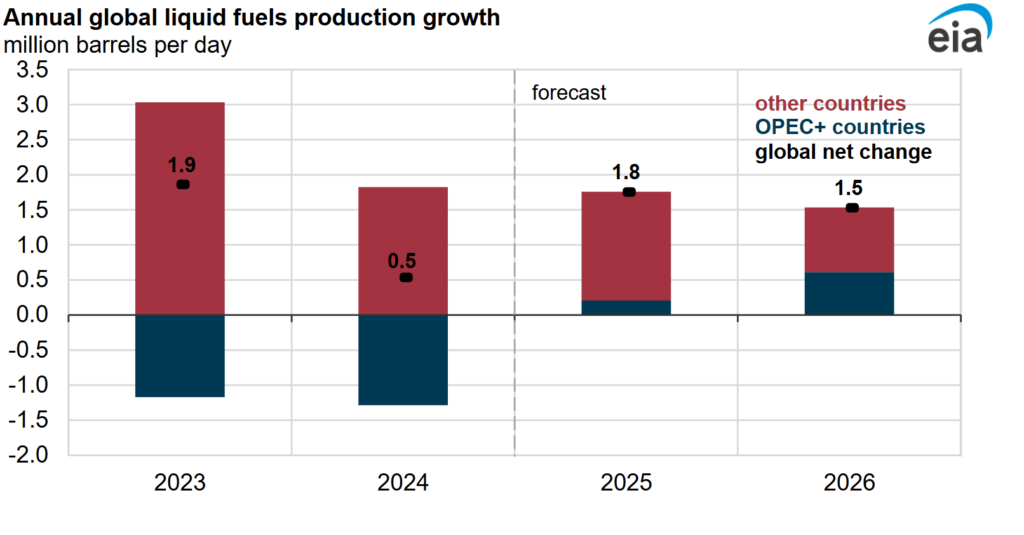
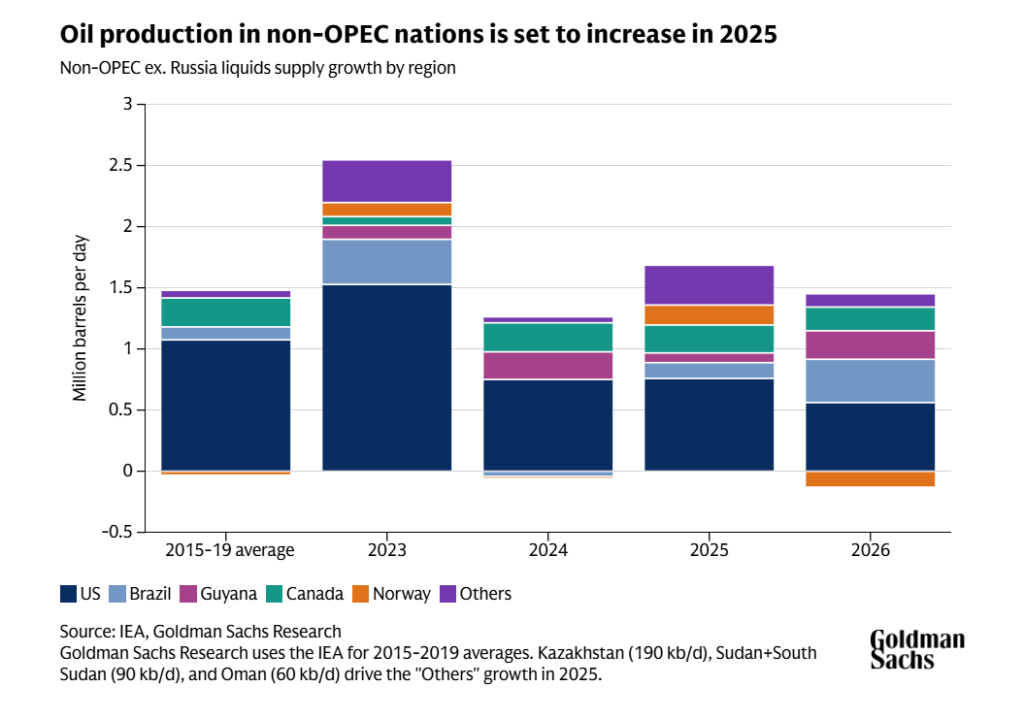
These forecasts are underpinned by complex market dynamics. A modest oil surplus of 0.4 million barrels per day is anticipated, with non-OPEC production expected to grow by 1.7 million barrels per day.

The rising electric vehicle market could reduce oil demand by 0.6 million barrels per day by 2026, adding another layer of complexity to price predictions.

Supply-side considerations: A delicate balance

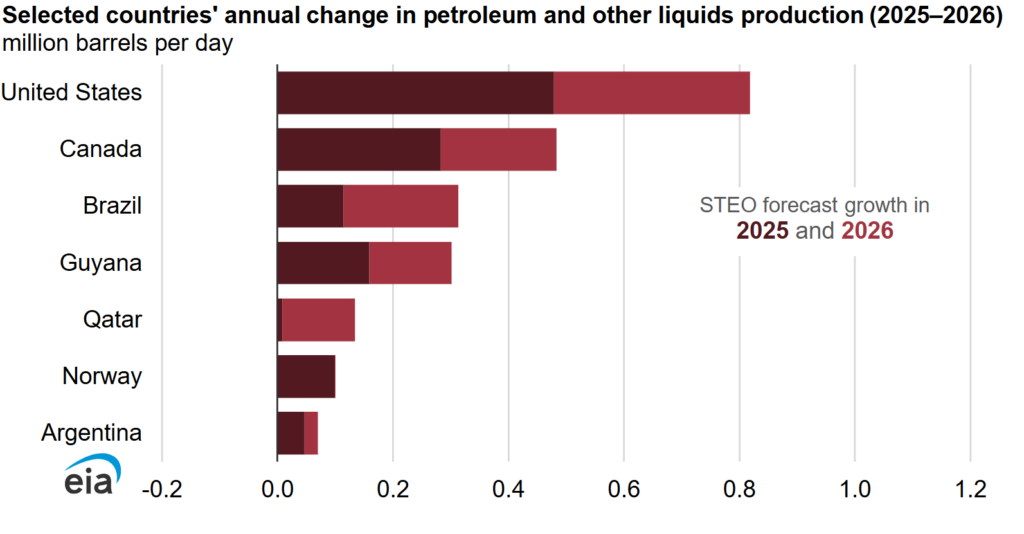
The supply landscape is equally intricate. The US Energy Information Administration (EIA) forecasts US crude oil production to reach 13.5 million barrels per day in 2025, with modest growth expected in 2026.

Non-OPEC production is predicted to grow by 1.7 million barrels per day, with substantial contributions from the United States, Canada, Brazil, and Guyana.

OPEC+ remains a critical player in maintaining market stability. The organisation has implemented multiple production cuts since April 2023, strategically managing global supply.

Despite these efforts, prices have continued to decline, falling from USD 85 per barrel in April 2023 to around USD 74 per barrel by December 2024.

The organisation’s spare capacity provides a crucial buffer against potential market disruptions. This strategic approach allows OPEC+ to prevent extreme price fluctuations while managing global supply dynamics.

The group’s ability to adjust production quickly gives them significant market influence, acting as a stabilising force in an otherwise volatile market.

Technological innovations and supply chain developments

Technological advancements are transforming oil production, especially with hydraulic fracturing and horizontal drilling unlocking previously inaccessible reserves.

In the US, the Permian Basin produces nearly 5 million bpd, making up around 40% of US output. Over the last decade, drilling costs in the basin have dropped by 30%, thanks to more efficient techniques like extended laterals and multi-stage fracking.

Seismic imaging and AI-driven optimisation have improved reserve identification and output by 10-15%, reducing exploration costs. On the supply side, pipeline expansions like Cactus II, which transports oil from the Permian to the Gulf Coast, have alleviated bottlenecks, cutting transport costs by up to 5 USD per barrel. These innovations are enhancing production efficiency and stabilising oil prices.

Geopolitical risks and potential disruptions

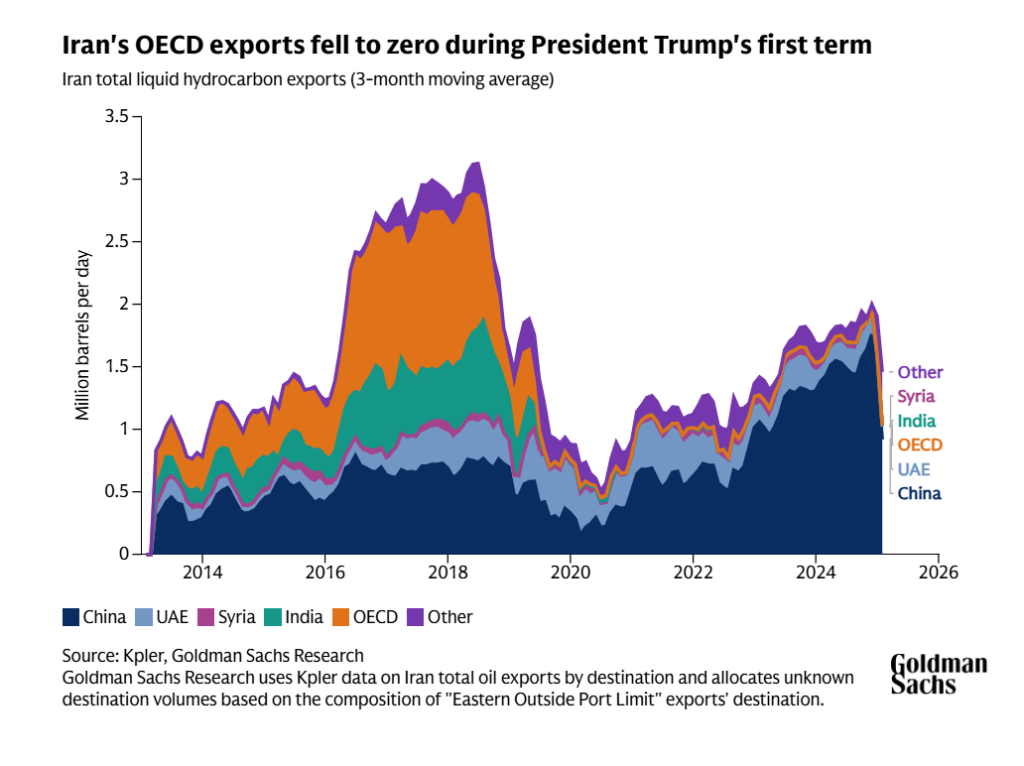
Geopolitical tensions continue to cast a long shadow over oil markets. The ongoing Russia-Ukraine conflict, potential Middle Eastern instabilities, and complex US-China trade dynamics create an environment of significant uncertainty.

The United States has introduced new sanctions targeting Russian oil producers, specifically targeting over 100 Russian tankers and oil producers. These sanctions, introduced in January 2025, have the potential to disrupt global oil supply chains and create additional market volatility.

The Red Sea shipping disruptions further complicate the global oil transportation landscape. Tensions involving Yemen’s Houthis and potential limitations on vessel movements introduce additional risk factors that traders must carefully monitor.

Conclusion

The oil market in 2025 promises to be a complex ecosystem shaped by technological innovations, geopolitical tensions, and evolving energy consumption patterns. Successful traders will need to remain flexible, well-informed, and adaptable.

The interplay between fossil fuel markets, green technologies, and geopolitical uncertainties creates a challenging yet potentially lucrative trading environment. Understanding these dynamics is key to informed investment decisions.

Ready to capitalise on oil market insights? Open a live trading account with VT Markets today and put your newfound knowledge into action. With competitive spreads and advanced trading tools, VT Markets empowers you to navigate the dynamic world of oil trading with confidence.

Oil price forecast for 2025: Key factors that could shape the market

When Donald Trump assumed the presidency, the oil markets immediately felt the tremors of his bold energy policies. Within days of his inauguration, oil prices tumbled, with Brent crude plummeting 1.1% to USD 79.29 per barrel and WTI futures dropping 2.6% to USD 75.89.

Trump’s declaration of a national energy emergency and aggressive stance on maximising US oil production signalled a fundamental shift in global energy dynamics.

This historical snapshot illustrates the volatile nature of oil markets, where geopolitical decisions, economic policies, and global tensions can dramatically impact prices.

As we look ahead to 2025, understanding the key factors influencing oil prices becomes crucial for traders and investors seeking to navigate this complex landscape.

Global demand dynamics: A shifting landscape

The global oil demand landscape is experiencing significant transformations.

According to the International Energy Agency (IEA), global oil demand is expected to grow by 1.05 million barrels per day in 2025, reaching total consumption of 104 million barrels daily. This growth, while substantial, represents a moderation compared to historical trends.

Emerging markets are driving this expansion, with a fascinating geographic shift in energy consumption. India stands out as a particularly critical player, with its rapidly growing economy and increasing energy needs. While China’s oil demand is anticipated to peak between 2025 and 2027, India’s consumption continues to rise dramatically.

The Chinese National Petroleum Corporation (CNPC) predicts peak oil demand in 2025, attributed to increasing electric vehicle adoption and growth in liquefied natural gas (LNG) truck usage.

The electric vehicle (EV) market plays a pivotal role in these demand projections. Goldman Sachs research suggests that global EV sales will increase from 11 million in 2024 to 17 million in 2026, potentially reducing oil demand by nearly 0.6 million barrels per day by 2026. This transition underscores the growing impact of green technologies on traditional energy markets.

Price forecast: A multifaceted outlook

The 2025 oil price landscape presents a nuanced picture, with leading financial institutions offering varied perspectives.

The U.S. Energy Information Administration (EIA) forecasts Brent crude at USD 74 per barrel in 2025, with a potential decline to USD 66 in 2026.

Citi Research provides a more optimistic view, raising its Brent crude projection to USD 67 per barrel and suggesting quarterly variations from USD 75 in the first quarter to USD 60 by year-end.

Goldman Sachs takes a broader approach, anticipating Brent crude trading between USD 70 and USD 85 per barrel, with an average of USD 76.

The International Energy Agency adds depth to these projections, highlighting a global oil demand increase of 1.05 million barrels per day, pushing total consumption to 104 million barrels daily.

These forecasts are underpinned by complex market dynamics. A modest oil surplus of 0.4 million barrels per day is anticipated, with non-OPEC production expected to grow by 1.7 million barrels per day.

The rising electric vehicle market could reduce oil demand by 0.6 million barrels per day by 2026, adding another layer of complexity to price predictions.

Supply-side considerations: A delicate balance

The supply landscape is equally intricate. The US Energy Information Administration (EIA) forecasts US crude oil production to reach 13.5 million barrels per day in 2025, with modest growth expected in 2026.

Non-OPEC production is predicted to grow by 1.7 million barrels per day, with substantial contributions from the United States, Canada, Brazil, and Guyana.

OPEC+ remains a critical player in maintaining market stability. The organisation has implemented multiple production cuts since April 2023, strategically managing global supply.

Despite these efforts, prices have continued to decline, falling from USD 85 per barrel in April 2023 to around USD 74 per barrel by December 2024.

The organisation’s spare capacity provides a crucial buffer against potential market disruptions. This strategic approach allows OPEC+ to prevent extreme price fluctuations while managing global supply dynamics.

The group’s ability to adjust production quickly gives them significant market influence, acting as a stabilising force in an otherwise volatile market.

Technological innovations and supply chain developments

Technological advancements are transforming oil production, especially with hydraulic fracturing and horizontal drilling unlocking previously inaccessible reserves.

In the US, the Permian Basin produces nearly 5 million bpd, making up around 40% of US output. Over the last decade, drilling costs in the basin have dropped by 30%, thanks to more efficient techniques like extended laterals and multi-stage fracking.

Seismic imaging and AI-driven optimisation have improved reserve identification and output by 10-15%, reducing exploration costs. On the supply side, pipeline expansions like Cactus II, which transports oil from the Permian to the Gulf Coast, have alleviated bottlenecks, cutting transport costs by up to 5 USD per barrel. These innovations are enhancing production efficiency and stabilising oil prices.

Geopolitical risks and potential disruptions

Geopolitical tensions continue to cast a long shadow over oil markets. The ongoing Russia-Ukraine conflict, potential Middle Eastern instabilities, and complex US-China trade dynamics create an environment of significant uncertainty.

The United States has introduced new sanctions targeting Russian oil producers, specifically targeting over 100 Russian tankers and oil producers. These sanctions, introduced in January 2025, have the potential to disrupt global oil supply chains and create additional market volatility.

The Red Sea shipping disruptions further complicate the global oil transportation landscape. Tensions involving Yemen’s Houthis and potential limitations on vessel movements introduce additional risk factors that traders must carefully monitor.

Conclusion

The oil market in 2025 promises to be a complex ecosystem shaped by technological innovations, geopolitical tensions, and evolving energy consumption patterns. Successful traders will need to remain flexible, well-informed, and adaptable.

The interplay between fossil fuel markets, green technologies, and geopolitical uncertainties creates a challenging yet potentially lucrative trading environment. Understanding these dynamics is key to informed investment decisions.

Ready to capitalise on oil market insights? Open a live trading account with VT Markets today and put your newfound knowledge into action. With competitive spreads and advanced trading tools, VT Markets empowers you to navigate the dynamic world of oil trading with confidence.

What Are ETFs & How to Trade ETFs Effectively?

Understand Exchange-Traded Funds (ETFs) & Trade Them Effectively 

This article explores what ETFs are, how they function, and the key steps to trading them successfully. We’ll explore different types of ETFs, their key benefits, and why they are a popular choice among traders. Whether you’re a beginner or an experienced trader, you’ll discover how ETFs can diversify your portfolio and how VT Markets can provide the ideal platform for your trading journey.

What Are Exchange-Traded Funds (ETFs)?

Exchange-traded funds (ETFs) are investment funds that trade on stock exchanges, much like individual stocks. They are designed to track the performance of an underlying index, commodity, sector, or asset class, offering traders and investors a cost-effective way to diversify their portfolios. ETFs may include a variety of assets, such as stocks, bonds, commodities, or a combination of these asset classes.

One of the key reasons ETFs have gained popularity is their flexibility, allowing market participants to buy and sell shares throughout the trading day at market prices. Understanding what ETFs are and their benefits can help traders make informed decisions when diversifying their portfolios.

How Do ETFs Work?

To understand how ETFs work, it’s essential to know their structure. An ETF provider creates a fund that holds a basket of assets, such as stocks, commodities, or bonds. Shares of the ETF are then issued and traded on an exchange. Unlike mutual funds, which are only priced once a day, ETFs can be bought and sold at any time during market hours.

Discover the difference between ETFs and Mutual Funds

ETFs allow traders to buy and sell shares like stocks, ensuring liquidity and price transparency throughout the trading day. They can be either passively managed, tracking a specific index to replicate its performance, or actively managed, where fund managers aim to outperform the market through strategic asset selection. Additionally, some ETFs provide dividend payments to investors based on the underlying assets they hold. For instance, the SPDR S&P 500 ETF (SPY) is a widely recognized ETF that mirrors the performance of the S&P 500 index, making it a popular choice among traders.

Types of ETFs

There are several types of ETFs that cater to different investment goals and risk appetites:

1. Equity ETFs

Equity ETFs are designed to track the performance of a specific stock index, such as the S&P 500 or NASDAQ. These ETFs provide diversified exposure to a broad range of companies, allowing traders to invest in entire markets rather than individual stocks.

Example: The SPDR S&P 500 ETF (SPY) is one of the most popular equity ETFs, tracking the S&P 500 Index, which includes 500 of the largest publicly traded companies in the US. Investors use SPY to gain exposure to leading companies like Apple, Microsoft, and Amazon without buying individual shares.

2. Bond ETFs 

Bond ETFs provide exposure to fixed-income securities such as government, municipal, and corporate bonds. These ETFs are popular among investors looking for regular income and lower risk compared to equities.

Example: The iShares Core US Aggregate Bond ETF (AGG) tracks the Bloomberg US Aggregate Bond Index, which includes a mix of government and corporate bonds. It offers diversification and stability, making it ideal for conservative investors.

3. Commodity ETFs 

Commodity ETFs track the price of physical commodities such as crude oil, natural gas, and precious metals like XAUUSD (gold). These ETFs allow traders to invest in commodities without dealing with the complexities of physical ownership.

Example: The SPDR Gold Shares ETF (GLD) tracks the price of gold (XAUUSD), providing an easy way for investors to hedge against inflation and economic uncertainties.

4. Sector ETFs

Sector ETFs focus on specific industries or economic sectors such as technology, healthcare, energy, or finance. These ETFs allow investors to target high-growth sectors or defensive industries depending on market conditions.

Example: The Health Care Select Sector SPDR Fund (XLV) tracks companies in the healthcare industry, including pharmaceuticals, biotechnology, and medical devices.

5. Thematic ETFs 

Thematic ETFs are designed to follow investment themes such as environmental, social, and governance (ESG), artificial intelligence, or renewable energy. These ETFs focus on specific megatrends and disruptive innovations.

Example: The iShares Global Clean Energy ETF (ICLN) invests in companies involved in renewable energy production, making it ideal for environmentally conscious investors.

6. Inverse ETFs 

Inverse ETFs are designed to generate profits when the value of an underlying index or asset declines. They achieve this by using derivatives such as futures contracts to produce opposite returns to the market they track. These ETFs are commonly used by traders to hedge their portfolios against downturns or to take advantage of bearish market conditions.

Example: The ProShares Short S&P 500 (SH) is an inverse ETF that moves in the opposite direction of the S&P 500 index. If the S&P 500 falls by 1%, SH is designed to rise by approximately 1%.

7. Leveraged ETFs

Leveraged ETFs aim to magnify the returns of an underlying index by using financial derivatives and debt instruments. These ETFs are designed to provide multiples of the daily performance of a specific benchmark, often 2x or 3x the movement. Leveraged ETFs are primarily used for short-term trading to capitalize on market momentum.

Example: The Direxion Daily S&P 500 Bull 3x Shares (SPXL) seeks to deliver three times the daily return of the S&P 500 index, making it suitable for aggressive traders looking to amplify their exposure.

Choosing the right ETF depends on your trading goals and market outlook. Understanding how ETFs work across different asset classes is crucial for selecting the best fit for your strategy.

How to Trade ETFs

Learning how to trade ETFs requires a strategic approach to understanding the market and making informed decisions. Follow these steps to start trading ETFs successfully:

1. Understand the Market

Before diving into ETF trading, it’s essential to grasp how the broader financial markets operate, including economic factors that influence ETF prices, such as interest rates, inflation, and market trends.

2. Analyze the Market

Use fundamental and technical analysis to identify potential ETF opportunities. Fundamental analysis looks at economic indicators and financial statements, while technical analysis focuses on price movements and trends.

3. Select the Right ETF

Research and compare ETFs based on expense ratios, liquidity, tracking error, and performance history to ensure they align with your investment goals and risk tolerance.

4. Open and Fund Your Account with VT Markets

VT Markets provides a seamless platform to start trading ETFs, offering access to a range of ETFs with competitive trading conditions and robust analytical tools.

5. Choose Your Order Type

Decide whether to use market orders for immediate execution, limit orders to buy/sell at a specific price, or stop-loss orders to manage risk effectively.

6. Monitor and Adjust

Regularly review your ETF portfolio’s performance and make necessary adjustments based on market conditions and your financial goals.

Benefits of Trading ETFs

Trading ETFs comes with several advantages, making them a popular choice among traders:

Diversification: ETFs allow traders to spread their investments across multiple assets within a single trade, reducing risk and enhancing portfolio balance. For example, an S&P 500 ETF offers exposure to 500 companies, providing instant diversification.

Cost-Effectiveness: With lower expense ratios compared to mutual funds, ETFs are a cost-efficient investment option. They generally have fewer fees and no sales loads, making them an attractive choice for budget-conscious traders.

Liquidity: ETFs trade on exchanges like stocks, allowing traders to buy and sell throughout the day at market prices. High liquidity ensures tight spreads and quick trade execution, especially with popular ETFs like SPY.

Transparency: ETFs disclose their holdings daily, providing traders with clear insights into their investments. Real-time price tracking on platforms like VT Markets allows for informed decision-making and quick market response.

Risk Management: ETFs help manage risk by providing diversification and hedging options. Traders can use inverse ETFs to benefit from market downturns or commodity ETFs like XAUUSD to hedge against inflation.

Popular ETFs to Watch

Some of the most traded ETFs globally include:

  • SPDR S&P 500 ETF (SPY): Tracks the S&P 500 index, offering exposure to large-cap US stocks.
  • iShares MSCI Emerging Markets ETF (EEM): Focuses on emerging markets such as China and India.
  • Vanguard Total Stock Market ETF (VTI): Offers comprehensive exposure to the entire U.S. stock market.
  • Invesco QQQ (QQQ): Tracks the NASDAQ-100 Index, featuring leading technology companies.
  • iShares Gold Trust (IAU): Offers exposure to XAUUSD, allowing traders to invest in gold without holding the physical asset.

Conclusion

ETFs are a versatile and cost-effective way to access a wide range of markets, offering diversification, liquidity, and transparency. Whether you’re looking to invest in equities, bonds, or commodities like XAUUSD, ETFs can help you achieve your financial goals with flexibility and lower costs. Understanding what ETFs are, how ETFs work, and how to trade ETFs strategically can empower traders to make informed decisions. With the right approach and reliable trading platform, ETFs can be a valuable addition to any trading portfolio.

Why Trade ETFs with VT Markets

VT Markets offers an exceptional trading experience for ETFs, offering competitive spreads, cutting-edge trading platforms such as MetaTrader 4 (MT4) and MetaTrader 5 (MT5), and dedicated customer support. Traders can benefit from a user-friendly interface, daily market analysis, and a wide selection of ETFs covering various asset classes. Whether you’re new to ETFs or an experienced trader, VT Markets equips you with the tools and resources needed to make informed trading decisions.

Start trading ETFs today with VT Markets and take advantage of global investment opportunities!

Frequently Asked Questions (FAQs)

1. What are ETFs?

ETFs (Exchange-Traded Funds) are investment funds that hold a basket of assets like stocks, bonds, or commodities. They trade on stock exchanges and allow investors to diversify their portfolios.

2. How do ETFs work?

ETFs work by pooling funds from investors to buy a collection of assets. The fund’s value fluctuates with the performance of the underlying assets, and shares of the ETF are traded on exchanges like stocks.

3. How do I trade ETFs?

To trade ETFs effectively, follow the step-by-step guide below:

  • Step 1: Understand the Market
  • Step 2: Analyze the Market
  • Step 3: Select the Right ETF
  • Step 4: Open and Fund Your Account with VT Markets
  • Step 5: Choose Your Order Type
  • Step 6: Monitor and Adjust

4. What are the advantages of ETFs?

ETFs offer several advantages, including low fees, diversification, and flexibility. They provide exposure to various markets and sectors while allowing investors to trade throughout the day on stock exchanges.

5. What is the difference between ETFs and mutual funds?

Unlike mutual funds, which are typically managed actively and can only be bought or sold at the end of the trading day, ETFs trade on exchanges throughout the day like stocks. Additionally, ETFs generally have lower management fees than mutual funds.

What Is Trading and How Does Trading Work? 

Understand What Trading Is & How Trading Works

Trading has become an essential part of the global financial landscape, offering individuals and institutions opportunities to buy and sell various financial instruments with the goal of making a profit. But what is trading, and how does trading work? Whether you’re looking to engage in short-term price movements or long-term financial growth, understanding the fundamentals of trade and trading can help you make informed decisions.

What is Trading?

Trading is the process of buying and selling financial assets such as stocks, currencies, commodities, and indices with the goal of making a profit. It involves taking advantage of market fluctuations driven by factors such as economic data, geopolitical events, and investor sentiment. Unlike investing, which focuses on long-term wealth accumulation, trading aims to capitalize on short-term price movements. 

Traders analyze market trends using technical and fundamental analysis, applying strategies to maximize potential gains while managing risk. Whether through day trading, swing trading, or position trading, market participants can leverage trading platforms like VT Markets to access global financial markets efficiently.

How Does Trading Work?

Understanding how trading works is crucial for anyone looking to enter the financial markets. Trading works by executing orders through online trading platforms such as VT Markets, which provide access to multiple asset classes, including forex, stocks, commodities, and indices.

VT Markets provides CFDs (Contracts for Difference), allowing traders to go long or short, enabling them to speculate on market movements not only when prices rise but also when they fall. 

Traders can profit from both buying (going long) and selling (short selling), depending on market movements:

Buying (Going Long): If a trader believes the price of an asset will increase, they buy it at a lower price and sell it at a higher price, making a profit from the difference.

Selling (Short Selling): Traders can also profit from declining prices by selling an asset they don’t own at a higher price and buying it back later at a lower price.

However, it’s important to note that traders can also incur losses if the market moves against their position:

Loss from Buying (Long Position): If the price falls after purchasing an asset, the trader may have to sell it at a lower price, leading to a loss.

Loss from Selling (Short Position): If the price rises instead of falling, the trader may need to buy it back at a higher price, resulting in a loss.

Example: A trader buys XAUUSD at $1,900 per ounce, expecting it to rise to $1,950. If the price indeed rises, they make a profit of $50 per ounce. However, if the price drops to $1,850, they face a potential loss.

Here’s how a typical trade takes place:

Market Research: Traders analyse the market using technical or fundamental analysis to identify potential opportunities.

Choosing an Asset: Deciding what to trade, such as stocks, forex, or commodities.

Placing an Order: Executing a buy or sell order through a broker.

Risk Management: Using tools like stop-loss and take-profit to limit exposure to market fluctuations.

Closing the Trade: Selling or covering the asset once the desired price level is reached or risk management measures are triggered.

What Assets Can You Trade with VT Markets?

VT Markets offers over 1000 assets that cater to both beginners and experienced traders, providing flexibility and diversification options. Some of the key assets available for trading include:

1. Forex

Trade forex, including exotic, minor, and major currency pairs, and capitalize on fluctuations in exchange rates driven by economic and geopolitical factors.

Discover the 9 best forex trading strategies & techniques

2. Indices

Track the performance of major stock market indices such as the S&P 500 and NASDAQ, reflecting the overall market sentiment and economic health.

3. Energies

Trade commodities like crude oil and natural gas are influenced by global supply and demand dynamics.

4. Precious Metals

Invest in gold, silver, and platinum to hedge against inflation and economic uncertainty.

5. Soft Commodities

Trade in agricultural products such as coffee, sugar, and wheat is affected by seasonal trends and global demand.

6. ETFs

Gain diversified exposure to various market sectors through exchange-traded funds without needing to buy individual stocks.

7. CFD Shares

Trade share CFDs on leading companies from global markets, benefiting from price movements without owning the underlying asset.

8. CFD Bonds

Access government and corporate bond CFDs to diversify investments and manage interest rate risks.

VT Markets’ advanced trading platforms provide traders with real-time market insights, risk management tools, and a seamless trading experience across all asset classes.

Trading vs Investing: Key Differences

While both trade and trading and investing aim to generate financial returns, their approaches differ in several aspects, including time frame, risk level, strategy, and objectives. Understanding these distinctions can help individuals decide which approach aligns better with their financial goals.

AspectTradingInvesting
Time FrameShort-term (minutes to months)Long-term (years to decades)
Risk LevelHigher due to volatilityLower with long-term growth
StrategyTechnical analysis, trend followingFundamental analysis, value investing
ObjectiveProfit from market fluctuationsBuild wealth over time

Time Frame: Trading involves short-term positions, often lasting from a few minutes to a few months. Traders take advantage of frequent price fluctuations, entering and exiting trades quickly to capitalize on small movements. On the other hand, investing focuses on a long-term horizon, with assets typically held for years or even decades to benefit from compounding growth and long-term market trends.

Risk Level: Trading carries a higher level of risk due to the frequent buying and selling of assets, making it susceptible to market volatility and sudden price swings. Traders must constantly monitor market conditions to avoid losses. Investing, however, is generally considered lower risk as it focuses on long-term growth, allowing the market to recover from short-term downturns and reduce overall volatility.

Strategy: Traders primarily use technical analysis, studying price charts, patterns, and indicators to make quick decisions. They rely on trends, market momentum, and short-term news events to enter and exit trades. Investors, in contrast, base their decisions on fundamental analysis, evaluating a company’s financial health, market position, and future growth potential to make informed, long-term investment choices.

Objective: The main goal of trading is to generate quick profits from short-term price fluctuations, which requires active involvement and continuous market monitoring. Investors, on the other hand, aim to build wealth gradually over time by holding assets that provide steady returns, such as dividends, interest, and long-term capital appreciation.

Example: A trader might buy XAUUSD when it shows short-term bullish momentum and sell it within hours to capture a small profit, whereas an investor would hold XAUUSD for years to hedge against inflation and economic uncertainty.

Learn more about the difference between trading and investing.

Benefits of Trading

Trading offers several advantages for individuals looking to actively participate in financial markets and capitalize on price movements. Some key benefits include:

Profit Opportunities in Both Rising and Falling Markets

Unlike traditional investing, trading allows individuals to profit not only when prices rise (going long) but also when they fall (short selling). With platforms like VT Markets offering CFDs, traders can take advantage of market fluctuations in any direction.

Flexibility and Accessibility

Modern trading platforms provide access to global financial markets 24/5, allowing traders to participate at their convenience. With mobile trading apps and online platforms, individuals can trade anytime and anywhere.

Diverse Asset Choices

Traders can access a wide range of financial instruments, including forex, indices, commodities, and stocks, enabling them to diversify their portfolios and reduce risk exposure.

Leverage for Enhanced Returns

Trading offers the opportunity to use leverage, allowing traders to control larger positions with a smaller initial investment. While leverage can magnify profits, it’s important to manage it carefully to avoid significant losses.

Short-Term Profit Potential

Trading provides the potential to generate profits over shorter time frames compared to traditional investing, making it an attractive option for those looking to achieve quicker financial goals.

How to Get Started in Trading?

If you’re new to trading and wondering how trading works, follow these essential steps to get started effectively:

1. Choose a Market

Decide which market you want to trade, such as forex, indices, commodities, or shares, based on your financial goals and risk tolerance.

2. Understand and Analyze the Market

Conduct thorough market research using technical and fundamental analysis to identify potential trading opportunities and trends.

3. Choose a Reliable Broker

Select a trusted broker like VT Markets, which offers a secure trading environment, advanced tools, and access to multiple financial instruments.

4. Open and Fund Your Account

Register a live trading account with your chosen broker, complete the verification process, and deposit funds to start trading in live market conditions.

5. Develop a Strategy

Create a well-defined trading plan that includes risk management techniques, entry/exit points, and a disciplined approach to market fluctuations.

6. Start with a Demo Account

Practice your strategies in a risk-free environment using a VT Markets demo account to build confidence and familiarize yourself with the trading platform.

7. Execute Your First Trade

Once confident, place your first trade based on your market analysis and strategy, using appropriate position sizing and risk management tools.

8. Close Your First Trade

Monitor the market and close your trade when your target is reached or risk management criteria are triggered, evaluating the outcome for future improvements.

Learn how to start trading for beginners with a complete guide

Conclusion

Trading provides an exciting opportunity to actively engage in financial markets and take advantage of both rising and falling prices. Whether you are interested in forex, indices, energies, or other asset classes, understanding what trading is and how it works is essential to making informed decisions. By leveraging the right strategies, tools, and market knowledge, traders can optimize their potential while managing risks effectively. VT Markets offers a comprehensive trading environment with access to diverse financial instruments, educational resources, and advanced trading platforms to support traders at every level.

Start Trading Today with VT Markets

Ready to take your trading journey to the next level? VT Markets provides a secure and user-friendly platform that offers:

  • A wide range of tradable assets, including forex, indices, energies, and more.
  • Competitive spreads and leverage to maximize your trading potential.
  • Advanced trading tools and market analysis to help you make informed decisions.
  • Dedicated 24/5 customer support to assist you every step of the way.

Sign up with VT Markets today and start exploring endless trading opportunities with confidence!

Frequently Asked Questions (FAQs)

1. What is trading?

Trading is the process of buying and selling financial assets like stocks, currencies, or commodities to make a profit. Traders seek to buy at low prices and sell at higher prices.

2. How does trading work?

Trading works by participating in a market where assets are bought and sold. Traders analyze market conditions, use strategies, and place orders to execute trades that aim to profit from price movements.

3. How can I start trading?

To get started with trading, you may follow the steps below: 

  • Step 1: Choose a Market
  • Step 2: Understand and Analyze the Market
  • Step 3: Choose a Reliable Broker
  • Step 4: Open and Fund Your Account
  • Step 5: Develop a Strategy
  • Step 6: Start with a Demo Account
  • Step 7: Execute Your First Trade
  • Step 8: Close Your First Trade

4. How do I make money from trading?

You can make money from trading by taking advantage of price movements in various assets, such as stocks, forex, or commodities. Traders typically profit by buying assets at a low price and selling them at a higher price, or by selling assets short when prices are expected to fall.

5. What are the risks of trading?

The main risks of trading include losing capital, market volatility, and leveraging positions. Price movements can be unpredictable, and without proper risk management, traders may face substantial losses. It’s important to use stop-loss orders and manage risk exposure carefully.

6. What is the difference between trading and investing?

Trading typically involves short-term strategies and frequent buying and selling of assets to capitalize on price movements. Investing is generally a long-term strategy focused on holding assets to appreciate over time. Trading often requires more active participation and quicker decision-making compared to investing.

7. What are the best strategies for trading?

Popular trading strategies include:

  • Day trading: Buying and selling assets within the same trading day.
  • Swing trading: Holding assets for several days or weeks to profit from price fluctuations.
  • Scalping: Making multiple small trades for small profits.
  • Position trading: Holding trades for long periods, based on long-term trends.

8. Can I trade using leverage?

Yes, leverage allows traders to control a larger position with a smaller amount of capital. While leverage can amplify profits, it also increases risk. It’s essential to use leverage responsibly and implement risk management strategies like stop-loss orders.

What is the Consumer Price Index (CPI) and How to Use It?

Understanding the Meaning of the Consumer Price Index (CPI)

The Consumer Price Index (CPI) is one of the most important indicators used to measure inflation in an economy. In this article, you will learn what the Consumer Price Index (CPI) is, how it impacts financial markets, and how traders can use CPI data to make informed decisions. Understanding the meaning of CPI can help you navigate economic trends, as it affects everything from interest rates to wages and investment returns.

What is the Consumer Price Index (CPI)?

The Consumer Price Index (CPI) is a key economic indicator that measures the average change in prices consumers pay for a fixed basket of goods and services over time. It reflects how the cost of living fluctuates and serves as a primary tool for tracking inflation. CPI is calculated by comparing current prices of essential items such as food, housing, healthcare, and transportation to those in a base period. The resulting percentage change indicates whether the overall cost of living is increasing or decreasing.

Governments and policymakers use CPI to make informed decisions about interest rates, social welfare programs, and economic planning. For businesses, it helps in adjusting pricing strategies and wage policies. Individuals experience CPI through changes in everyday expenses such as rising grocery prices or rent costs. Overall, CPI provides insight into purchasing power, economic stability, and financial planning at both macro and micro levels.

How Does CPI Affect the Financial Markets?

CPI releases play a crucial role in shaping financial markets by influencing key asset classes such as stocks, forex, and commodities. Market participants closely monitor CPI data to anticipate inflation trends and adjust their strategies accordingly.

Stock Market

When CPI figures exceed expectations, it can signal rising inflation, leading central banks to consider increasing interest rates. Higher borrowing costs can negatively impact corporate profits, causing stock prices to decline. On the other hand, lower-than-expected CPI figures suggest subdued inflation, which may result in lower interest rates and improved market liquidity, potentially boosting stock valuations.

Example: In 2022, when the US CPI report indicated higher-than-expected inflation, the S&P 500 index experienced a sharp decline as investors feared aggressive interest rate hikes by the Federal Reserve. On the contrary, in 2020, lower CPI readings led to expectations of continued monetary stimulus, which contributed to a rally in technology stocks.

Discover the top 10 largest stock exchanges in the world

Forex Market

CPI has a direct impact on currency values, as inflation data influences central bank monetary policies. A higher CPI reading often strengthens a country’s currency because it increases the likelihood of interest rate hikes, making the currency more attractive to investors seeking higher returns. Conversely, a lower CPI may weaken the currency as it signals a softer economic environment and potential monetary easing.

Example: In 2021, when US CPI data showed a significant increase, the US dollar strengthened against the euro as traders anticipated the Federal Reserve would tighten monetary policy. Similarly, in 2019, a lower-than-expected CPI reading in the UK led to speculation of interest rate cuts, causing the British pound to weaken against the US dollar.

Learn how to trade forex for beginners

Commodity Market

CPI data significantly affects commodities, especially inflation-sensitive assets such as gold and oil. Rising inflation, indicated by higher CPI numbers, often drives investors toward commodities as a hedge against the declining purchasing power of fiat currencies. Energy commodities like oil may also see demand fluctuations based on inflation-driven economic conditions. A lower CPI may lead to reduced demand for commodities as inflation concerns ease, impacting pricing and market sentiment.

Example: In 2022, rising CPI reports triggered an increase in gold prices as investors sought a hedge against inflation. Conversely, in 2015, falling CPI figures led to a decline in crude oil prices as weaker inflation reduced demand expectations in major economies.

Discover the most traded commodities in the world

How to Trade with the CPI Release?

CPI data is a key driver of financial markets, influencing investor sentiment and central bank policies. A higher-than-expected CPI often signals rising inflation, leading to tighter monetary policy, stronger currencies, and weaker equities, while a lower CPI can boost stocks and weaken the currency by signaling potential monetary easing. Traders closely monitor inflation-sensitive assets such as gold and forex pairs for potential opportunities. Many traders use CFDs, which allow them to go long to profit from rising prices or go short to capitalize on selling opportunities during market downturns. Understanding CPI data helps traders anticipate market movements and refine their strategies effectively.

Trading Strategies Around CPI Reports:

Compare Actual CPI to Forecasts and Previous Data

Traders assess whether the actual CPI figure meets, exceeds, or falls short of market expectations. If CPI is higher than forecasted, markets may react by pricing in interest rate hikes, leading to currency appreciation. Lower-than-expected CPI may lead to the opposite effect.

Example: Suppose the US CPI report forecasts a 2.5% increase, but the actual release comes in at 3%. This positive surprise could drive USD strength against other currencies like EUR and JPY, as traders anticipate the Federal Reserve will raise interest rates.

Monitor Central Bank Inflation Targets

Traders interpret CPI data based on the central bank’s inflation target. If inflation is persistently above the target, markets may anticipate further rate hikes. If inflation is below target, monetary easing could be expected, benefiting risk assets like stocks.

Example: If the European Central Bank targets inflation at 2% but the CPI report shows a lower-than-expected 1.5%, investors might expect further stimulus measures, leading to a weaker euro and higher stock prices.

Assess Market Reactions for Short-Term Opportunities

CPI releases often create volatility, leading to short-term trading opportunities. Traders use technical analysis in conjunction with CPI data to identify potential entry and exit points in the market.

Example: If the UK CPI comes in lower than expected, traders might short GBP/USD in anticipation of a weaker pound and look for key support levels for potential exit points.

By analyzing CPI reports through these lenses, traders can develop a structured approach to market movements, using economic data as part of their broader strategy rather than relying on it in isolation.

Key CPI Releases Around the World

Major economies release CPI reports periodically, and these reports often set the tone for global market movements by influencing various asset classes. Some of the most closely watched CPI releases and their affected assets include:

United States (US CPI)

Published monthly by the Bureau of Labor Statistics, this report influences global financial markets, particularly the US dollar (USD), stock indices such as the S&P 500 and Dow Jones, and commodities like gold (XAUUSD) and crude oil (WTI). Higher-than-expected CPI often leads to a stronger USD and weaker equities, while lower CPI can boost stocks and weaken the dollar.

Eurozone (HICP – Harmonized Index of Consumer Prices)

Released by Eurostat, this report helps the European Central Bank shape its monetary policy. It significantly impacts the euro (EUR), the Euro Stoxx 50 index, and government bonds such as the German Bunds. A rising CPI could strengthen the EUR, while a lower CPI might weaken it and boost European stocks.

United Kingdom (UK CPI)

Published by the Office for National Statistics, the UK CPI affects the Bank of England’s interest rate decisions, impacting the British pound (GBP), the FTSE 100 index, and UK government bonds (Gilts). A higher CPI might push the BOE to hike rates, strengthening the GBP and weighing on equities, while a lower CPI can weaken the GBP and support stocks.

China (CPI)

Released by the National Bureau of Statistics, China’s CPI reflects inflation trends in the world’s second-largest economy and influences the Chinese yuan (CNY), the Shanghai Composite Index, and commodity demand such as industrial metals and crude oil. Higher CPI could lead to tighter policies, impacting economic growth and commodity prices globally.

Japan (CPI)

Issued by the Statistics Bureau, Japan’s CPI influences the Bank of Japan’s monetary policy decisions, affecting the Japanese yen (JPY), the Nikkei 225 index, and Japanese government bonds (JGBs). Rising inflation may prompt BOJ policy changes, strengthening the yen and impacting stock prices.

By monitoring these CPI releases and their impact on relevant assets, traders can better anticipate market reactions and develop informed trading strategies.

CPI in Historical Context

One significant example of CPI’s impact on the economy and financial markets is the 2008 financial crisis, which saw a sharp decline in CPI levels, indicating deflationary pressures and a slowdown in consumer demand. As the housing market collapsed and financial institutions faced severe liquidity crises, falling CPI reflected the weakening economy, prompting central banks worldwide to implement aggressive stimulus measures. 

The US Federal Reserve responded by cutting interest rates to near-zero levels and introducing quantitative easing programs to inject liquidity into the financial system. These actions aimed to boost spending, stabilize prices, and prevent further economic downturns. For traders and investors, the declining CPI signaled a shift towards defensive assets such as gold and government bonds, while equities experienced prolonged volatility. Understanding how CPI reacted during the 2008 crisis highlights its importance in shaping monetary policies and investment strategies during economic downturns.

Conclusion

CPI is a key indicator that influences market movements by shaping investor sentiment and central bank policies. Higher CPI readings can strengthen currencies and pressure equities, while lower CPI readings may boost stocks and weaken currencies. Monitoring CPI releases from major economies like the US, Eurozone, UK, China, and Japan helps traders adjust their strategies effectively. Stay updated with CPI data by referring to the economic calendar, which provides release dates and forecasts to help traders anticipate market movements and make informed decisions.

Get Yourself Ready for CPI Release with VT Markets

Successfully navigating CPI releases requires timely market insights, advanced trading tools, and a solid strategy. VT Markets provides traders with real-time CPI data, expert market analysis, and a range of trading instruments across forex, indices, and commodities. With VT Markets, traders can take advantage of CPI-driven market movements by utilizing CFDs, allowing them to go long when prices rise or short to benefit from downturns. Whether you are trading major currency pairs like USD, EUR, and GBP or inflation-sensitive assets such as gold and crude oil, VT Markets offers the necessary tools and resources to stay informed and act confidently during CPI events.

Start your trading journey with VT Markets today and unlock your potential in the financial markets!

Frequently Asked Questions (FAQs)

1. What is the Consumer Price Index (CPI)?

CPI, or Consumer Price Index, measures the average change in the prices paid by urban consumers for a basket of goods and services over time. It is a key indicator of inflation.

2. How is CPI calculated?

The CPI is calculated by tracking the price changes of a fixed basket of goods and services that consumers typically purchase, such as food, housing, clothing, and transportation. These prices are compared over a set period, usually monthly or annually.

3. Why is CPI important?

The CPI is crucial for policymakers, investors, and consumers because it provides insight into inflation. Changes in the CPI can influence decisions regarding interest rates, wages, and government policies aimed at controlling inflation.

4. What is the difference between CPI and PPI?

While CPI measures the price changes in goods and services purchased by consumers, PPI (Producer Price Index) measures price changes at the wholesale level, reflecting the cost of production before products reach consumers.

5. How does CPI affect the financial markets?

CPI data can influence market movements by impacting expectations of future inflation and monetary policy. For example, higher-than-expected CPI may lead to speculation about central banks raising interest rates.

6. How does CPI affect interest rates?

Central banks, like the Federal Reserve, use CPI data to assess inflation levels. If the CPI indicates rising inflation, central banks may raise interest rates to cool the economy, making borrowing more expensive. Conversely, a lower CPI may lead to interest rate cuts to stimulate economic activity.

What is Inflation? Is Inflation Good or Bad?

What is Inflation? Understanding if Inflation is Good or Bad

What is inflation, and how does it affect you? Is inflation good or bad for the economy? Inflation refers to the rate at which the prices of goods and services increase, diminishing purchasing power. While inflation is often viewed negatively, there are also benefits to moderate inflation. Understanding the full impact of inflation can help you make smarter financial decisions.

What is Inflation?

Inflation refers to the rate at which the general price levels of goods and services increase over time, leading to a decrease in the purchasing power of money. In other words, as inflation rises, the same amount of money buys fewer goods and services, which impacts consumers, businesses, and the overall economy.

Understanding what inflation is is crucial, as it affects everything from household budgets to investment returns and economic policies. Moderate inflation is considered a normal part of a growing economy, while excessive inflation can lead to economic instability and erode savings. Central banks, such as the Federal Reserve and the European Central Bank (ECB), monitor inflation closely to maintain a stable economic environment.

Causes of Inflation

Inflation arises due to various economic and external factors that influence the supply and demand dynamics of an economy. Understanding these factors is crucial to determining whether inflation is good or bad in a given context. The primary causes of inflation include:

1. Demand-Pull Inflation

Demand-pull inflation occurs when the demand for goods and services in an economy exceeds the available supply. This imbalance pushes prices higher as consumers compete for limited products and services. It is often associated with periods of economic growth, where higher employment and rising wages lead to increased consumer spending.

Example: In the aftermath of the COVID-19 pandemic, governments worldwide implemented stimulus programs, providing financial aid to individuals and businesses. As demand for goods surged while supply chains were still recovering, prices for essential items such as electronics and automobiles soared, leading to inflationary pressures.

2. Cost-Push Inflation

Cost-push inflation arises when the costs of production inputs—such as labor, raw materials, and energy—increase, compelling businesses to pass those costs onto consumers in the form of higher prices. This type of inflation often occurs during supply chain disruptions or when key resources become scarce.

Example: The Russia-Ukraine conflict in 2022 led to a sharp rise in global oil and natural gas prices, significantly increasing transportation and production costs. This contributed to higher prices across industries, including food production and manufacturing, resulting in cost-push inflation worldwide.

3. Monetary Policy (Excess Money Supply)

Inflation can also result from expansionary monetary policies where central banks inject excess liquidity into the economy. When the money supply grows faster than the economy’s output, it devalues the currency and leads to higher prices.

Example: During the 2008 financial crisis, the US Federal Reserve introduced quantitative easing programs to stimulate economic growth by increasing the money supply. While it was initially necessary to prevent a recession, prolonged easy money policies contributed to inflationary pressures in subsequent years.

4. Global Factors

External economic events and global market fluctuations can also drive inflation by affecting supply chains and commodity prices. In an interconnected world, disruptions in one region can have a cascading effect on global prices.

Example: The COVID-19 pandemic severely impacted global supply chains, leading to shortages of critical components such as semiconductor chips. This caused price increases in various industries, from automobiles to electronics, further driving inflation worldwide.

5. Built-In Inflation

Built-in inflation occurs when businesses and workers expect prices to continue rising, leading to a self-perpetuating cycle of wage and price increases. As employees demand higher wages to keep up with the cost of living, businesses pass these costs onto consumers by raising prices, further fueling inflation. This type of inflation is often influenced by long-term expectations and economic conditions.

Example: In the 1970s, during the period of high inflation in the US, workers demanded higher wages to cope with rising living costs. Businesses, in turn, increased prices to cover labor costs, creating a persistent cycle of inflation that required strong monetary policy measures to break.

Why Inflation Might Be Good?

While inflation is often seen in a negative light, moderate inflation, typically around 2%, is considered beneficial for a healthy economy. It provides a stimulus for economic growth and prevents the negative consequences of deflation. Here’s why controlled inflation can be advantageous:

1. Encourages Spending and Investment

When consumers and businesses expect prices to rise gradually over time, they are more likely to spend and invest rather than hoard cash. This increased economic activity fuels demand for goods and services, leading to job creation and business expansion. For example, rising property prices often encourage homebuyers to act sooner rather than later, stimulating the real estate market.

2. Reduces Debt Burden

Inflation diminishes the real value of money over time, which benefits borrowers. As prices rise, the relative burden of repaying fixed-interest debts, such as mortgages or student loans, reduces over time. This can improve household financial health and encourage further borrowing and investment in productive assets.

3. Increases Wages and Economic Growth

Moderate inflation is often accompanied by rising wages, as businesses adjust salaries to keep up with the higher cost of living. This can improve the overall standard of living and contribute to economic expansion. In growing economies, inflation aligns with productivity improvements and increasing consumer demand.

4. Promotes Business Expansion

A predictable inflation rate enables businesses to plan for future costs and revenue expectations, encouraging investment in infrastructure, innovation, and workforce expansion. With rising demand and stable price growth, companies feel more confident about scaling operations and introducing new products.

Why Inflation Might Be Bad?

While a little inflation can be good, too much of it can seriously hurt the economy. Understanding why inflation is bad is important to avoid financial problems. When prices rise too fast or become unpredictable, it can make money worth less, make it harder to plan for the future, and create a lot of uncertainty for everyone.

1. Erosion of Purchasing Power

When inflation rises rapidly, the value of money declines, and consumers find it increasingly difficult to afford the same quantity of goods and services with their existing income. This can disproportionately impact low- and middle-income households, who spend a significant portion of their earnings on necessities such as food, rent, and healthcare. For example, during the inflation surge of the 1970s in the U.S., consumers struggled with rising fuel and food costs, which outpaced wage growth.

2. Increased Cost of Living

High inflation can significantly increase the cost of essentials such as housing, education, and healthcare, putting financial strain on households. As prices soar, families and individuals experience financial strain, forcing them to cut back on discretionary spending, which can slow economic growth. Persistent inflation may also lead to social unrest as basic needs become harder to afford.

3. Interest Rate Hikes

To combat rising inflation, central banks often increase interest rates, making borrowing more expensive for businesses and individuals. Higher interest rates can slow economic activity by discouraging investments in real estate, infrastructure, and business development. For example, in 2022, the Federal Reserve raised interest rates to curb inflation, leading to higher mortgage rates and slowing home sales.

4. Uncertainty in Markets

Inflation creates uncertainty in the economy, making it difficult for businesses and investors to plan for the future. Unstable production costs and fluctuating prices can lead to reduced capital investments and lower productivity. This uncertainty can result in stock market volatility, as investors become hesitant to make long-term commitments in an inflationary environment.

Historical Incidents of Inflation

Throughout history, inflation has played a major role in shaping economies, sometimes leading to severe economic crises and policy shifts. Examining past incidents of inflation helps us understand the causes, consequences, and potential solutions to inflationary pressures. Here are two significant historical examples:

The Great Inflation (1970s, US)

The Great Inflation in the US during the 1970s was caused by rising oil prices, excessive government spending, and delayed monetary action. The 1973 OPEC oil embargo led to soaring energy costs, driving up prices across the economy. At the same time, increased public spending and the Federal Reserve’s slow response allowed inflation to rise to double digits. This resulted in stagflation, where high inflation coexisted with slow economic growth and rising unemployment. To address the crisis, the Federal Reserve, under Paul Volcker, raised interest rates sharply, which initially caused a recession but eventually stabilized prices. This period highlighted the importance of timely monetary policy in controlling inflation.

Weimar Republic Hyperinflation (1920s, Germany)

In the 1920s, Germany experienced extreme hyperinflation due to excessive money printing to pay off World War I reparations. As the value of the German mark plummeted, prices skyrocketed, with basic goods costing billions of marks. Savings were wiped out, and economic instability led to widespread hardship and social unrest. Eventually, the introduction of the Rentenmark and stricter monetary policies helped restore stability. This event serves as a warning against uncontrolled money supply and the importance of maintaining economic discipline.

How to Trade During Inflation?

Trading during inflationary periods can present both opportunities and risks, as market conditions become more volatile and unpredictable. Inflation affects asset prices differently, making it crucial for traders to adopt strategies that protect their investments and capitalize on price movements. Here are some key approaches to trading during inflation:

Investing in Inflation-Resistant Assets

Certain assets tend to perform well during inflationary periods. Commodities such as gold, silver, and oil often retain their value or appreciate as inflation rises. Gold is particularly seen as a hedge against inflation, as its value often rises when fiat currencies lose purchasing power.  Similarly, energy and agricultural commodities can benefit from rising prices and increased demand.

Discover 10 reasons why gold is so valuable

Trading Inflation-Indexed Securities

Government-issued securities such as Treasury Inflation-Protected Securities (TIPS) in the US provide investors with a way to safeguard their portfolios against inflation. These securities adjust their principal value based on inflation rates, ensuring that returns keep pace with rising prices. Traders looking for low-risk options can consider inflation-linked bonds as a defensive strategy.

Focusing on Forex Markets

Inflation can significantly impact currency values. Traders often look for opportunities in currency pairs where inflation is causing depreciation in one currency while strengthening another. For example, during high inflation, central banks may raise interest rates, which can strengthen the currency in response. Monitoring economic data and inflation reports can help identify forex trading opportunities.

Investing in Stocks with Pricing Power

Companies that have strong pricing power—meaning they can pass higher costs onto consumers—tend to perform well during inflation. Sectors such as consumer staples, healthcare, and energy are less sensitive to inflationary pressures and may provide stable returns. Traders can focus on these sectors to mitigate risks and maintain profitability.

Diversifying the Portfolio

A diversified trading strategy is crucial during inflation to reduce risk. Spreading investments across various asset classes such as stocks, commodities, real estate, and forex can help balance potential losses in one area with gains in another. This approach enhances resilience against inflation-driven market fluctuations.

Using Hedging Strategies

Traders can use financial instruments like options and futures to hedge against inflation risks. For example, commodity futures contracts allow traders to lock in prices, protecting against potential increases in raw material costs. Additionally, options strategies, such as buying protective puts, can safeguard investments against potential downturns.

Staying Informed and Flexible

Inflation-driven markets require traders to stay updated on economic indicators such as the Consumer Price Index (CPI), Producer Price Index (PPI), and central bank policies. Being adaptable and adjusting strategies according to inflation trends can help traders make informed decisions and respond to market changes effectively.

Conclusion

Inflation is a double-edged sword that can have both positive and negative effects on the economy. While moderate inflation encourages spending, investment, and economic growth, excessive inflation can erode purchasing power, increase living costs, and create economic uncertainty. Understanding inflation and its impact helps individuals and businesses make informed financial decisions.

Trade During Inflation with VT Markets

Trading during inflation can be challenging, but VT Markets offers the tools and insights needed to stay ahead. Whether you’re trading commodities, forex, or indices, VT Markets offers a range of solutions designed to help you capitalize on inflation-driven market movements. With access to real-time market analysis, advanced trading platforms like MetaTrader 4 (MT4) and MetaTrader 5 (MT5), and inflation-resistant assets such as gold and energy commodities, traders can navigate market fluctuations effectively. VT Markets’ user-friendly platform and expert insights empower traders to identify opportunities, manage risk effectively, and adapt to changing economic conditions with confidence.

Start trading with VT Markets today and seize opportunities in inflation-driven markets!

Frequently Asked Questions (FAQs)

1. What is inflation?

Inflation is the rate at which the general level of prices for goods and services rises, leading to a decrease in the purchasing power of money. Central banks often aim to control inflation through monetary policies.

2. How does inflation affect the economy?

Inflation affects the economy by increasing the cost of living, impacting consumer spending, and altering interest rates. It can also influence wage growth and business profitability.

3. Why is inflation considered bad?

High inflation can erode purchasing power, causing the cost of goods and services to rise. This leads to reduced disposable income for consumers and uncertainty in financial markets.

4. Why is inflation considered good?

Moderate inflation can be beneficial for the economy as it encourages spending and investment. It can also reduce the real value of debt, benefiting borrowers and stimulating economic growth.

5. How does inflation impact financial markets?

Inflation can affect financial markets by influencing interest rates, currency value, and asset prices. Traders may look to hedge against inflation through commodities like gold or energy.

6. What are the best assets to trade during inflation?

During inflationary periods, commodities like gold, energy, and agricultural products tend to perform well. These assets are often seen as hedges against inflation due to their intrinsic value.

7. How does inflation affect stock prices?

Inflation can affect stock prices by increasing the cost of doing business. High inflation leads to higher operating costs, which can reduce corporate profits and, in turn, stock prices. However, certain sectors may benefit, such as energy and commodities.

8. How can traders protect themselves from inflation?

Traders can protect themselves from inflation by investing in inflation-resistant assets like commodities, real estate, or stocks from sectors that benefit from inflation, such as energy or consumer staples.

BoJ Rate Decision & U.S. Economic Data: What to Expect

During the week of January 20 to January 24, 2025, several key economic indicators and events are anticipated to influence financial markets.

KEY ECONOMIC INDICATORS

BoJ interest rate decision:

The Bank of Japan is likely to raise its short-term policy rate from 0.25% to 0.5%, the highest level since 2008. This move reflects Japan’s steady economic growth and inflation, consistently exceeding the 2% target. However, uncertainties tied to U.S. policy changes under the new administration could influence this decision.

U.S. Treasury yields and economic data:

Investors are closely watching U.S. Treasury yields, which have fluctuated due to strong job growth and persistent inflation. The 10-year yield has surpassed 4.7%, driven by expectations of potential policy changes under the new U.S. administration. Upcoming economic data on growth, employment, and inflation are likely to impact yields further and shape Federal Reserve policy outlooks.

Global economic outlook:

S&P Global Market Intelligence forecasts global real GDP growth to slow to 2.5% in 2025, down from 2.7% in 2024. This slowdown is driven by expected U.S. tariff hikes and their impact on global trade, creating a more challenging and uncertain environment. The U.S. GDP growth forecast for 2025 has been revised to 2.0%, while China’s growth is projected at 4.2%.

U.S. crude oil inventories

The U.S. Energy Information Administration (EIA) will release its Weekly Petroleum Status Report on Thursday, January 23, 2025, due to the government closure on January 20. Crude oil inventories dropped by 1.96 million barrels for the week ending January 10, 2025, marking the eighth consecutive decline. For the week ending January 17, analysts expect a further drawdown of 1.5 to 2.0 million barrels, continuing the trend of declining inventories at a two-year low.

MARKET MOVER

XAU/USD

  • Selling pressure emerged near the previous high of 2726.0.
  • The level of 2721.3 has proven to be a key pivot point.
  • Current conditions offer a favorable risk/reward setup for market sell orders.
  • Bearish divergence is anticipated to limit further upside potential.
  • Initial optimism may drive gains, but extended upward moves are likely to encounter resistance and fail.

Trade Opportunity: Target 1: 2668.5 // Target 2: 2658.5 // Expires: 18 January 2025

GBP/JPY

  • While bears remain in control, the slowing negative momentum suggests a potential reversal.
  • The selloff has reached an exhaustion point on the daily chart.
  • The favoured strategy is to buy on pullbacks.
  • Custom support is identified at 189.40.
  • The RSI continues to trend downward.

Trade Opportunity: Target 1: 192.2 // Target 2: 193 // Expires: 18 January 2025

EUR/USD

  • Prices are pushing higher, breaking out from a bullish flag/pennant pattern.
  • The projected target based on the measured move is 1.0341.
  • Most of the early daily gains have been reversed.
  • A Fibonacci confluence zone is identified at 1.0196.
  • The recommended strategy is to sell into rallies.

Trade Opportunity: Target 1:  1.0214 // Target 2: 1.0196 // Expires: 18 January 2025

MARKET NEWS

Foreign Exchange

  • The U.S. Dollar Index extended its decline for a fourth consecutive session, slipping below the 109.00 level.
  • EUR/USD edged higher by 10 pips to 1.0299.
  • USD/JPY fell sharply, losing 130 pips to 155.17, as the yen strengthened further following hawkish remarks on interest rates from the Bank of Japan’s governor and deputy governor.
  • GBP/USD eased by 12 pips to 1.2228. U.K. economic data showed GDP grew by 0.1% month-on-month in November (in line with expectations, compared to -0.1% in October), while industrial production declined by 0.4% (vs. +0.2% expected, following a -0.6% drop in October).
  • AUD/USD slipped 17 pips to 0.6209.
  • USD/CHF dipped 17 pips to 0.9109, whereas USD/CAD rose 53 pips to 1.4393.

Commodities and Stocks

On Thursday, U.S. stocks gave back some of the prior session’s gains:

  • The Dow Jones Industrial Average fell 68 points (-0.16%) to 43,153.
  • The S&P 500 dropped 12 points (-0.21%) to 5,937.
  • The Nasdaq 100 declined 146 points (-0.69%) to 21,091.

Federal Reserve Governor Christopher Waller suggested that if economic data weakens further, there could be three or four interest-rate cuts this year.

The U.S. 10-Year Treasury yield dropped 5 basis points to 4.606%.

Major tech stocks closed lower:

  • Apple (AAPL) fell 4.04%.
  • Tesla (TSLA) declined 3.36%.
  • Nvidia (NVDA) slipped 1.96%.

U.S. economic data highlights:

  • Retail sales rose 0.4% month-on-month in December (vs. +0.5% expected, +0.8% in November).
  • The Philadelphia Fed manufacturing index surged to 44.3 in January (vs. -10 expected, -16.4 in December).
  • Initial jobless claims increased to 217,000 (vs. 209,000 expected).

European stocks advanced:

  • Germany’s DAX 40 gained 0.39%.
  • France’s CAC 40 rose 2.14%.
  • The U.K.’s FTSE 100 added 1.09%.

Commodities:

  • WTI crude oil retreated from a six-month high, falling $1.36 (-1.7%) to $78.68 a barrel. Reports suggest Yemen’s Houthi militia may announce a halt to attacks on ships in the Red Sea following a Gaza cease-fire deal.
  • Gold gained $18 to $2,714 an ounce, marking a three-session rally.

Asian Session Updates

  • EUR/USD hovered near 1.0300.
  • GBP/USD remained steady at 1.2235.

Earlier, data revealed that China’s GDP grew 5.4% year-on-year in Q4, surpassing the expected 5.0% growth.

Meanwhile, USD/JPY rebounded to 155.40, and gold held steady at $2,716

Click here to open account and start trading.

Notification of Server Upgrade – Jan 17,2025

Dear Client,

As part of our commitment to provide the most reliable service to our clients, there will be MT4 & MT5 server maintenance this weekend.

MT4 & MT5 Maintenance Hours:
18th of January 2025 (Saturday) 00:00 to 03:00 (GMT+2)

Please note that the following aspects might be affected during the maintenance:
1. The price quote and trading management will be temporarily disabled during the maintenance. You will not be able to open new positions, close open positions, or make any adjustments to the trades.
2. There might be a gap between the original price and the price after maintenance. The gaps between Pending Orders, Stop Loss, and Take Profit will be filled at the market price once the maintenance is completed. It is suggested that you manage the account properly.

Please refer to the MT4 & MT5 software for the specific maintenance completion and marketing opening time.

Thank you for your patience and understanding about this important initiative.

If you’d like more information, please don’t hesitate to contact info@vtmarkets.com

CFDs vs Futures: What Are the Key Differences?

CFDs vs Futures: What’s the Difference and Which Is Right for You?

CFD trading vs futures can be a confusing decision for traders new to these two popular instruments. Both offer opportunities to trade financial markets, but they differ significantly in structure, risk, and leverage. Contract for difference vs futures is an important comparison to make, as understanding these differences can help you choose the best trading strategy for your goals.

What Are CFDs?

Contracts for Difference (CFDs) are financial instruments that allow traders to speculate on the price movement of an asset without owning the underlying asset itself. CFDs are traded on margin, offering flexibility to trade in rising and falling markets. Popular among retail traders, CFDs provide access to various markets, including forex, indices, commodities, and ETFs.

For example, a trader can profit from the rise or fall of crude oil prices without physically owning the oil. The key feature of CFDs is that they track the price movements of the underlying asset, enabling traders to capitalize on market fluctuations.

What Are Futures?

Futures are standardized financial contracts obligating the buyer to purchase, or the seller to sell, an asset at a predetermined price on a specified future date. These contracts are commonly traded on regulated exchanges, making them highly liquid and transparent.

Futures are widely used in commodities trading, such as crude oil, gold, and agricultural products. For instance, an airline might use futures to lock in fuel prices, protecting itself from price volatility. Institutional traders and businesses often favour futures contracts for hedging purposes.

Discover the largest stock exchanges in the world

CFDs vs Futures: What Are the Key Differences?

1. Ownership and Settlement

CFDs: With CFDs, traders never actually own the underlying asset. Instead, they engage in a contract to exchange the difference between the opening and closing prices of the asset. This makes CFDs purely speculative instruments, ideal for traders who aim to profit from price movements without logistical concerns like storage or delivery. For example, trading CFDs on crude oil allows you to benefit from its price fluctuations without worrying about physically handling barrels of oil.

Futures: Futures contracts, on the other hand, often involve the potential for physical delivery of the underlying asset at expiration. For example, in agricultural futures, a trader may need to deliver or accept delivery of physical commodities such as wheat or coffee unless they settle the contract before expiration. However, many Futures contracts are settled in cash, especially for financial instruments, minimizing logistical complexity.

2. Leverage and Margin

CFDs: CFDs are known for offering higher leverage, meaning traders can control larger positions with relatively small amounts of capital. For instance, a broker may allow you to trade with a margin requirement of just 5%, giving you substantial exposure to market movements. While this increases potential profits, it also amplifies losses, making risk management crucial.

Futures: Futures contracts have standardized margin requirements determined by the exchange. Typically, these initial margins are higher than those for CFDs, ensuring participants have enough collateral to handle significant market fluctuations. For example, trading a gold Futures contract might require a margin of $10,000, making it less accessible to traders with limited capital.

3. Flexibility

CFDs: CFDs are highly flexible, allowing traders to choose custom position sizes and hold trades for as long as desired (subject to rollover fees). This makes them an excellent choice for short-term strategies like day trading or scalping, where trades are often opened and closed within minutes or hours.

Futures: Futures contracts are less flexible due to their standardized terms. Each contract has a fixed size (e.g., 1,000 barrels for crude oil Futures) and a specific expiration date, which requires traders to manage their positions within set timeframes. Rolling over Futures to extend a position involves additional transactions and costs, making them less convenient for certain strategies.

4. Costs

CFDs: Trading CFDs typically involves spread costs, which are the difference between the bid and ask prices. While spreads are generally small, overnight holding fees (also known as swap or rollover fees) can accumulate for long-term positions. For example, holding a CFD on an index like the S&P 500 overnight might incur a small daily charge.

Futures: Futures trading involves commissions and exchange fees, which can be higher than CFD spreads. However, there are no overnight fees for Futures since contracts have a set expiration. Traders should also account for the higher upfront costs due to larger contract sizes, which can make Futures more expensive to trade initially.

5. Market Access

CFDs: CFDs provide nearly 24/7 access to global markets, including forex, indices, and ETFs. This round-the-clock trading allows traders to react to news events and market developments as they happen, offering greater flexibility for those in different time zones.

Futures: Futures trading is limited to the operating hours of the exchanges where they are listed. For example, the Chicago Mercantile Exchange (CME) has set trading hours for its products. While electronic trading has extended availability, it still doesn’t match the near-continuous access offered by CFDs. This limitation can be a drawback for traders who want to trade around the clock.

CFDs vs Futures: How to Choose Between Them

When deciding between CFDs and Futures, it’s essential to align your choice with your trading style, financial goals, and risk appetite. Here’s a deeper look at the key factors to consider:

1. Trading Goals

CFDs: CFDs are ideal for short-term speculative trading. They allow traders to quickly capitalize on market fluctuations without worrying about contract expirations. For example, a trader anticipating a temporary rise in crude oil prices can use CFDs to open and close a position within hours or days, benefiting from the movement.

Futures: Futures, on the other hand, are better suited for long-term hedging or institutional strategies. Businesses or seasoned traders often use Futures to protect against price volatility over months. For instance, an airline might secure a fixed price for jet fuel through Futures to stabilize its operating costs.

2. Capital and Risk Tolerance

CFDs: With lower margin requirements, CFDs are accessible to traders with limited capital. For example, a trader can control a $10,000 position with just $500, depending on the leverage offered by the broker. However, the high leverage also increases risk, making effective risk management essential.

Futures: Futures contracts typically require higher upfront margins, making them more suitable for traders or institutions with larger capital reserves. A gold Futures contract, for example, might require a $10,000 margin, which can be prohibitive for smaller traders but manageable for large-scale investors.

3. Market Preferences

CFDs: CFDs provide access to a broader range of markets, including forex, indices, stocks, and ETFs. This makes them a versatile option for traders looking to diversify their portfolios. For instance, a trader can speculate on Bitcoin price movements alongside traditional assets like oil or the S&P 500.

Futures: Futures excel in commodities and indices, where standardized contracts and high liquidity are crucial. For example, a trader focused on crude oil might prefer Futures for their transparency and the ability to trade on regulated exchanges like the NYMEX.

4. Flexibility Needs

CFDs: CFDs are highly flexible, allowing traders to customize their trade sizes and hold positions without fixed expirations. This is particularly beneficial for traders who want to adjust their strategies dynamically based on market conditions. For example, a trader can scale up or down their CFD positions as new market data emerges.

Futures: Futures have rigid structures with predefined contract sizes and expiration dates. While this standardization benefits institutional traders needing consistency, it can be limiting for retail traders who prefer more adaptable options.

Benefits of CFDs

Low Capital Requirements

One of the biggest advantages of CFDs is the ability to trade with a relatively small amount of capital. With high leverage, traders can control larger positions with a fraction of the investment required for other instruments. For instance, a $1,000 deposit might provide exposure to assets worth $20,000, depending on the leverage offered by the broker.

Market Diversity

CFDs offer access to various markets, including forex, indices, commodities, stocks, and even ETFs. This variety allows traders to diversify their portfolios and explore opportunities across different asset classes—all from a single trading account.

Short and Long Trading

CFDs enable traders to profit in both bull and bear markets. For example, if you anticipate a stock price will fall, you can open a short position, benefiting from the decline in value—a level of flexibility not always available with other trading instruments.

No Expiration

Unlike Futures, CFDs do not have fixed expiration dates, giving traders more control over their positions. This flexibility is particularly useful for those who prefer to adjust their strategies based on market conditions without the pressure of contract expirations.

Risks of CFDs

High Leverage

While leverage is a double-edged sword, it can be particularly risky for inexperienced traders. A small market movement in the wrong direction can lead to significant losses, potentially exceeding the initial deposit. Effective risk management is crucial when trading CFDs.

Overnight Fees

Holding CFD positions overnight incurs additional costs, known as swap or rollover fees. These charges can add up over time, especially for long-term trades, reducing overall profitability. For example, a trader holding a CFD on an index for weeks might see these fees erode their gains.

Market Volatility

CFDs are highly sensitive to market fluctuations. In volatile markets, rapid price movements can trigger stop losses or result in substantial losses, especially when high leverage is involved. Traders need to monitor their positions closely and use risk mitigation tools like stop-loss orders.

Benefits of Futures

Liquidity

Futures contracts are highly liquid, especially in popular markets like crude oil, gold, and indices. High trading volumes ensure that traders can enter and exit positions easily without significant price slippage, even during volatile market conditions.

Price Transparency

Since Futures are traded on regulated exchanges, pricing is transparent and standardized. This reduces the risk of hidden fees or discrepancies, ensuring that traders always know the true cost of their transactions.

Hedging Opportunities

Businesses and institutional investors often use Futures to hedge against price risks. For example, an airline might lock in fuel prices using crude oil Futures to protect itself from price spikes, ensuring more predictable operating costs.

Regulated Environment

Futures trading occurs in a highly regulated environment, providing traders with a sense of security. Exchanges enforce strict rules to ensure fair trading practices and minimize counterparty risks.

Risks of Futures

Complexity

Futures trading requires a solid understanding of the underlying market, contract specifications, and margin requirements. New traders might find the standardized terms and obligations challenging to navigate without prior experience or guidance.

High Initial Costs

Futures contracts typically have larger contract sizes, requiring higher upfront margin deposits. For example, trading a gold Futures contract might demand a margin of $10,000, making it less accessible to traders with limited capital.

Obligations

Futures contracts come with a binding obligation to buy or sell the asset at expiration, which can pose challenges for traders who don’t manage their positions in time. This contrasts with CFDs, where traders can exit positions at any time without such commitments.

Conclusion

CFDs and Futures offer distinct advantages and cater to different trading needs. CFDs are perfect for traders seeking flexibility, low capital entry, and access to diverse markets, making them a popular choice for short-term strategies. Conversely, Futures excel in liquidity, transparency, and hedging opportunities, appealing to institutional traders and those with a long-term focus. Choosing the right instrument ultimately depends on your trading goals, risk tolerance, and market preferences.

Trade CFDs and Futures with VT Markets

VT Markets provides a seamless trading experience with cutting-edge technology, competitive spreads, and access to both CFDs and Futures. Whether you’re exploring CFD trading vs Futures or looking for a reliable platform, VT Markets ensures a user-friendly and secure environment. Trade CFDs and Futures using advanced platforms like MetaTrader 4 (MT4) and MetaTrader 5 (MT5), and unlock your potential in the financial markets.

Start trading today with VT Markets!

Frequently Asked Questions (FAQs)

1. What is a CFD?

A CFD (Contract for Difference) is a financial contract that allows traders to speculate on the price movement of an asset without actually owning it. CFDs are typically traded over-the-counter (OTC) and offer the ability to go long or short, depending on market conditions.

2. What is a Futures contract?

A Futures contract is a standardized agreement to buy or sell an asset at a predetermined price at a specific time in the future. Futures are traded on regulated exchanges and are typically used for hedging or speculation on price movements.

3. What are the key differences between CFDs and Futures?

The key differences between CFDs and futures are in their structure and trading. CFDs are flexible, over-the-counter products with no expiration date, while futures are standardized contracts with a set expiration. CFDs typically require less capital and are more suitable for short-term trading, whereas futures require higher margins and are often used for longer-term trades or hedging.

4. How do CFDs and Futures differ in terms of trading costs?

CFDs generally have lower trading costs compared to futures due to their over-the-counter nature and shorter-term trading. However, futures contracts often have clearer pricing structures with fees based on contract specifications, while CFDs might incur overnight financing costs.

5. Which is better for short-term trading: CFDs or Futures?

CFDs are typically better for short-term trading as they offer flexibility, with no expiry dates and the ability to trade small positions. Futures contracts, on the other hand, have fixed expiration dates and are generally more suited to longer-term positions or hedging strategies.

6. Do I need to invest a lot of capital to trade CFDs or Futures?

The capital required to trade CFDs or Futures varies depending on the instrument and the leverage offered by your broker. CFDs typically require lower capital due to their flexibility, while futures contracts often involve higher margin requirements due to their standardized nature.

7. Can I use leverage when trading CFDs and Futures?

Yes, both CFD trading and futures allow the use of leverage. Leverage amplifies potential profits, but it also increases the risk of losses. Always use proper risk management strategies when trading with leverage, and be sure to understand the leverage ratios offered by your broker.

8. Are CFDs or Futures better for long-term investing?

Futures contracts are often better suited for long-term investing, particularly when hedging against market movements or speculating on longer-term trends. CFDs are typically used for shorter-term trading due to their flexibility and ease of access.

Back To Top
server

Hello there 👋

How can I help you?

Chat with our team instantly

Live Chat

Start a live conversation through...

  • Telegram
    hold On hold
  • Coming Soon...

Hello there 👋

How can I help you?

telegram

Scan the QR code with your smartphone to start a chat with us, or click here.

Don’t have the Telegram App or Desktop installed? Use Web Telegram instead.

QR code