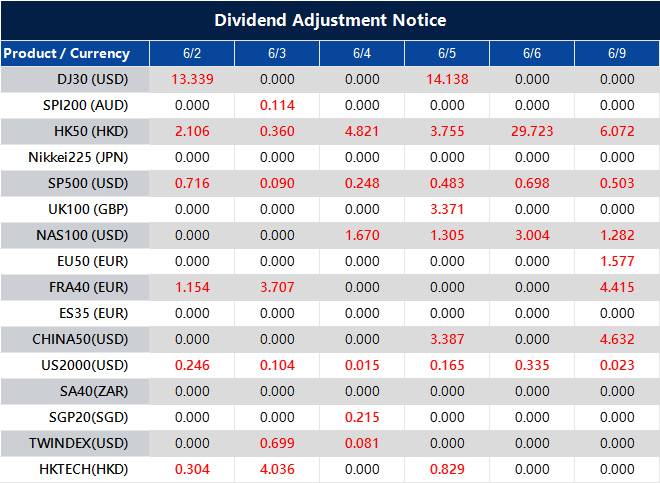
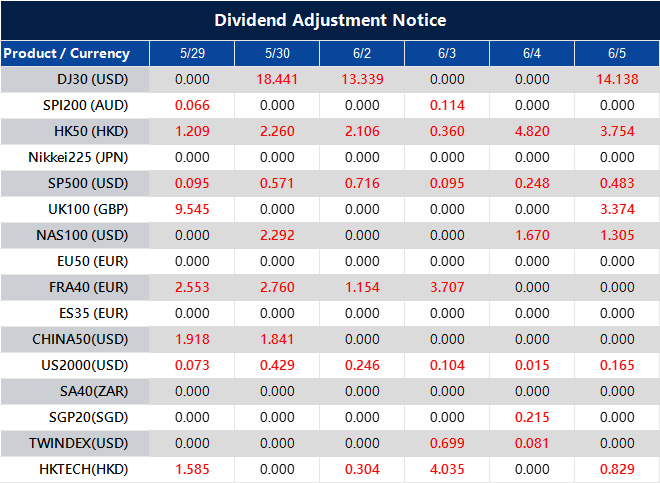
Please note that the dividends of the following products will be adjusted accordingly. Index dividends will be executed separately through a balance statement directly to your trading account, and the comment will be in the following format “Div & Product Name & Net Volume”.
Please refer to the table below for more details:
The above data is for reference only, please refer to the MT4/MT5 software for specific data.
If you’d like more information, please don’t hesitate to contact info@vtmarkets.com.
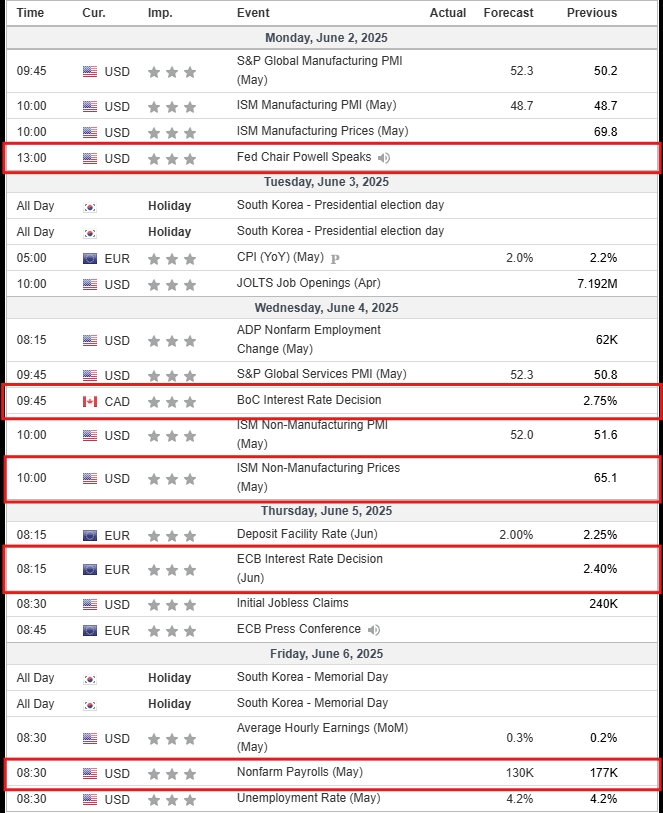
The first week of June brings a mix of critical economic data, central bank decisions, and political developments that are likely to shape market sentiment. With investors closely watching the European Central Bank’s next move and the upcoming US jobs report, markets are poised for potential shifts in expectations around inflation, interest rates, and global growth.
KEY INDICATORS
Political events
1 June: Second round of the Polish presidential election.
3 June: South Korean presidential election.
Canada’s Carney welcomes US court’s decision on tariffs.
Israel approves latest US ceasefire proposal for Gaza; Hamas yet to respond.
Trump could ask Supreme Court to halt tariff block as soon as Friday.
Monetary policy and economic regulation
Asia FX muted as dollar stems losses amid Trump tariff swings; PCE data on tap.
BofA sets AUD/JPY target at 100, cites Japan elections and RBA pause.
US ethane exports to China hit new roadblock with licence requirement.
Dollar edges higher on US court ruling; risk sentiment boosted.
Fed Chair Powell met with Trump at the White House on Thursday and told him rate decisions can’t be political.
Markets, energy, and institutions
Gold falls as traders await US data for clues to tariff impacts.
Dow, S&P 500, Nasdaq futures slip as Trump’s tariffs run into legal trouble.
Oil poised for second weekly loss ahead of OPEC+ supply decision.
STOXX 600 edges down on US trade uncertainties; set for monthly gains.
Japan stocks lower at close of trade; Nikkei 225 down 1.25%.
MARKET MOVERS
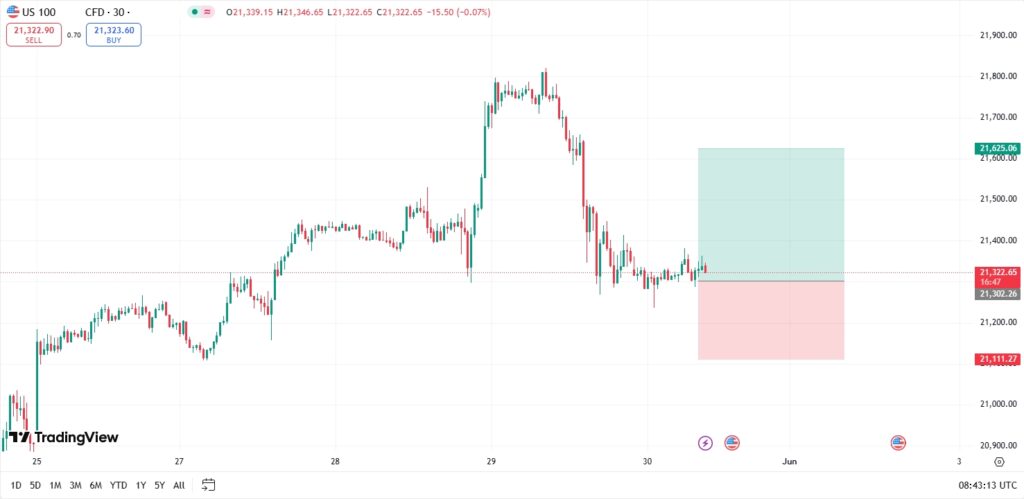
Nasdaq 100
Technical breakout: A breakout above the $21,400 resistance zone is in focus. Sustained movement above this level, especially on strong volume, would confirm bullish momentum.
Target projection: If the breakout holds, the next upside target lies at $21,625–$21,900 based on recent Fibonacci extensions and upward channel projections. In a strong bullish continuation, $22,100 could be in play.
Opening expectation: Futures suggest a mildly positive start to the week, with markets cautiously optimistic following ECB rate cut expectations and US job data.
Support zone: Immediate support lies at $20,900, with stronger support at $20,650–$20,700. A breakdown below this zone could invite deeper corrective moves towards $20,400.
Strategy: Bullish bias if price holds above $21,400, targeting $21,750+ with tight trailing stops. Caution warranted ahead of Friday’s non-farm payrolls — a weaker-than-expected print could increase volatility.
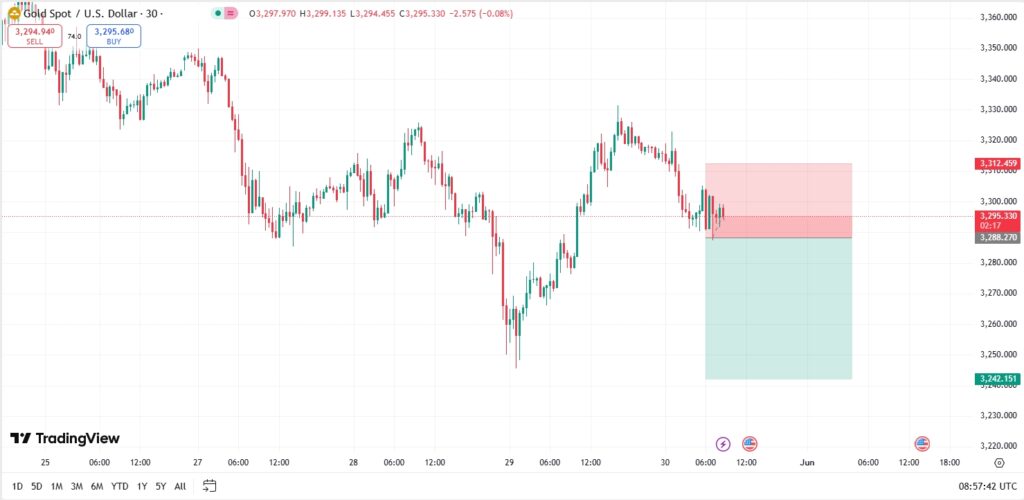
Technical breakout: Gold is currently trading around $3,300, consolidating within a symmetrical triangle pattern. A decisive breakout above $3,325–$3,330 could signal a bullish continuation, potentially targeting higher resistance levels. Conversely, a breakdown below $3,280 may indicate a bearish trend, opening the path to lower support zones.
Target projection (bearish scenario): A drop below $3,280 may see gold prices decline towards $3,250, and potentially further to $3,200 if selling pressure intensifies.
Opening expectation: The market is expected to open near the $3,300 level, reflecting a neutral stance as traders await key economic data releases. Price action is likely to remain range-bound until a clear directional catalyst emerges.
Support zone: Primary support: $3,280–$3,250, secondary support: $3,200. These levels are critical; a breach below could accelerate downward momentum.
Strategy (bearish approach): Short positions may be viable if price breaks below $3,280, aiming for $3,250 and $3,200.
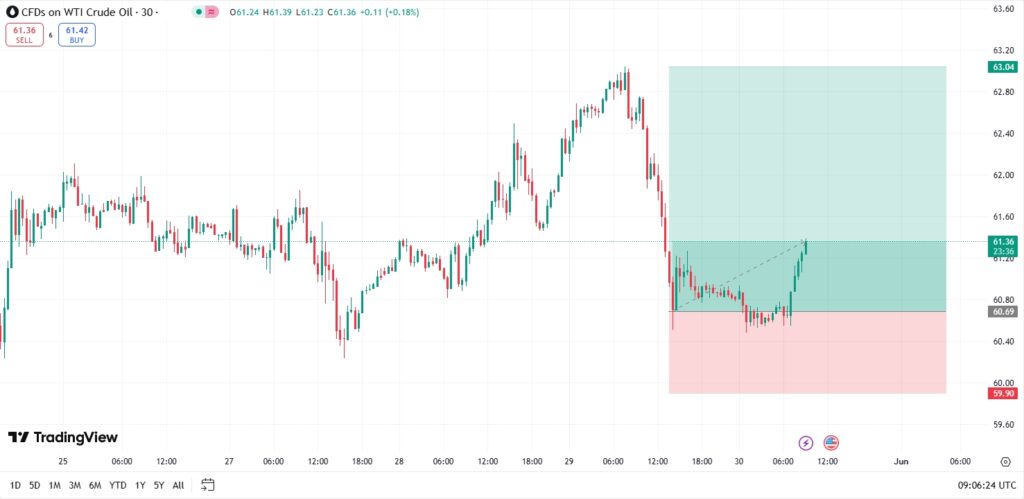
Technical breakout: WTI crude oil is currently trading around $61.12, exhibiting a bearish trend. A decisive break below the $60.09 support level could signal further downside potential. Conversely, a sustained move above $61.46 may indicate a bullish reversal, targeting higher resistance levels.
Target projection (bullish scenario): A breakout above $61.46 could lead to a rally towards $63.74, with further momentum potentially reaching $64.19.
Opening expectation: The market is expected to open near the $61.12 level, reflecting cautious sentiment amid concerns over potential OPEC+ production increases and global demand uncertainties.
Support zone: Primary support: $60.09, secondary support: $59.10, third support: $58.14.
Strategy (bullish approach): Long positions may be viable on a confirmed breakout above $61.46, aiming for $63.74 and $64.19, with a stop-loss below $60.09.
European Central Bank policymakers are expected to deliver a final interest rate cut in June before entering a pause phase, as evolving economic conditions warrant a more cautious approach.
Seasonal trends point to potential strength in EUR/USD and AUD/USD in June, offering bullish momentum for both currency pairs amid dovish policy expectations.
Oil slips, tech shines, tariffs weigh
WTI crude oil prices have dropped to four-year lows, driven by accelerated production hikes from OPEC+, fuelling concerns over a growing supply glut.
Gold futures edged lower as a strengthening US dollar dampened investor demand for the precious metal.
Wall Street futures slipped as renewed tariff concerns resurfaced following a US federal appeals court ruling.
Meanwhile, strong earnings from AI leader Nvidia helped offset broader uncertainty, boosting investor confidence in the technology sector.
India gains, Japan slows
Japan’s factory output declined by 0.9% month-on-month in April, signalling ongoing challenges in its manufacturing sector.
In contrast, India’s GDP growth gained pace in the March quarter, supported by robust rural demand and increased state spending, suggesting growing economic momentum.
The Japanese yen is drawing increased attention from traders as shifting inflation dynamics and policy expectations begin to reshape the currency landscape. Recent developments in Tokyo’s economic data have revived discussions around the Bank of Japan’s next moves, while global uncertainty is driving investors towards safer assets.
Yen strengthens as Tokyo inflation fuels policy shift hopes
The Japanese yen continued to gain ground on Friday, breaking decisively below the 144.00 level against the US dollar.
This move followed unexpectedly strong inflation data out of Tokyo, fuelling renewed speculation that the Bank of Japan (BoJ) could begin tightening monetary policy sooner than previously anticipated by the markets.
Prices in Tokyo jumped the most in two years, in a worrisome sign for Prime Minister Shigeru Ishiba https://t.co/v1V8v7OXF9
The Tokyo core Consumer Price Index (CPI), often viewed as an early indicator of national inflation trends, posted a higher-than-expected reading.
This surprise prompted traders to reassess their interest rate outlook, with market consensus now leaning towards a potential 25 basis point hike in July.
Overnight index swaps have begun pricing in increased odds of further gradual policy tightening by the BoJ throughout the remainder of 2025.
Policy insights and domestic pressures
In comments delivered on Friday, BoJ Governor Kazuo Ueda addressed the bank’s recent downgrade of its inflation forecast. He attributed the revision to a range of external factors, including lingering trade uncertainties, a decline in cost-push inflation, and weaker global oil prices.
Despite this, Ueda reaffirmed the central bank’s commitment to its 2% inflation target, suggesting that future policy moves will be guided primarily by domestic factors such as wage growth and consumer spending.
As one of the few major central banks still transitioning away from ultra-loose monetary policy, the BoJ’s cautious approach makes the yen especially sensitive to any signs of rising inflation.
Analysts expect a gradual shift towards policy normalisation, especially if domestic demand shows signs of resilience.
Geopolitical risk boosts safe-haven demand
The yen also benefitted from heightened demand for safe-haven assets after a US appeals court reinstated former President Trump’s reciprocal tariff initiative.
The legal reversal sparked fresh concerns over escalating trade tensions, reversing earlier risk-on sentiment and putting downward pressure on the US dollar.
Traditional safe havens, including the yen and the Swiss franc, saw renewed inflows as investor sentiment turned cautious.
This latest development adds another layer of uncertainty for global trade, particularly in Asia. With its sizeable trade surplus and deep integration into global supply chains, Japan may once again find itself under scrutiny if protectionist measures from the US begin to escalate.
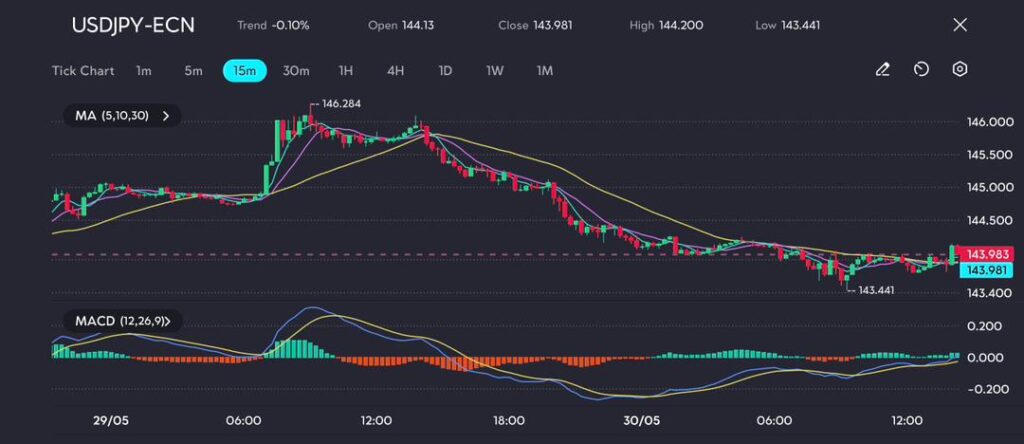
On 29 May, USD/JPY briefly touched a session high of 146.284 before reversing course and entering a sustained downtrend that extended into 30 May.
Price action remains consistently below the 30-period moving average, a clear indication of bearish market sentiment.
USD/JPY drops from 146.28 to 143.44, bearish trend persists below key moving averages, as seen on the VT Markets app.
Attempts at short-term recoveries have repeatedly met resistance at the 10- and 30-period moving average crossovers.
The MACD indicator crossed below its signal line during the initial stages of the decline and has continued to signal weakness, although the histogram is now hinting at early stabilisation.
Key support is forming near 143.441, with price consolidating just above this level.
A break below could open the door to further losses towards the 143.00 zone, while a return above 144.20 would be needed to alter the near-term bearish outlook.
Unless USD/JPY can reclaim the 144.50 area in early trading next week, a retest of the 143.00–143.40 support region is likely.
However, upcoming US inflation and employment data could significantly influence the pair’s direction.
A stronger-than-expected print may revive expectations of further tightening by the Federal Reserve, potentially limiting further yen appreciation.
Outlook: Yen strength underpinned by fundamentals and global caution
At present, bullish momentum for the yen remains firmly in place, supported by both solid domestic inflation signals and rising global economic uncertainty.
Stronger-than-expected price data from Tokyo has bolstered confidence that the Bank of Japan may be preparing to gradually move away from its ultra-loose stance, reinforcing the yen’s appeal.
At the same time, growing concerns around trade tensions and broader geopolitical risk have reignited demand for traditional safe-haven currencies.
As markets turn their attention to upcoming US inflation and labour market figures, the near-term trajectory of USD/JPY will likely hinge on a delicate balance between domestic monetary policy signals and shifting global risk sentiment.
Unless there is a significant surprise from US macro indicators, the current environment appears favourable for continued yen strength—though volatility is expected to remain elevated.
Please note that the dividends of the following products will be adjusted accordingly. Index dividends will be executed separately through a balance statement directly to your trading account, and the comment will be in the following format “Div & Product Name & Net Volume”.
Please refer to the table below for more details:
The above data is for reference only, please refer to the MT4/MT5 software for specific data.
If you’d like more information, please don’t hesitate to contact info@vtmarkets.com.
We are proud to be a Diamond exhibitor at Money Expo Colombia, one of Latin America’s premier financial events. Connect with top industry leaders, investors, and traders over two days of insightful talks, networking, and market innovation.
This event brings together the best in finance to explore:
• Forex, stocks, indices, gold, and crypto
• Trading platforms and tools
• Investment strategies and fintech developments
Featured Session Forex, Indices, Gold, or Crypto: Choose the Ideal Asset for Your Trading Style
Speaker: Jonathan Vargas, Team Leader of Business Development, VT Markets
Date: 25 June
Time: 11:15 am – 11.30 am
Explore how to align your trading strategy with the right asset class. Jonathan will share expert insights on choosing between forex, indices, gold, and crypto — based on risk profile, market conditions, and your trading approach.
About Jonathan Vargas:
• Team Leader of Business Development at VT Markets
• 5+ years of experience in market analysis and strategic growth
• Key figure in VT Markets’ expansion across Latin America and Spain
• Known for strong analytical skills and results-driven leadership
Venue: Ágora Bogotá Convention Center in Bogotá, Colombia. Date: 25th – 26th June 2025 Time: 10:00 AM to 6:00 PM (UTC -5).
The Rankia Markets Experience unites financial experts, investors, traders, and enthusiasts for high-value educational conferences. It offers up-to-date knowledge on financial markets, technical analysis, investment strategies, financial products, and finance technologies. Suitable for both experienced investors and beginners, the event promotes financial education with practical tools and strategies, providing a unique opportunity to learn from top experts and network with peers.
Featured Session
Speaker: Vitoria Saddi, Country Manager – Brazil, VT Markets
In this session, Vitoria will share actionable insights on navigating the toughest hurdles traders face today.
About Vitoria Saddi:
• Country Manager for Brazil at VT Markets
• Formerly held leadership roles at Pacific Financial Derivatives, FX Primus, and City Credit Capital
• Ex-Head of Derivatives & Structured Products at JP Morgan Alternative Asset Management, NYC
• Advised on the Greek debt restructuring and served as Chief Economist for Latin America at major institutions including Citibank
• Co-founded and contributed market insights to Seeking Alph
Venue: Espaço Fit Eventos – Nações Unidas Date: 25th June 2025 Time: 9am – 6pm (UTC -3)
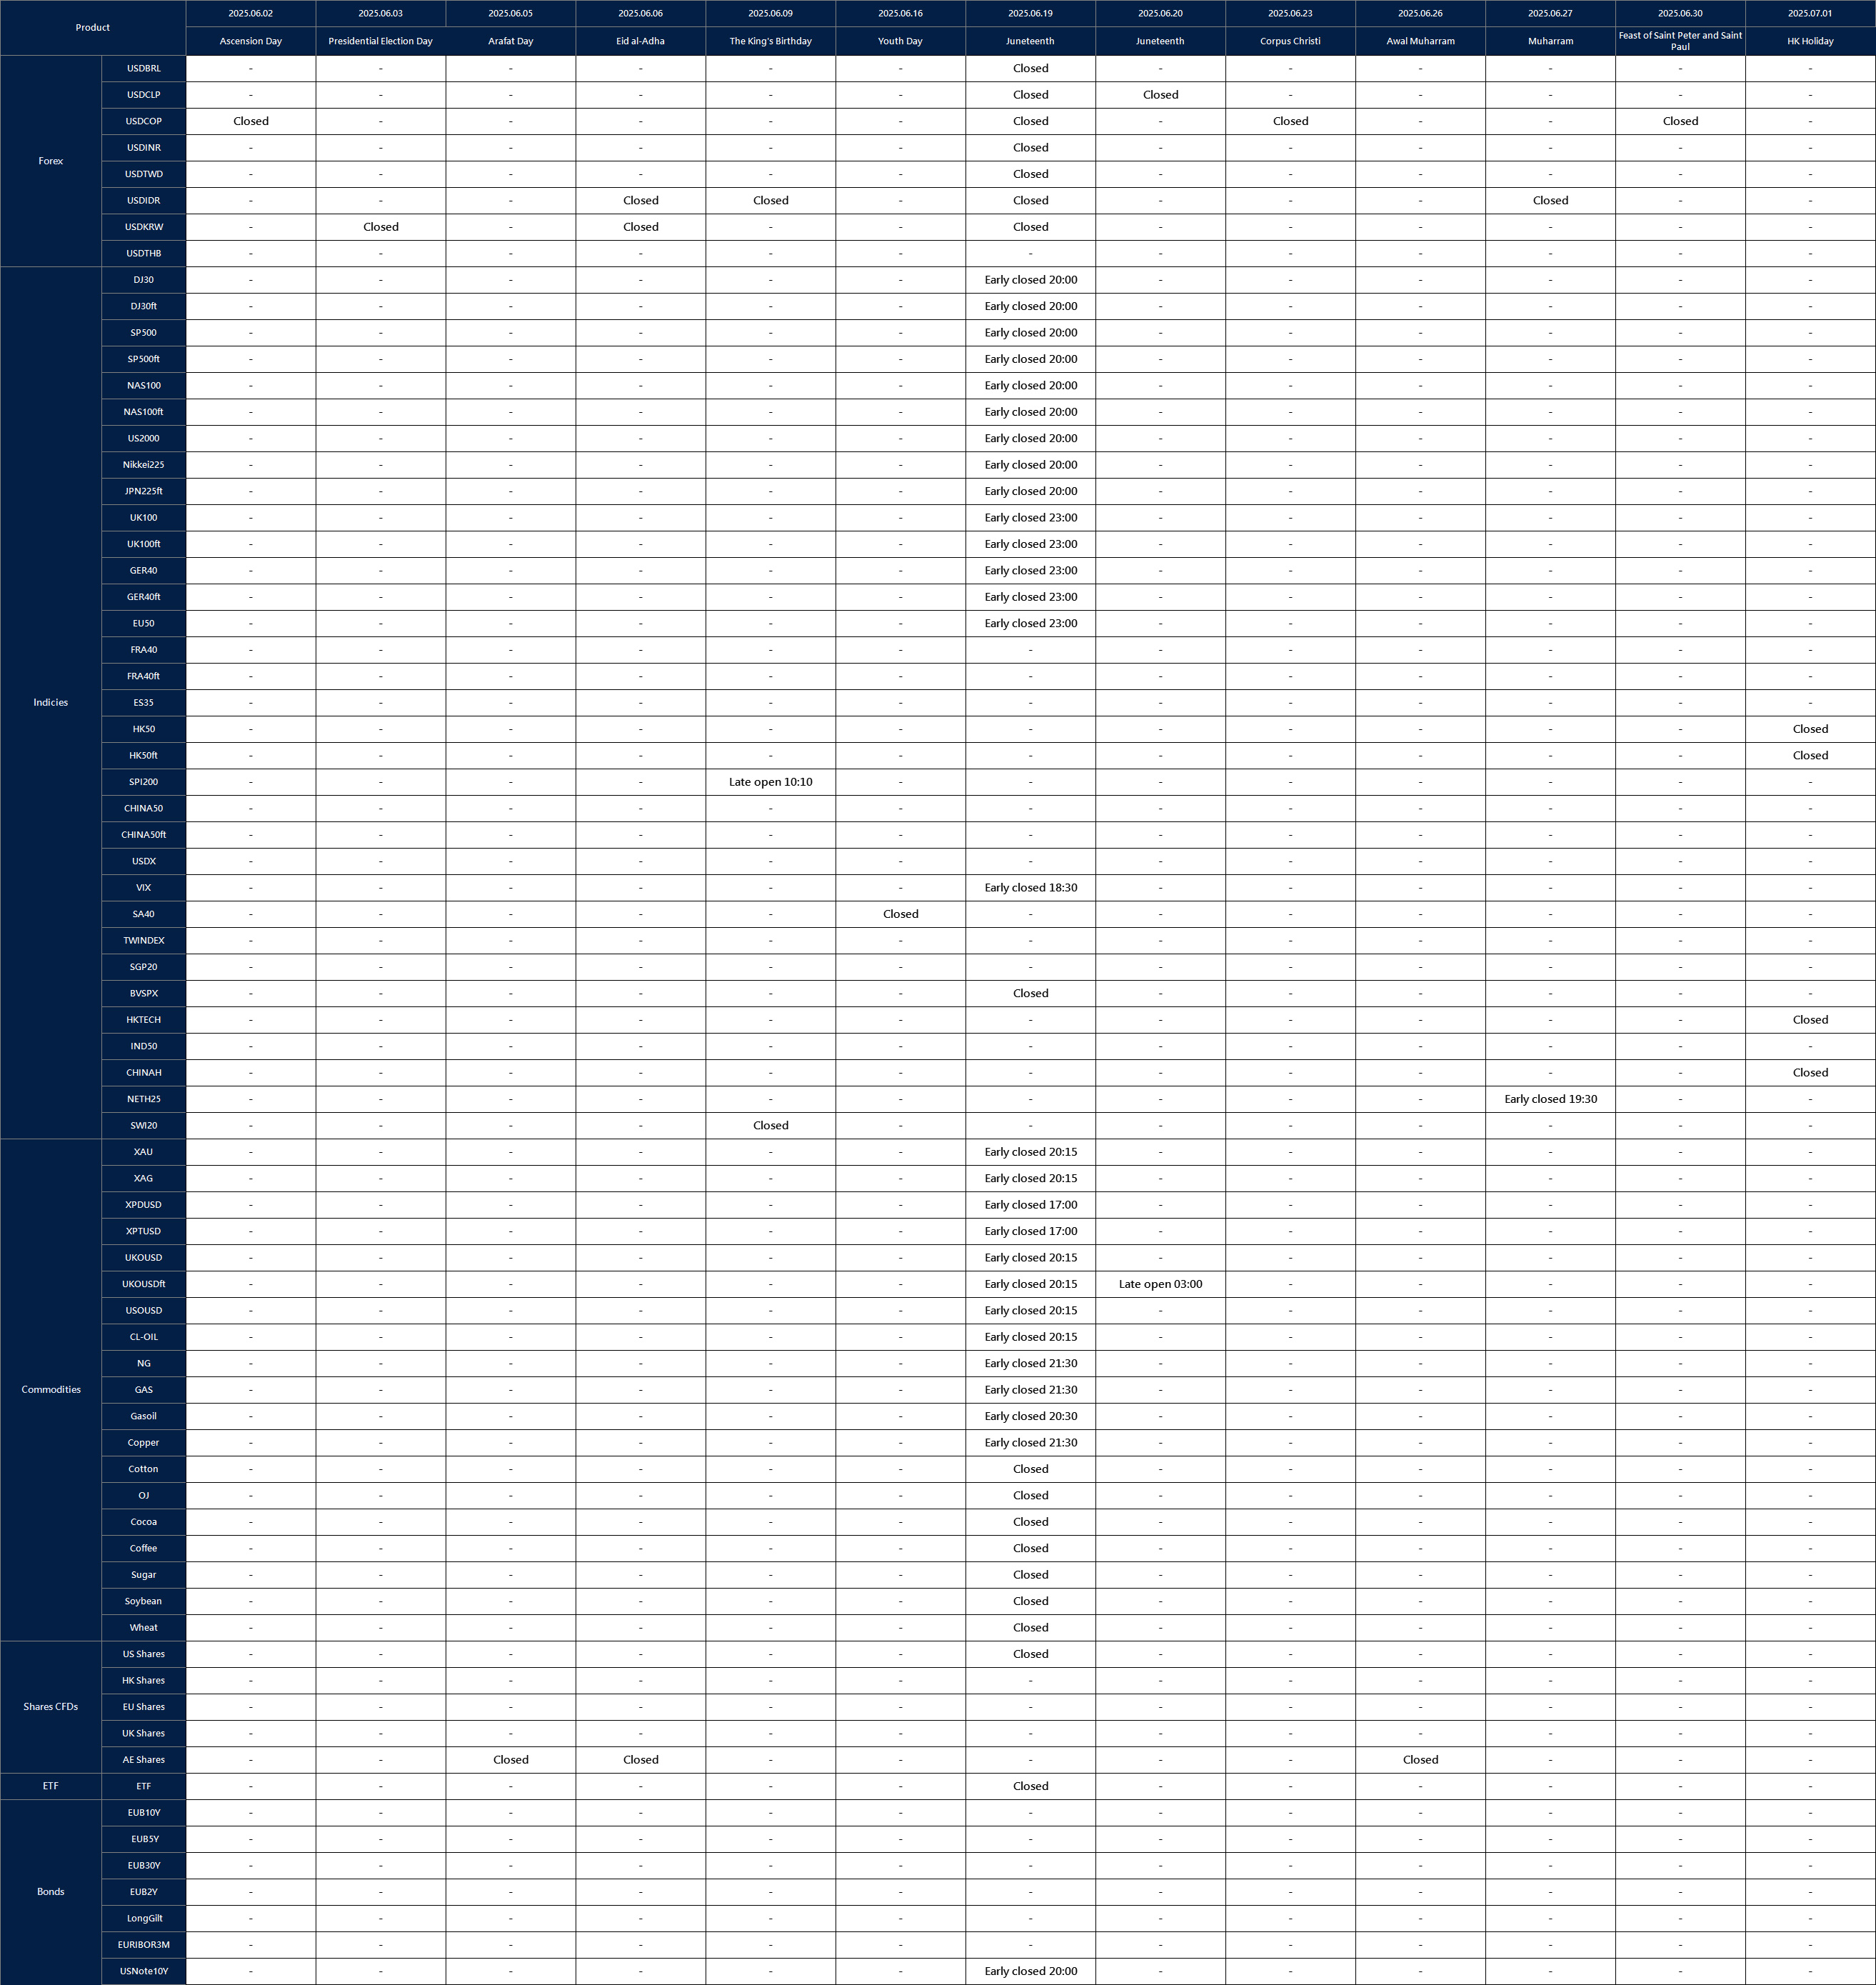
Affected by international holidays, the trading hours of some VT Markets products will be adjusted. Please check the following link for the affected products:
Please note that the dividends of the following products will be adjusted accordingly. Index dividends will be executed separately through a balance statement directly to your trading account, and the comment will be in the following format “Div & Product Name & Net Volume”.
Please refer to the table below for more details:
The above data is for reference only, please refer to the MT4/MT5 software for specific data.
If you’d like more information, please don’t hesitate to contact info@vtmarkets.com.
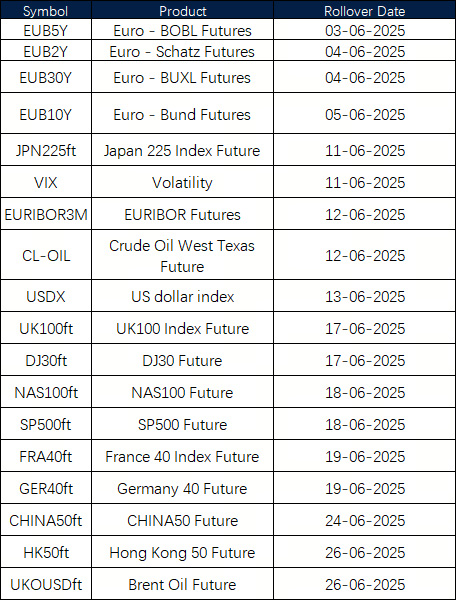
New contracts will automatically be rolled over as follows:
Please note:
• The rollover will be automatic, and any existing open positions will remain open.
• Positions that are open on the expiration date will be adjusted via a rollover charge or credit to reflect the price difference between the expiring and new contracts.
• To avoid CFD rollovers, clients can choose to close any open CFD positions prior to the expiration date.
• Please ensure that all take-profit and stop-loss settings are adjusted before the rollover occurs.
• All internal transfers for accounts under the same name will be prohibited during the first and last 30 minutes of the trading hours on the rollover dates.
If you’d like more information, please don’t hesitate to contact info@vtmarkets.com.
A key US court ruling has shaken up markets, halting a major tariff plan and prompting a shift in investor sentiment. The decision sparked renewed appetite for risk assets and strengthened the US dollar, though uncertainty remains as an appeal moves forward and fiscal concerns linger.
US Dollar Index climbs past 100.00 as court blocks Trump’s tariff plan
The US Dollar Index (DXY) surged on Thursday, breaking above the key 100.00 level after a federal court blocked former President Donald Trump’s wide-reaching import tariffs.
The ruling triggered a rally across equity futures and led to a broad pullback in safe-haven currencies, including the Japanese yen and Swiss franc.
If high tariffs and an appreciating yen mean the end of the carry trade, the US dollar will be the canary in the coal mine for all US assets. https://t.co/UaKpv9Z8UN
Investor sentiment shifted sharply into “risk-on” mode, with S&P 500 futures jumping by 1.5%. The removal of immediate tariff risks prompted traders to exit defensive positions, favouring risk assets instead.
At the same time, US Treasury yields moved higher, with the 10-year yield climbing 4.4 basis points to 4.52%, and the 2-year rising 6 basis points to 4.05%.
These yield gains enhanced the dollar’s appeal as capital flowed towards higher-yielding US assets.
Legal uncertainty and fiscal risks still linger
Despite the market’s initial optimism, legal and fiscal uncertainties remain. The Trump administration has filed an appeal against the court ruling, raising the likelihood of the case progressing rapidly through the legal system, potentially reaching the Supreme Court.
This development introduces a degree of unpredictability that has not yet been fully priced into the markets. A successful appeal could reverse the current bullish momentum in the dollar.
Beyond legal concerns, the ruling also casts fresh doubt on the sustainability of US fiscal policy. The blocked tariffs were expected to generate revenue that would help offset the fiscal burden of Trump’s tax cuts and spending initiatives—already projected to add around $3.8 trillion to the national debt over the next decade.
Without this revenue, pressure on the federal budget could intensify. Should inflationary concerns re-emerge, longer-term US Treasuries might come under pressure, potentially weakening the dollar over time.
Technical analysis: Dollar rally pauses near key resistance
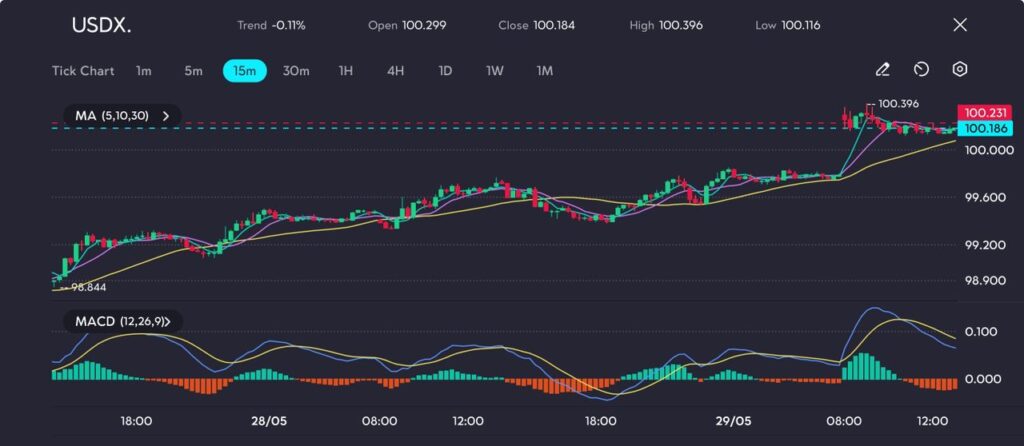
From a technical perspective, the US Dollar Index rebounded from the 96.844 low observed on 28 May, climbing steadily to challenge resistance at 100.396 before entering a consolidation phase.
The 30-period moving average acted as dynamic support throughout the session, underlining the strength of the uptrend.
USDX nears 100.40 after rising from 96.84. While momentum is easing, trend support remains intact, as seen on the VT Markets app.
The MACD indicator registered a bullish crossover during the breakout, with momentum peaking shortly thereafter.
However, a flattening MACD histogram now points to a potential slowdown in bullish momentum.
Despite this, the DXY remains above short-term moving averages and continues to hold the psychologically significant 100.00 level.
A decisive break above 100.40 could open the door to further gains in the short term.
Caution is still warranted. With the Trump administration’s appeal underway, the legal battle surrounding the tariffs is far from over.
Traders are closely monitoring whether the Supreme Court will intervene — a development that could reignite volatility across both currency and bond markets.


 | VT Markets")

 | VT Markets")


 | VT Markets")


