What is the VIX & How to Trade the Volatility Index?

Understanding the Volatility Index (VIX)

In this article, we explain what the VIX Index is and how it serves as a key market volatility indicator. You’ll learn how to trade the Volatility Index through various methods, including VIX futures, options, and ETFs, providing you with greater opportunities to navigate and take advantage of market fluctuations.

What is the Volatility Index (VIX)?

The volatility index, commonly known as the VIX, is a crucial financial tool used to measure market expectations for future volatility. Often referred to as the “fear gauge,” the VIX reflects the degree of fear or uncertainty in the stock market. When the VIX is high, it indicates that traders expect significant price fluctuations, usually due to market turmoil. Conversely, a low VIX suggests calm market conditions. The VIX is based on S&P 500 options’ implied volatility and helps traders predict potential market movements. Created in 1993 by the Chicago Board Options Exchange (CBOE), the VIX serves as a benchmark for market volatility.

What Does the VIX Measure?

The VIX measures the implied volatility of options on the S&P 500 Index over the next 30 days. In simpler terms, it indicates how much market participants expect the price of the S&P 500 to fluctuate. A higher VIX indicates greater expected volatility, while a lower VIX suggests a more stable market. The VIX is closely watched by traders, as it often moves inversely to the stock market—when the market declines, the VIX tends to rise, and when the market rallies, the VIX usually falls.

How to Calculate the VIX?

The VIX is calculated based on the prices of S&P 500 options, reflecting market expectations of volatility. It takes into account both out-of-the-money puts and calls, with the idea that the more expensive these options become, the higher the expected market volatility. Essentially, the VIX is a weighted average of implied volatilities across all relevant options, using an algorithm that models the expected volatility of the market over the next 30 days.

Although the formula behind the VIX is complex, the index provides a simple way for traders to understand the market’s sentiment. The VIX is updated throughout the day, ensuring that traders have real-time data on market expectations.

Why Trade the VIX?

Trading the VIX offers a unique opportunity to profit from market volatility. Unlike traditional asset classes such as stocks and bonds, the VIX allows traders to take positions directly on future market swings. Here are some key reasons traders choose to trade the VIX:

Hedge Against Market Declines: The VIX rises when the stock market falls, making it a useful hedge during downturns. Traders use VIX-related products to offset potential losses in equities, as it provides a counterbalance when stocks drop.

Profit from Volatility: Traders can profit from rising volatility by trading VIX futures, options, or ETFs. When volatility spikes due to market events, these instruments can provide profitable opportunities.

Diversify Your Portfolio: The VIX often moves inversely to stocks, providing diversification. Adding VIX-related products can help reduce risk and stabilize returns during volatile market conditions.

How to Trade the VIX Index?

Below are the essential steps to help you understand and trade the VIX Index effectively, whether you’re using VIX futures, options, or ETFs. Follow this guide to start trading with confidence and manage risk.

Step 1: Understand the VIX and Its Role in the Market

The VIX measures market volatility and reflects investor sentiment, often moving inversely to the stock market. When the VIX rises, it indicates increased fear or uncertainty in the market, while a drop suggests calmer conditions. Understanding how the VIX works is essential before diving into trading.

Step 2: Choose a Reliable Broker & Open Your Account

Select a regulated and reliable broker like VT Markets,which offers access to VIX-related products, such as futures, options, or ETFs. Ensure the broker provides a user-friendly platform and competitive fees. Open a standard account or a margin account based on the products you wish to trade.

Step 3: Choose a Trading Method

VIX Futures: Trade the VIX directly through futures contracts. VIX futures allow you to speculate on its future movement. Open a margin account, and buy or sell futures contracts based on your market outlook.

VIX Options: VIX options give you the right to buy or sell VIX futures at a set price before expiration. Use options to speculate on volatility or hedge your positions. Calls can be used when expecting volatility to rise, while puts are ideal for declining volatility.

VIX ETFs & ETNs: If you prefer a simpler method, trade VIX ETFs or ETNs (like VXX or UVXY) that track the performance of the VIX index. You can trade them like regular stocks through your brokerage account.

Step 4: Execute Your First Trade

Once you’ve chosen your trading method, place your order through your broker’s platform. Whether you’re buying VIX futures, options, or ETFs, ensure your order aligns with your market expectations and trading strategy.

Step 5: Use Risk Management Strategies

VIX trading can be volatile, so it’s essential to use proper risk management tools. Set stop-loss orders to limit potential losses and consider using position sizing to control risk. Always evaluate how much capital you’re willing to risk on each trade.

Step 6: Stay Informed with Market Updates

Monitor market conditions and stay up-to-date with financial news, economic reports, and events that might affect volatility. Understanding market sentiment and current events will help you anticipate shifts in the VIX and improve your decision-making.

Conclusion

The VIX is a valuable tool for gauging market sentiment and managing risk, offering opportunities to hedge or speculate on volatility. Traders use it to hedge risk, speculate on market fluctuations, and diversify their portfolios. While trading the VIX can be highly profitable, it also involves significant risk due to the complexity of volatility-related products.

Whether you’re looking to hedge against a market decline or profit from anticipated market swings, learning how to trade the volatility index can open new opportunities. With the right strategies, trading volatility index products can be a valuable addition to your trading toolkit.

Trade the Volatility Index with VT Markets

Start trading the VIX today with VT Markets, where you can access advanced trading tools and resources to enhance your VIX trading experience. Our platform offers seamless integration with MetaTrader 4 and MetaTrader 5, allowing you to trade VIX futures, options, or ETFs with ease. You can also open a demo account to practice and refine your trading strategies before trading with real capital. Whether you’re a beginner or an experienced trader, VT Markets provides the support and features you need to navigate volatility and manage risk effectively.

Frequently Asked Questions (FAQs)

1. What is the VIX? 

The VIX is an index that measures the market’s expected volatility over the next 30 days based on S&P 500 options.

2. How does the VIX work? 

The VIX works by calculating the implied volatility of S&P 500 options. It provides an indication of market sentiment, where higher VIX values indicate greater expected volatility.

3. How to trade volatility index products? 

Traders can trade VIX futures, options, ETFs, and ETNs. These instruments offer different levels of risk and complexity, allowing traders to choose the best strategy for their objectives.

4. What is the best strategy for VIX trading? 

The best strategy depends on market conditions and your risk tolerance. Some traders use VIX as a hedge against stock market declines, while others use it to profit from anticipated volatility spikes.

5. What is the difference between the VIX and the VXN?

The VIX tracks the S&P 500 volatility, while the VXN measures volatility for the Nasdaq-100 Index, reflecting market conditions in tech-heavy sectors.

6. What factors impact the VIX?

The VIX is influenced by economic data, corporate earnings, geopolitical events, and overall market sentiment.

7. Is trading the VIX suitable for long-term investments?

The VIX is primarily used for short-term strategies like hedging or speculation, rather than long-term investing due to its volatility.

Forex market analysis: 24 March 2025

The trading week begins with a focus on European business sentiment and US economic activity, setting the stage for broader market trends. Investors will be looking for early signs of economic resilience or weakness following recent central bank decisions.

KEY INDICATORS

Germany Ifo business climate index (March)

  • A key indicator of business confidence in Germany, the Eurozone’s largest economy.
  • Any weakness could weigh on the euro and European equity markets.

US Chicago Fed national activity index (February)

  • A composite measure of economic activity and inflationary pressure in the US.
  • A strong reading may reinforce hawkish Federal Reserve expectations, impacting bonds and the dollar.

Market positioning after Fed rate decision (19 March)

  • Investors will react to any shifts in sentiment following the Federal Reserve’s recent policy announcement.
  • Expect volatility in US equities, the dollar, and Treasuries as traders digest the Fed’s long-term outlook.

MARKET MOVERS

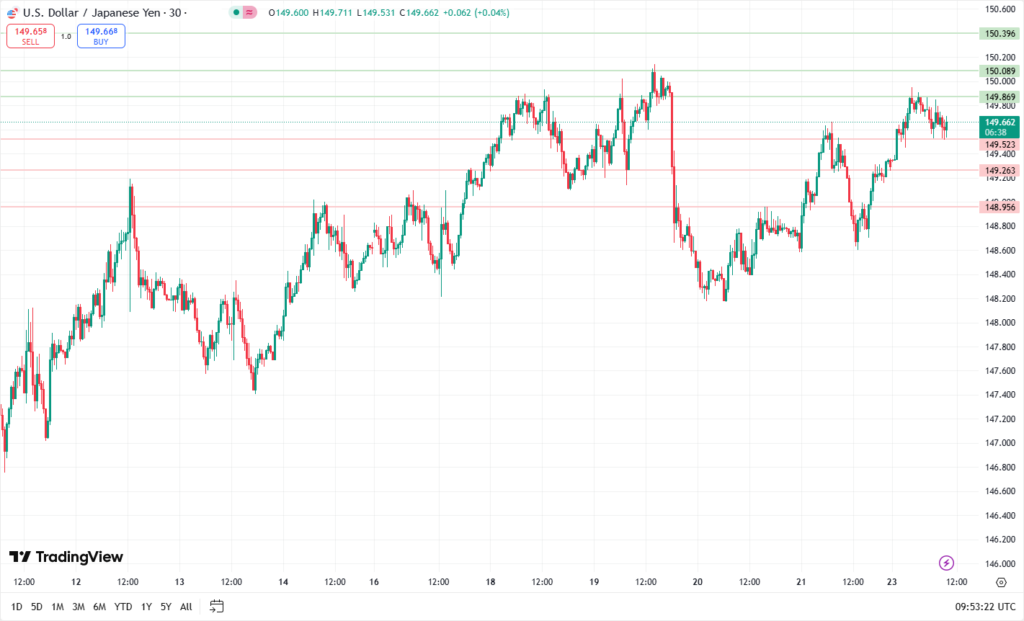
USD/JPY

Possible short preference

Short positions below 149.523 with targets at 149.263 & 148.956 in extension.

Alternative scenario

Above 149.869 look for further upside with 150.089 & 150.396 as targets.

The RSI is mixed.

BofA sees potential for a strong dollar rebound on portfolio rebalancing

  • Bank of America (BofA) analysts have highlighted significant currency rebalancing needs that could drive a robust rebound for the US dollar.
  • According to their research, an expected shift in investment flows towards dollar-denominated assets, particularly equities, may occur, as US equities have underperformed compared to their European counterparts.
  • BofA’s analysis suggests a substantial rebalancing inflow into the dollar, quantified at +2.6 standard deviations (σ), while predicting outflows from the euro (EUR), Japanese yen (JPY), British pound (GBP), and emerging market (EM) currencies.
  • The analysts at BofA recommend hedging strategies in anticipation of these shifts, specifically suggesting 2-week put options on the EUR/USD pair, expiring on 2 April 2025, which coincides with the deadline for the upcoming tariffs.

Gold prices pull back from record high on reports of softer Trump tariffs

Gold prices fell in Asian trading on Monday, retreating further from record highs after reports suggested that US President Donald Trump’s 2 April tariffs will be less severe than initially feared, dampening demand for safe-haven assets.

Despite the decline, gold remained close to recent peaks, as ongoing uncertainty over the US economy and Trump’s broader tariff plans continued to support safe-haven buying.

  • Spot gold slipped 0.2% to USD 3,018.51 per ounce.
  • Gold futures expiring in May steadied at USD 3,049.30/oz.
  • Spot prices reached a record high of USD 3,057.50/oz last week.

A series of key US economic reports – including purchasing managers’ index data, the PCE price index, and a revised fourth-quarter gross domestic product figure – are due this week.

  • Platinum futures rose 0.3% to USD 981.15/oz.
  • Silver futures climbed 0.7% to USD 33.735/oz, after both metals posted losses last week.

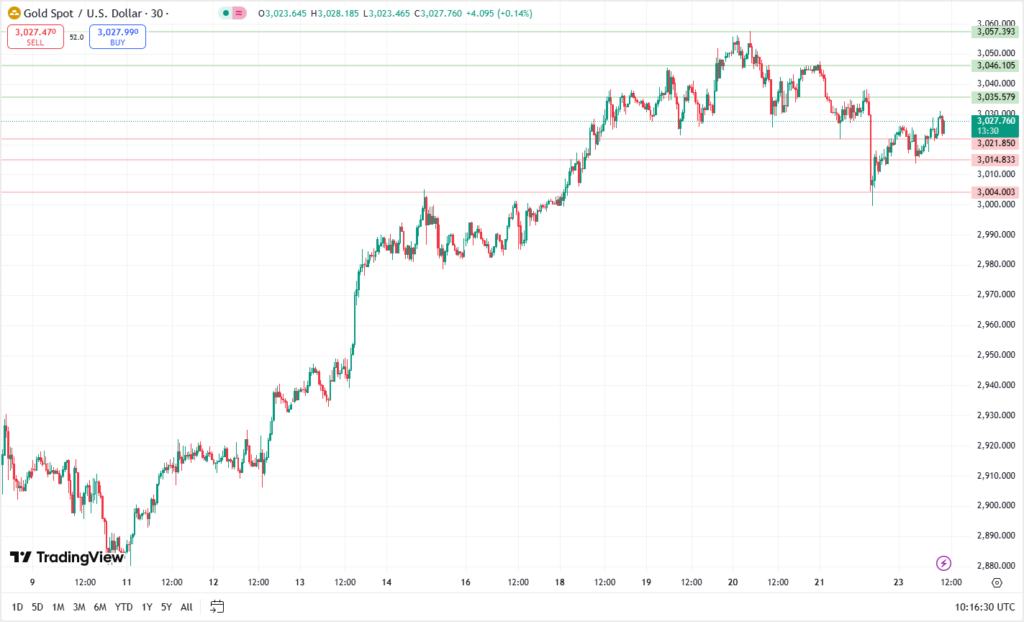
XAU/USD

Possible long preference

Long positions above 3035.57 with targets at 3046.10 & 3057.39 in extension.

Alternative scenario

Below 3021.85 look for further downside with 3014.83 & 3004.00 as targets.

The RSI is bullish and calls for further upside.

TODAY’S NEWS HEADLINES

Dow futures jump 300 points on reports Trump will hold back some tariffs

  • Stock futures rose early on Monday following reports that US President Donald Trump plans to hold back some of the tariffs initially scheduled for 2 April, raising hopes that the US will avoid plunging the global economy into an all-out trade war.
  • Futures linked to the Dow Jones Industrial Average advanced 305 points, or 0.7%.
  • S&P 500 futures gained 0.9%.
  • Nasdaq 100 futures climbed 1.2%.
  • Stocks are coming off a much-needed winning week, with the S&P 500 finishing in positive territory on Friday, thereby avoiding four consecutive weekly losses.

European markets open higher; British Airways owner IAG up 1% after Heathrow Airport restart

  • European markets opened higher on Monday after US President Donald Trump hinted at possible tariff “flexibility.”
  • The pan-European Stoxx 600 was up 0.5% shortly after the opening bell.
  • Germany’s DAX rose 1.05%.
  • France’s CAC 40 gained 0.65%.
  • The UK’s FTSE 100 was 0.49% higher.
  • The travel and leisure sector advanced 0.8% after London’s Heathrow Airport reopened on Saturday, following a power outage caused by a fire at a nearby electrical substation that disrupted services on Friday. British Airways owner IAG rose 1% in early trading.

Oil inches up as markets weigh sanctions on Iran and Russia-Ukraine ceasefire talks

  • Oil prices edged higher on Monday as investors weighed the impact of fresh US sanctions on Iranian exports against ongoing ceasefire talks aimed at ending the Russia-Ukraine war, which could potentially increase Russian supplies to global markets.
  • Brent crude futures gained 4 cents, trading at USD 72.20 a barrel by 7:35 AM GMT.
  • US West Texas Intermediate (WTI) crude rose 8 cents, or 0.1%, to USD 68.36 a barrel, although prices had fallen earlier in the session.
  • Both benchmarks settled higher on Friday, recording a second consecutive weekly gain, as new US sanctions on Iran and the latest OPEC+ output plan raised expectations of tighter global supply.

Click here to open account and start trading.

Dividend Adjustment Notice – Mar 24 ,2025

Dear Client,

Please note that the dividends of the following products will be adjusted accordingly. Index dividends will be executed separately through a balance statement directly to your trading account, and the comment will be in the following format “Div & Product Name & Net Volume”.

Please refer to the table below for more details:

Dividend Adjustment Notice

The above data is for reference only, please refer to the MT4/MT5 software for specific data.

If you’d like more information, please don’t hesitate to contact info@vtmarkets.com.

Week ahead: Markets brace for inflation twists and oil risks

The final week of March brings a mix of inflation data, central bank speeches, and key economic indicators from the US, Europe, and Asia. Markets will assess whether recent monetary policy decisions, particularly from the Federal Reserve, have shifted investor sentiment, while also keeping an eye on global growth signals.

KEY INDICATORS

Monday, 24 March:

  • Germany Ifo Business Climate Index (March) – A key sentiment gauge for Europe’s largest economy.
  • US Chicago Fed National Activity Index (February) – Measures economic activity and inflation pressures.

Tuesday, 25 March:

  • UK inflation (CPI, February) – Crucial for the Bank of England’s next rate decision.
  • US new home sales (February) – A vital indicator of housing market health amid interest rate uncertainty.

Thursday, 27 March:

  • Eurozone economic sentiment index (March) – Reflects business and consumer confidence in the region.
  • US GDP (Q4 final estimate) – Any revision could impact Fed rate expectations.

Friday, 28 March:

  • Japan Tokyo CPI (March) – A key early indicator of Japan’s inflation trends.
  • US PCE price index (February) – The Fed’s preferred inflation gauge, crucial for the future policy outlook.

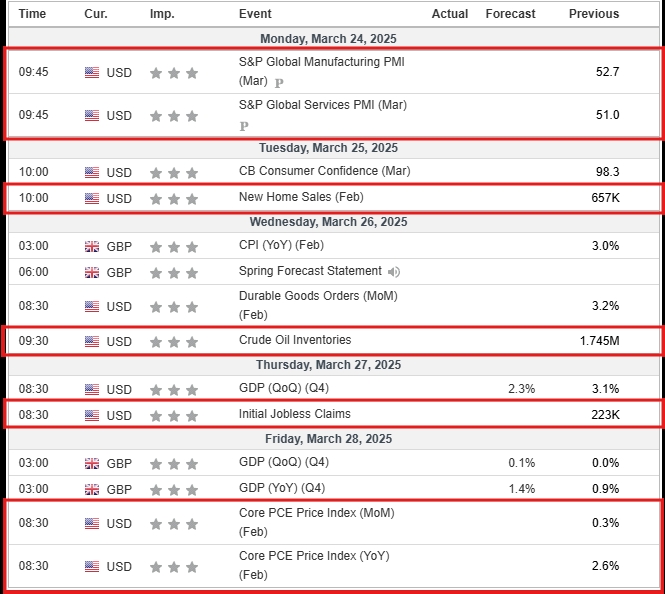
Economic calendar outlook for the coming week of 24 March 2025 to 28 March 2025, showing some of the most notable economic events to shape the second week of March. Markets are awaiting the highly anticipated CPI, new home sales, crude oil inventory, and initial jobless claims ahead of the following week’s NFP and core PCE figures.

US rebound continues while oil prices surge

US stocks have moved higher despite a choppy 24 hours, while geopolitical tensions have boosted oil!

US stocks rebound despite Fed worries

  • The Federal Reserve might be desperately signalling their worries about the US economy, but traders continue to pile back into US stocks.
  • It has been a choppy 24 hours for equity markets, especially in the US, which saw futures slumping this morning before a rebound in the afternoon.
  • For the moment, it looks like bargain hunting continues to underpin Wall Street’s rebound, at least in the short term.

Oil prices surge

  • Geopolitical tensions continue to be oil’s friend. The prospect of an extended US campaign against the Houthis combines with Israel’s renewed Gaza offensive to put oil squarely back in the spotlight.
  • After its huge falls in January, positioning remains firmly skewed to the upside, and buyers continue to take advantage of headlines to drive gains for the time being.

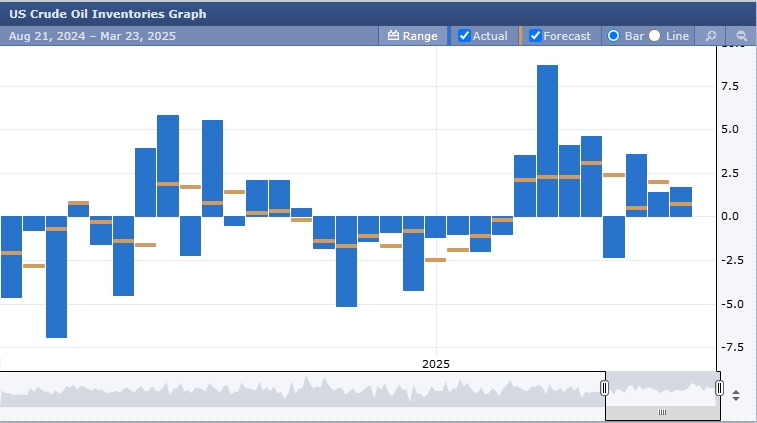
It’s the primary gauge of supply and demand imbalances in the market, which can lead to changes in production levels and price volatility. While this is a US indicator, it most affects the loonie due to Canada’s sizable energy sector.

US tightens sanctions on Iranian oil exports

  • The US further tightened the screws on Iranian oil exports, including sanctioning Chinese refiner Shandong Shouguang Luqing Petrochemical Co., Ltd for buying Iranian crude oil. The refinery’s CEO was sanctioned too.
  • The US Treasury Department also sanctioned an oil terminal in China for handling and storing Iranian oil, as well as a handful of tankers linked to a shadow fleet transporting Iranian oil.
  • Increased enforcement of US sanctions on Iranian oil exports is an upside risk to the oil market.
  • Iran exported roughly 1.4m b/d of crude oil in February, and President Trump has vowed to drive these volumes even lower.

MARKET MOVERS

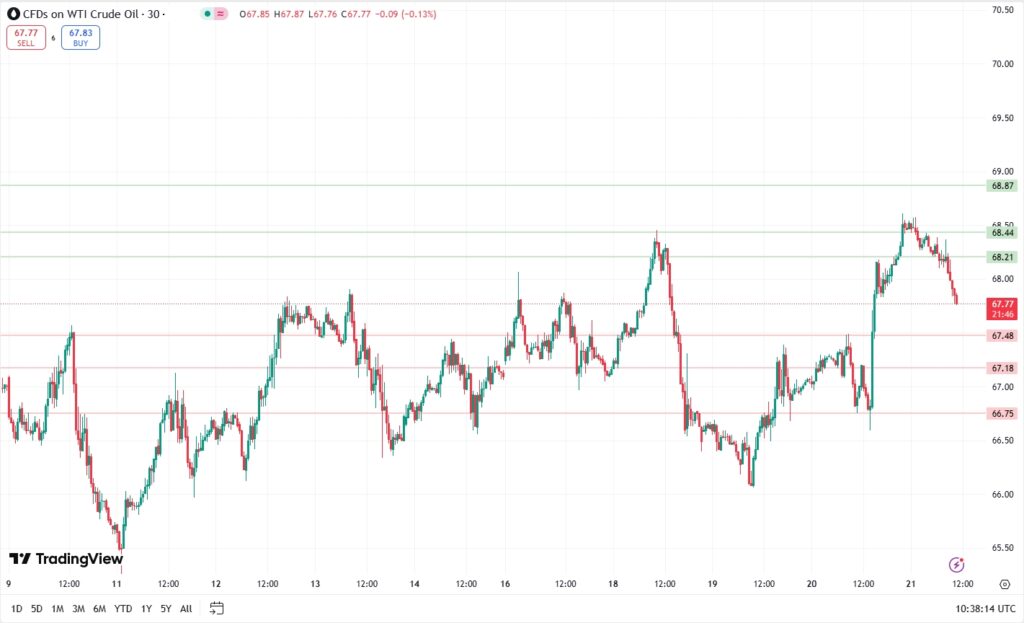
Crude oil WTI

Potential long preference

Long positions above 68.21 with targets at 68.44 & 69.87 in extension.

Alternative scenario

Below 67.48, look for further downside with 67.18 & 66.75 as targets.

Even though a continuation of the consolidation cannot be ruled out, its extent should be limited.

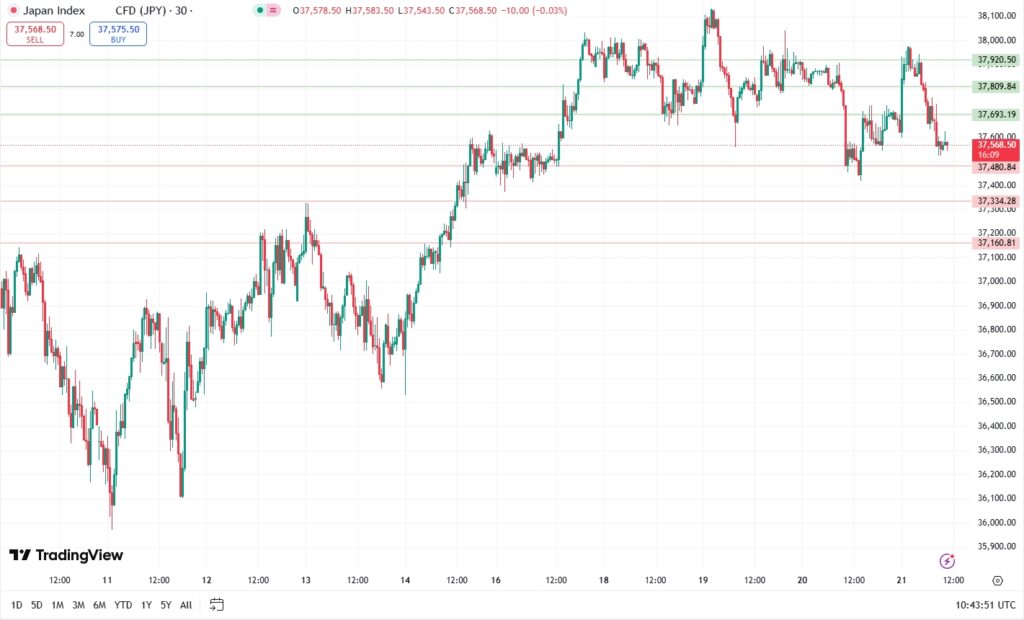
Nikkei 225

Potential short preference

Short positions below 37,480.84 with targets at 37,334.28 & 37,160.81 in extension.

Alternative scenario

Above 37,693.19, look for further upside with 37,809.84 & 37,920.50 as targets.

Even though a continuation of the technical rebound cannot be ruled out, its extent should be limited.

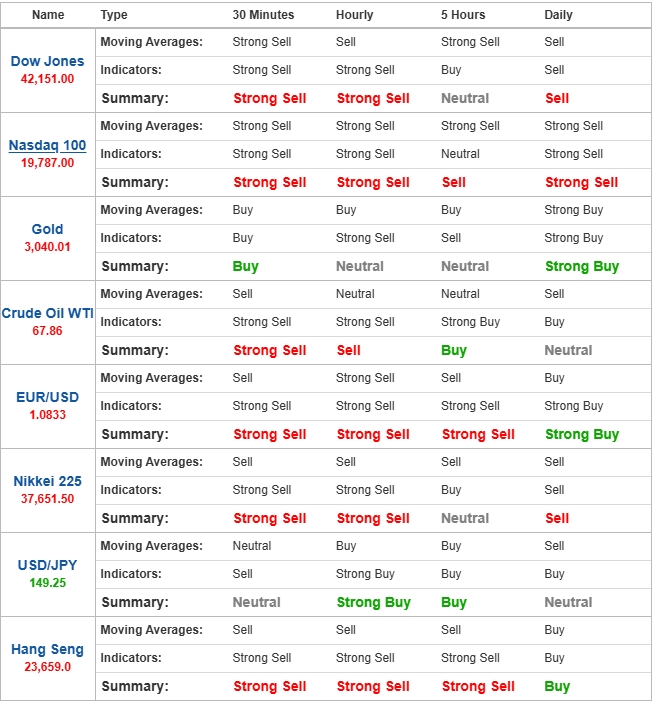
Technical indicators

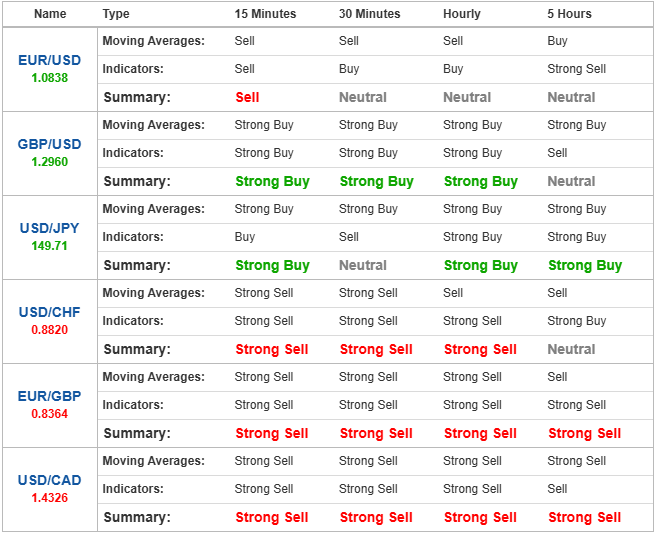
Technical indicator summary showing the volatility in various markets over a weekly period and what is to be expected, without considering the economic and fundamental events.

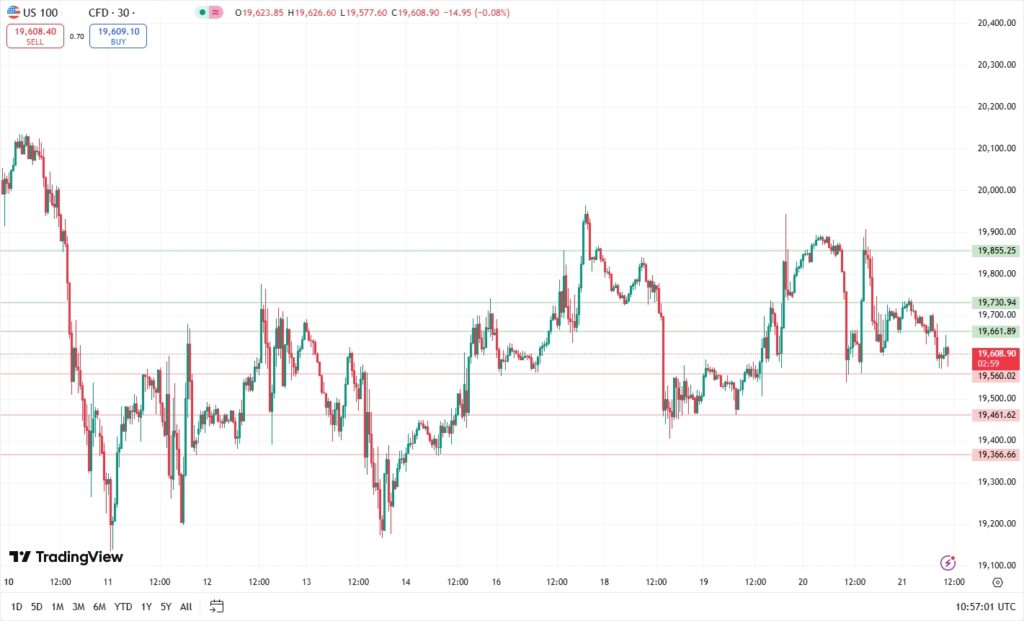
Nasdaq 100

The short preference

Short positions below 19,560.02 with targets at 19,461.62 & 19,366.66 in extension.

Alternative scenario

Above 19,661.89, look for further upside with 19,730.94 & 19,855.25 as targets.

As long as 19,661.89 is resistance, look for choppy price action with a bearish bias.

NEWS HEADLINES

Dollar continues to rebound after Fed meeting, sterling slips

  • The US dollar rose on Friday, continuing its recent rebound after the Federal Reserve saw no immediate need to cut interest rates.
  • At 9:25 AM GMT, the Dollar Index, which tracks the greenback against a basket of six other currencies, traded 0.2% higher at 103.710 after gaining around 0.4% on Thursday, bouncing further away from the five-month low touched earlier this week.
  • The Federal Reserve held its key rates unchanged earlier this week, as widely expected, and projected slower economic growth and higher inflation as the year progresses.
  • However, the US central bank also indicated no particular rush to cut interest rates, while jobless claims data released on Thursday suggested resilience in the labour market, which is one of the Fed’s main considerations in deciding monetary policy.
  • In Europe, GBP/USD fell 0.3% to 1.2926 after the Bank of England kept its key interest rate unchanged at Thursday’s policy-setting meeting.

Gold prices fall from record highs as dollar firms on easing rate cut bets

  • Gold prices fell in Asian trade on Friday, extending a fall from recent record highs amid pressure from a stronger dollar as traders bet that US interest rates will remain unchanged in the near term.
  • Spot gold fell 0.5% to USD 3,029.61/oz.
  • Gold futures expiring in May fell 0.2% to USD 3,037.09 an ounce by 4:57 AM GMT.
  • Spot prices hit a record high of USD 3,057.51/oz earlier this week.
  • Gold’s fall from record highs was driven chiefly by a recovery in the dollar, which recouped all of its losses seen after Wednesday’s Federal Reserve meeting.

US stock futures fall, FedEx cuts outlook

  • US stock index futures slipped lower on Friday as investors gauged the outlook for Federal Reserve policy against ongoing tariff worries as well as disappointing corporate earnings.
  • At 10:35 AM GMT, Dow Jones Futures fell 140 points, or 0.3%.
  • S&P 500 Futures slipped 21 points, 0.4%.
  • Nasdaq 100 Futures dropped 100 points, or 0.5%.
  • The Wall Street indexes gave up early gains to close lower on Thursday, but the benchmark S&P 500 index is on track for a 0.4% advance week-to-date, breaking a four-week losing streak.

Click here to open account and start trading.

New Products Launch – Mar 21 ,2025

Dear Client,

To provide you with more diverse trading options, VT Markets will launch 20 new products on 24th March 2025.

You can trade the world’s popular products on Meta Trader 5 with the following specifications:

New Products Launch

The above data is for reference only, please refer to the MT5 platforms for the updated data.

Friendly reminders:
1. Please refer to the MT5 platforms for the specific swap rate.

If you’d like more information, please don’t hesitate to contact info@vtmarkets.com.

FAANG Stocks: What are the FAANG Companies? 

Understanding FAANG Stocks: An Overview of the FAANG Companies

In this article, we will explore everything you need to know about FAANG stocks — Facebook (Meta), Amazon, Apple, Netflix, and Google (Alphabet). The FAANG companies have become some of the most influential and valuable in the world, driving change across industries like social media, e-commerce, and entertainment. 

What is FAANG?

FAANG is an acronym that represents a group of the most prominent and influential technology companies in the world: Facebook (Meta Platforms), Amazon, Apple, Netflix, and Google (Alphabet). These companies have reshaped various sectors, including social media, e-commerce, entertainment, and digital advertising, making them key players in the global economy. The term “FAANG” was coined to capture the dominance of these firms in the stock market, and they continue to be a popular choice among investors and market participants due to their consistent growth, innovation, and ability to adapt to changing market conditions.

A Quick Overview of All the FAANG Companies

Each of the FAANG companies has made significant contributions to their respective industries, and understanding their individual roles gives insight into their collective impact on the market:

1. Facebook (Meta Platforms)

Meta Platforms, formerly Facebook, is one of the world’s largest tech companies. It started as a social networking site in 2004 and has since expanded into virtual reality and digital advertising. As of 2025, Meta’s market capitalization is approximately $1.4 trillion, making it one of the most valuable companies globally. The company generates most of its revenue from digital advertising, and its advertising platform is one of the most lucrative in the world. Meta has over 2.8 billion active users across its platforms (Facebook, Instagram, WhatsApp, and Oculus), driving its dominant position in the social media and advertising markets.

2. Amazon

Founded in 1994 by Jeff Bezos, Amazon has grown from an online bookstore into the largest global e-commerce platform. It also leads in cloud computing with Amazon Web Services (AWS), which significantly contributes to its financial success. As of 2025, Amazon’s market capitalization stands at $2 trillion. Its financial success is driven by a mix of e-commerce, cloud services, and entertainment (Amazon Prime Video). AWS alone accounts for over 60% of Amazon’s operating income, despite representing a smaller portion of total revenue.

3. Apple

Apple is a global leader in consumer electronics, with products like the iPhone, iPad, and MacBooks. Founded in 1976, Apple has built a comprehensive ecosystem that connects its hardware, software, and services. As of 2025, Apple’s market cap is around $3.2 trillion, making it the most valuable company in the world. Apple has a robust financial position, with the iPhone being its most significant revenue generator. The company also earns a considerable portion of its revenue from services, including the App Store, Apple Music, iCloud, and Apple Pay.

4. Netflix

Netflix began as a DVD rental service in 1997 but quickly transformed the entertainment industry by pioneering streaming. With over 200 million subscribers globally, Netflix is the dominant force in streaming media. As of 2025, Netflix’s market capitalization is around $406 billion. Netflix’s financial model is based on subscription revenue, and the company has significantly invested in original content to maintain its competitive edge. Its major expenses are content production and licensing, but this investment has proven successful in driving subscriber growth and retention worldwide.

5. Google (Alphabet)

Google, now under the parent company Alphabet, was founded in 1998 and has since become the world’s most dominant search engine. It also generates significant revenue from digital advertising, cloud services, and various tech innovations. Alphabet’s market capitalization is around $2 trillion as of 2025. Google’s ad revenue dominates the digital advertising space, while its ventures like Google Cloud, YouTube, and self-driving cars (Waymo) contribute to its financial diversification. Google’s advertising revenue, primarily through Google Ads, remains its largest source of income.

Discover the top 10 largest stock exchanges in the world.

Why People Choose to Invest or Trade in FAANG Stocks?

There are several reasons why market participants and investors choose to invest or trade in FAANG stocks:

Strong Growth and Innovation: Each of the FAANG companies has a track record of rapid growth and innovation. They continue to push boundaries, creating new products and services that capture global attention.

Market Dominance: Together, the FAANG stocks represent some of the largest and most influential companies in the world. Their market capitalization often drives the performance of major stock indices like the S&P 500.

Financial Stability: FAANG companies have proven to be resilient in various market conditions. Even during periods of economic uncertainty, they tend to perform well due to their diversified revenue streams and strong business models.

Investor Sentiment: Many investors view FAANG stocks as a safe bet due to their consistent performance. Their ability to weather economic downturns and adapt to industry changes makes them a popular choice for long-term investment.

How to Trade the FAANG Stocks?

Trading FAANG stocks offers significant opportunities, but it requires a thoughtful approach to ensure success. Here’s a step-by-step guide to effectively trade FAANG stocks:

Step 1: Research and Understand the FAANG Companies

Start by researching the FAANG companies to understand their business models, financial health, and growth potential. Look at their earnings reports, recent news, and innovations to get a clearer picture of their market standing.

Step 2: Select a Reliable Trading Platform

Choose a reliable and regulated trading platform like VT Markets, which provides access to FAANG stocks, real-time data, and helpful tools for tracking market trends. Make sure the platform offers competitive spreads, secure transactions, and robust customer support.

Step 3: Open and Fund Your Trading Account

Once you’ve selected a platform, open your account and fund it based on your trading goals. Set a budget that aligns with your risk tolerance and investment strategy, and ensure you’re ready to start trading.

Step 4: Use Both Fundamental and Technical Analysis

To make informed decisions, combine fundamental analysis (e.g., company financials, market news) with technical analysis (e.g., chart patterns, price trends). This balanced approach helps you understand both the company’s value and the market’s movement.

Learn more about the difference between fundamental and technical analysis

Step 5: Open Your First Trade

Once you’ve analyzed the market, open your first trade by purchasing or selling FAANG stocks. Ensure the trade aligns with your strategy, whether you’re aiming for short-term gains or long-term growth.

Step 6: Implement Risk Management Strategies

Protect your investments by using risk management tools like stop-loss orders and position sizing. This helps mitigate potential losses and ensures you’re not exposing too much capital on a single trade.

Step 7: Monitor and Stay Informed with Market Trends

After opening your trade, stay informed by monitoring market trends, earnings announcements, and news related to the FAANG companies. This will allow you to adjust your strategy and take advantage of new opportunities.

Conclusion

In summary, FAANG stocks — Facebook (Meta), Amazon, Apple, Netflix, and Google (Alphabet) — represent some of the most influential companies in the world, shaping industries from social media to e-commerce and entertainment. Their ongoing growth, innovation, and market leadership make them highly attractive to traders and investors. Understanding the unique strengths and financial health of each company provides valuable insight into why these stocks remain key players in the global market. Whether you’re looking to trade or invest, FAANG stocks offer exciting opportunities for those ready to engage with the ever-evolving tech landscape.

Trade the FAANG Stocks with VT Markets

If you’re looking to trade FAANG stocks, VT Markets offers a powerful, user-friendly platform that integrates MetaTrader 4 and MetaTrader 5 for advanced trading. These platforms provide access to real-time market data, advanced charting tools, and comprehensive analysis features to help you make informed decisions. Whether you’re a beginner or an experienced trader, VT Markets also offers a demo account, allowing you to practice trading FAANG stocks and other global assets in a risk-free environment. With competitive spreads and a robust set of features, VT Markets is well-equipped to support traders at every level in their journey through the dynamic tech market.

Start trading today with VT Markets and take advantage of the opportunities in the fast-moving world of FAANG stocks.

Frequently Asked Questions (FAQs)

1. What is FAANG? 

FAANG stands for Facebook, Amazon, Apple, Netflix, and Google—five of the largest technology companies in the world. They are known for their strong market performance and influence across various sectors.

2. Why are FAANG stocks so popular? 

FAANG stocks are popular due to their strong growth, market dominance, financial stability, and consistent innovation. These companies are seen as reliable, long-term investments that offer substantial growth potential.

3. What factors influence the price of FAANG stocks?

The price of FAANG stocks is influenced by factors such as company earnings, market sentiment, economic conditions, innovation and product launches, regulatory changes, and competition in the tech sector.

4. How do FAANG stocks impact the overall stock market?

Due to their large market capitalizations and influence in the tech sector, FAANG stocks significantly impact major stock indices like the S&P 500 and NASDAQ. Their performance can drive market sentiment and influence investor confidence across the global market.

5. How do I start trading FAANG stocks? 

To start trading FAANG stocks, you need to choose a reliable trading platform like VT Markets, conduct thorough research on each company, select a trading strategy, and monitor your trades.

6. Can I trade FAANG stocks on MetaTrader 4 and MetaTrader 5?

Yes, FAANG stocks can be traded on both MetaTrader 4 and MetaTrader 5, as these platforms support a wide range of assets, including stocks, indices, and commodities.

7. Can I trade FAANG stocks on VT Markets? 

Yes, VT Markets provides access to a wide range of global assets, including FAANG stocks, offering traders tools to monitor, analyze, and trade efficiently.

8. What is MATANA stock?

MATANA refers to a group of high-performing tech stocks: 

  • Microsoft
  • Apple
  • Tesla
  • Amazon
  • Nvidia
  • Alphabet (Google)

9. What are the Magnificent Seven stocks?

The Magnificent Seven includes: 

  • Apple
  • Microsoft
  • Amazon
  • Nvidia
  • Alphabet (Google)
  • Meta (Facebook)
  • Tesla

Dividend Adjustment Notice – Mar 21 ,2025

Dear Client,

Please note that the dividends of the following products will be adjusted accordingly. Index dividends will be executed separately through a balance statement directly to your trading account, and the comment will be in the following format “Div & Product Name & Net Volume”.

Please refer to the table below for more details:

Dividend Adjustment Notice

The above data is for reference only, please refer to the MT4/MT5 software for specific data.

If you’d like more information, please don’t hesitate to contact info@vtmarkets.com.

Forex market analysis: 21 March 2025

The offshore yuan is feeling the pressure as the US dollar keeps gaining strength, boosted by the Federal Reserve’s cautious approach to interest rates. While the yuan’s slide reflects broader global trends, the People’s Bank of China is treading carefully, adjusting its policies to prevent sharp fluctuations. With markets closely watching for any shifts in policy from both China and the US, all eyes are on what might drive the yuan’s next move.

Offshore yuan weakens to over a one-week low

The offshore yuan (USD/CNH) slipped past the 7.25 per dollar mark on Friday, hitting its weakest level in over a week, as the US dollar maintained its upward trajectory.

The dollar’s strength was driven by hawkish remarks from Federal Reserve Chair Jerome Powell, who indicated that the Fed is not in a hurry to lower interest rates, further supporting demand for the greenback.

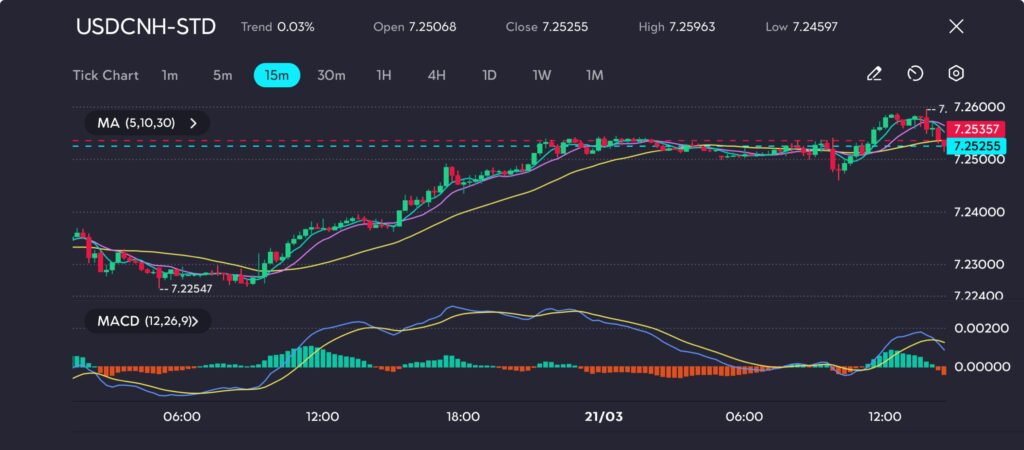
At the latest reading, the USD/CNH pair was trading at 7.25255, having touched a session high of 7.25963.

PBOC eases yuan support, holds interest rates steady

The People’s Bank of China (PBOC) has reduced its intervention to prop up the yuan, reflected in softer daily midpoint fixings, a move that hints at its intention to moderate sharp declines against the US dollar.

This has been interpreted by market participants as a signal of decreased currency market intervention.

Meanwhile, the PBOC maintained key lending rates unchanged for the fifth straight month in March 2025, aligning with market expectations.

The one-year loan prime rate remains at 3.1%, while the five-year rate holds at 3.6%. These rates remain at historically low levels following reductions in October and July 2024.

The central bank has also left the door open for potential future changes in lending rates or the reserve requirement ratio, depending on economic conditions.

Technical analysis overview

The offshore yuan (USD/CNH) advanced by 0.03% during the latest session, closing at 7.25255 after opening at 7.25068.

USDCNH tests resistance at 7.25357 after a steady rise from 7.22547, as seen on the VT Markets app.

The pair followed a gradual upward trend, hitting an intraday high of 7.25963 before slightly retracing and closing near its peak.

Key technical indicators point to bullish momentum. The moving averages (MA 5,10,30) show consistent upward movement, with shorter-term MAs staying above longer-term ones, reinforcing the positive trend.

The MACD (12,26,9) also indicates bullish sentiment, with the MACD line (blue) positioned above the signal line (yellow) and an expanding histogram supporting upward momentum.

Important levels to watch include immediate resistance at 7.25357 and key support at 7.24597.

A decisive move above resistance could open the door for further gains, while a drop below support might weaken the bullish outlook.

Market outlook and key drivers

Despite the US dollar’s continued strength—bolstered by robust economic data and tightening monetary policy expectations—the offshore yuan faces downward pressure.

However, efforts by Chinese policymakers to boost the domestic economy and stabilise the currency may provide a counterbalance.

Traders should closely monitor updates from the People’s Bank of China and any shifts in US-China relations that could influence currency movements.

Click here to open account and start trading.

What is the Relative Strength Index (RSI) and How to Use It?

Understand What is Relative Strength Index 

In this article, we’ll explore what the Relative Strength Index (RSI) is and how to use this powerful momentum oscillator to identify key market conditions like overbought and oversold levels. Whether you’re a seasoned trader or just starting out, understanding how to interpret RSI signals can help you refine your trading strategy and make more informed decisions.

What is the Relative Strength Index (RSI)?

The Relative Strength Index (RSI) is a widely used momentum oscillator in technical analysis that helps traders identify overbought or oversold conditions in a market. It measures the speed and change of price movements, helping traders determine whether a particular asset is potentially due for a reversal. Developed by J. Welles Wilder in 1978, the RSI indicator has become an essential tool for market participants looking to spot potential trend reversals or confirm the strength of existing trends.

Typically, RSI is displayed on a scale of 0 to 100, with values above 70 indicating overbought conditions and values below 30 signaling oversold conditions. Traders use this information to assess entry and exit points for trades, making the Relative Strength Index an invaluable asset in a trader’s toolkit.

The Formula and Calculation for RSI

The RSI indicator is calculated by comparing the average gains and average losses over a specified period, typically 14 periods (which could be 14 days, 14 hours, etc., depending on the chart’s time frame). The process involves the following steps:

  1. Calculate the average gain: This is done by adding up all the price increases over the 14 periods and dividing it by 14. If a period shows no gain, it is counted as zero.
  2. Calculate the average loss: This is done similarly by summing all the price losses over the 14 periods and dividing it by 14. If there’s no loss, that period is counted as zero.
  3. Calculate Relative Strength (RS): RS is simply the ratio of average gain to average loss (RS = Average Gain / Average Loss). This gives you a measure of whether the asset is gaining more than it is losing.
  4. Apply the formula: The RSI is then calculated with the formula:
    RSI = 100 – (100 / (1 + RS))

The resulting number is a value between 0 and 100, where:

  • An RSI above 70 typically indicates the asset is overbought.
  • An RSI below 30 indicates the asset is oversold.

This formula helps traders assess whether an asset is potentially overextended, either due to being overbought or oversold, and might signal a potential reversal in price direction.

How to Use the RSI?

The Relative Strength Index (RSI) is a versatile tool for traders. When used effectively, it can help identify potential market reversals, trend strength, and even divergences. Let’s break down how to use the RSI in different scenarios:

1. Overbought and Oversold Conditions

The RSI is widely known for its ability to signal overbought and oversold conditions, which are crucial for identifying potential market reversals.

  • Overbought: RSI above 70 indicates an overbought market, suggesting a potential pullback or price reversal.
  • Oversold: RSI below 30 signals an oversold market, indicating a potential upward rally.

Example: If a stock’s RSI is below 30 and begins to rise, it may signal a buying opportunity.

2. Divergence

Divergence occurs when the RSI is moving in the opposite direction of the asset’s price, often signaling that the current price trend may be losing momentum and a reversal could be imminent.

  • Bullish Divergence: When the price makes lower lows but RSI forms higher lows, it suggests weakening selling pressure, signaling a possible reversal upward.
  • Bearish Divergence: When the price makes higher highs but the RSI forms lower highs, it suggests weakening buying pressure, indicating a potential downward reversal.

Example: If the price continues rising but the RSI starts falling, it could be a signal to sell.

3. Trend Confirmation

The RSI indicator is also useful for confirming the strength of a prevailing trend. Traders often use RSI readings to assess whether a trend is likely to continue or if it’s running out of steam.

  • Neutral Range (40-60): RSI between 40 and 60 suggests a neutral trend, with no clear direction.
  • Uptrend: RSI above 50 indicates an uptrend.
  • Downtrend: RSI below 50 suggests a downtrend.

Example: If a stock is consistently staying above an RSI of 50 and regularly crosses into the 60+ range, it suggests that the trend is likely to continue upward. Conversely, an RSI reading consistently below 50 indicates a bearish trend, and traders may look for shorting opportunities.

New to trading? Learn how to start trading for beginners

How to Set and Adjust the RSI?

The default setting for the RSI indicator is 14 periods, but this can be adjusted depending on the trader’s trading strategy and the market conditions.

Short-term traders: If you’re trading on shorter timeframes (like hourly or 15-minute charts), you might want to use a shorter period, such as 7 or 9. This makes the RSI indicator more sensitive to recent price movements, helping you make quicker decisions based on fast changes in the market.

Discover what are short-term trading strategies.

Long-term traders: For longer timeframes (like daily or weekly charts), using a longer period (e.g., 21 or 30) can smooth out the RSI, making it less reactive to minor fluctuations. This helps you identify more significant trends and avoid being misled by short-term noise in the market.

Adjusting the RSI period changes its sensitivity. A shorter period makes the RSI more volatile and responsive to recent price changes, while a longer period smooths out the indicator, making it better suited for identifying broader trends and reducing false signals.

Advantages of RSI

The Relative Strength Index offers numerous advantages for traders:

Versatility: The RSI indicator is adaptable across various markets—whether stocks, forex, or commodities—allowing traders to use it consistently for evaluating whether an asset is overbought or oversold, regardless of the market type.

Easy to Interpret: The RSI is intuitive and simple, even for beginners. Its 0-100 scale makes it easy for traders to spot key levels (overbought at 70, oversold at 30) and adjust their strategies accordingly without the need for complex calculations.

Predictive Power: One of the RSI indicator’s strongest features is its ability to forecast potential market reversals. By identifying overbought or oversold conditions, traders can enter or exit trades at more optimal times, helping them take advantage of price swings before they happen.

Divergence and Confirmation: The RSI also provides insight into divergence—when price and RSI move in opposite directions—indicating that a trend might be losing momentum and a reversal could be imminent. This makes it a powerful tool for confirming entry or exit points when combined with other indicators.

Disadvantages of RSI

While the Relative Strength Index is a valuable tool, it does have some limitations:

False Signals: In trending markets, the RSI indicator can remain in overbought or oversold territory for extended periods without signaling a reversal. In such cases, traders might wrongly interpret the RSI as suggesting an imminent trend change, leading to false signals if used alone.

Lagging Indicator: Since RSI is based on historical price data, it is inherently a lagging indicator. This means it can be slow to react to real-time price movements, and there might be a delay before RSI shows an overbought or oversold condition. Traders should be cautious not to rely solely on RSI for predicting immediate price movements.

Overreliance: While useful, RSI shouldn’t be used in isolation. Relying only on RSI can lead to misinterpretations, as it doesn’t account for broader market conditions. Combining it with other indicators, like moving averages or price action analysis, can provide a more comprehensive trading strategy and reduce the risk of false signals.

Conclusion

The Relative Strength Index (RSI) is an essential tool in any trader’s toolbox. It provides valuable insight into market momentum and helps identify potential trend reversals or confirmations. Whether you’re new to trading or an experienced market participant, mastering the RSI indicator can improve your decision-making and overall trading strategy.

By understanding how to use RSI effectively, you can identify overbought and oversold conditions, spot divergences, and enhance your ability to navigate volatile markets.

Elevate Your Relative Strength Index Today with VT Markets

Ready to become an expert in the Relative Strength Index and apply your knowledge in real-time trading? At VT Markets, we offer a seamless platform with MetaTrader 4 and MetaTrader 5 that empowers traders of all levels to execute their strategies with ease. Leverage our advanced tools, including the RSI indicator, and practice with a demo account to enhance your trading experience. Expert in RSI today and take your trading skills to the next level with VT Markets.

Start trading today with VT Markets and unlock the full potential of your trading journey!

Frequently Asked Questions (FAQs)

1. What is the Relative Strength Index? 

The Relative Strength Index (RSI) is a momentum oscillator used in technical analysis to measure the speed and change of price movements, helping traders identify overbought and oversold conditions in the market.

2. How do I use the RSI indicator? 

Traders use the RSI to spot overbought or oversold conditions, identify divergences, and confirm trends. A reading above 70 signals overbought conditions, while below 30 signals oversold conditions.

3. Can I adjust the RSI settings? 

Yes, traders can adjust the RSI settings based on their strategy. The default period is 14, but you can modify it to suit shorter or longer time frames depending on the asset and trading style.

4. Is RSI useful in volatile markets? 

Yes, RSI can help identify potential reversals even in volatile markets. However, during strong trends, RSI might remain in overbought or oversold levels for longer periods, which could lead to false signals. It’s important to use it in combination with other indicators for confirmation.

5. What is the RSI divergence, and why is it important? 

RSI divergence occurs when the price of an asset and the RSI move in opposite directions. Bullish divergence (lower lows in price, higher lows in RSI) suggests a potential upward reversal, while bearish divergence (higher highs in price, lower highs in RSI) signals a possible downward trend.

6. How to Use the RSI for Trend Identification?

The RSI indicator can be used to confirm the strength of a trend. In an uptrend, an RSI reading above 50 suggests that buyers are in control, and the trend may continue. Conversely, in a downtrend, an RSI reading below 50 indicates that sellers dominate the market.

Disclaimer:

This article is for informational purposes only and should not be construed as financial or trading advice. Past performance is not indicative of future results. Trading involves significant risk, and you should carefully consider whether it is suitable for you based on your individual circumstances.

Forex market analysis: 20 March 2025

The US dollar is moving cautiously as traders react to the Federal Reserve’s latest signals on interest rates. While Powell’s comments reassured markets about future rate cuts, uncertainty around global trade and geopolitical tensions keeps investors on edge. With the dollar stuck in a tight range, analysts are watching key technical levels for clues on its next move.

US Dollar Index remains range-bound following Powell’s remarks

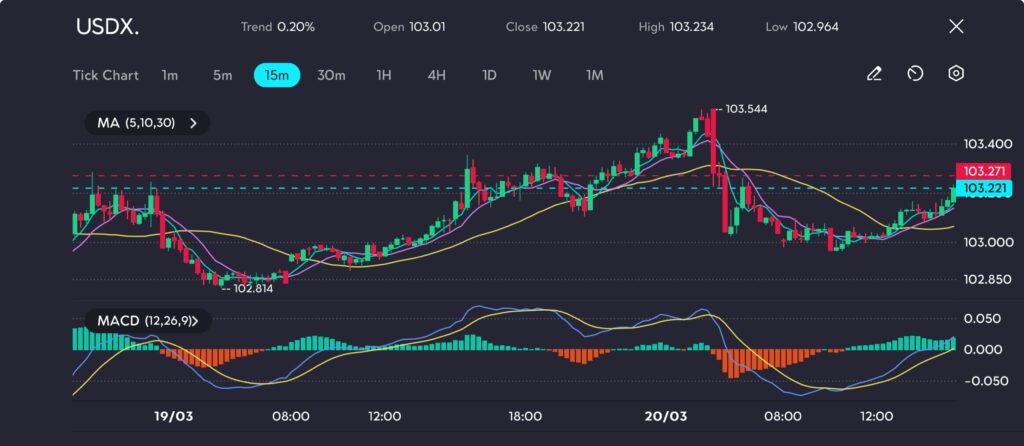
The US Dollar Index (USDX) traded sideways after Federal Reserve Chair Jerome Powell’s latest comments, showing limited reaction to the central bank’s decision to keep interest rates unchanged.

The index hovered around 103.22, reflecting the market’s cautious stance as investors awaited further economic signals.

Fed’s rate-cut outlook and market response

Powell reaffirmed the Federal Reserve’s plan for two rate cuts in 2025, helping to ease broader market concerns.

While this announcement fuelled a rally across the three major US stock indices, the dollar’s performance remained lacklustre.

Market sentiment appeared to favour the prospect of lower borrowing costs, but the USDX continued its consolidation, failing to break out of its tight trading range.

USDX technical analysis and key levels

The USDX recorded a 0.20% gain, closing at 103.221 after opening at 103.01. The session saw a notable uptick, reaching a high of 103.544 before retreating slightly.

SDX tests resistance at 103.271 after climbing from 102.814, as seen on the VT Markets app.

Technical indicators suggest a bullish bias, with short-term moving averages (MA 5,10,30) maintaining a position above longer-term averages, signalling sustained upward momentum.

The MACD (12,26,9) also indicates strong bullish pressure, with an expanding histogram and the MACD line trending above the signal line.

Key levels to monitor include 103.271 as immediate resistance and 102.814 as key support.

A breakout above resistance could drive further gains, while a decline below support might shift sentiment towards a more neutral or bearish outlook.

Market outlook: Uncertainty lingers

Despite Powell’s reaffirmation of future rate cuts, external factors such as global trade policies and geopolitical tensions continue to weigh on the greenback.

The USDX’s next significant move will likely depend on further clarity from the Federal Reserve and developments in global economic conditions, including ongoing geopolitical risks in the Middle East.

Traders should stay alert to upcoming economic data releases and Fed communications, which could provide fresh direction for the US dollar in the coming weeks.

Click here to open account and start trading.

Back To Top
server

Hello there 👋

How can I help you?

Chat with our team instantly

Live Chat

Start a live conversation through...

  • Telegram
    hold On hold
  • Coming Soon...

Hello there 👋

How can I help you?

telegram

Scan the QR code with your smartphone to start a chat with us, or click here.

Don’t have the Telegram App or Desktop installed? Use Web Telegram instead.

QR code