Dividend Adjustment Notice – Jul 22 ,2025

Dear Client,

Please note that the dividends of the following products will be adjusted accordingly. Index dividends will be executed separately through a balance statement directly to your trading account, and the comment will be in the following format “Div & Product Name & Net Volume”.

Please refer to the table below for more details:

Dividend Adjustment Notice

The above data is for reference only, please refer to the MT4/MT5 software for specific data.

If you’d like more information, please don’t hesitate to contact info@vtmarkets.com.

Yen rebound fades amid rising political risk

The Japanese yen saw a modest surge following the Upper House election on Sunday, but analysts remain skeptical of its staying power.

Bounce of the Japanese Yen Short-Lived as Political Risk Looms

On paper, the market welcomed the fact that Prime Minister Shigeru Ishiba will remain in power despite the ruling coalition losing its majority.

But the tone is far from celebratory.

BoJ Stays Dovish in the Face of Uncertainty

The Bank of Japan, already cautious about raising rates, now has even more reason to remain dovish. Heightened political risk tends to favour policy stability over experimentation, and with the spectre of trade tension looming, the BoJ may lean on continuity rather than tightening. This adds an undercurrent of softness to the outlook of the Japanese yen.

USD/JPY Technical Analysis

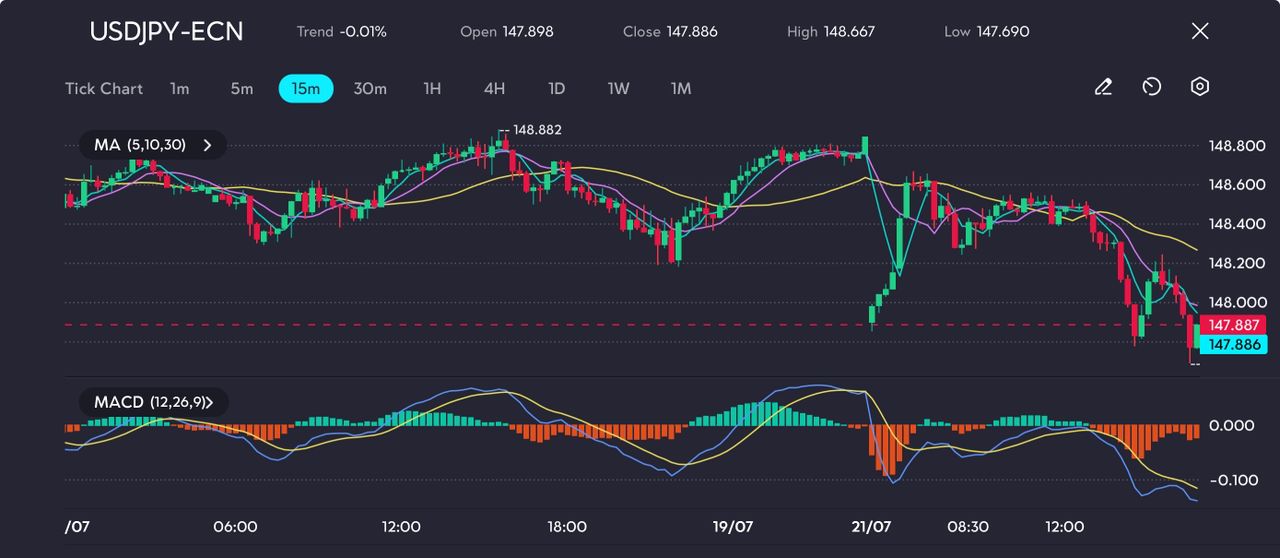
USD/JPY slipped to 147.88 by the Monday close, briefly testing intraday lows near 147.69 on the back of political headlines.

Remaining under heavy selling pressure with a sequence of lower highs and lower lows, the MACD histogram is firmly negative and expanding. Price also remains decisively below the 30-MA, reinforcing the intraday bearish structure.

usdjpy-usd-jpy-japanese-yen

Picture: USDJPY struggles beneath 148.00 as momentum fades. A break below 147.69 opens the door to deeper decline, as seen on the VT Markets app

The recent move comes amid growing caution from traders following mixed comments from BoJ policymakers last week, where Governor Ueda hinted that “exit from ultra-loose policy will remain gradual.”

Meanwhile, a firmer US dollar has failed to keep USD/JPY afloat, suggesting potential haven demand for the yen is resurfacing. If 147.69 breaks, eyes shift to the next psychological level at 147.50.

Click here to open account and start trading.

Dividend Adjustment Notice – Jul 21 ,2025

Dear Client,

Please note that the dividends of the following products will be adjusted accordingly. Index dividends will be executed separately through a balance statement directly to your trading account, and the comment will be in the following format “Div & Product Name & Net Volume”.

Please refer to the table below for more details:

Dividend Adjustment Notice

The above data is for reference only, please refer to the MT4/MT5 software for specific data.

If you’d like more information, please don’t hesitate to contact info@vtmarkets.com.

EMA vs SMA: What Are the Key Differences?

Moving averages are essential tools in technical analysis, helping traders identify trend direction and key price levels. The two most common types—Simple Moving Average (SMA) and Exponential Moving Average (EMA)—use similar principles but respond differently to price changes. In this article, we explain the difference between simple moving average and exponential moving average and guide you on when to use each.

What Is a Simple Moving Average (SMA)?

A Simple Moving Average (SMA) is one of the most fundamental tools in technical analysis. It calculates the average price of an asset over a specific number of periods, giving equal weight to each price point. For example, a 10-day SMA adds the closing prices of the past 10 days and divides the total by 10. This line helps traders smooth out market noise and identify long-term trends.

Example: Imagine you’re tracking Apple stock (AAPL). If the 50-day SMA is steadily rising and price remains above it, this indicates a sustained uptrend. Many long-term investors rely on the 200-day SMA to spot major market shifts or reversals.

What Is an Exponential Moving Average (EMA)?

An Exponential Moving Average (EMA) also measures the average price over a selected period, but it gives more importance to recent prices. This weighting makes the EMA more responsive to current price movements. The formula includes a smoothing factor, which adjusts the sensitivity of the average. The shorter the period, the more reactive the EMA becomes.

Example: A swing trader monitoring the major currency pair EUR/USD may use a 20-day EMA to capture short-term momentum. When price pulls back to the EMA and rebounds, it can signal a buying opportunity in an ongoing trend.

EMA vs SMA: Key Differences

Understanding the difference between a simple moving average and an exponential moving average is essential for selecting the right tool for your trading strategy.

FeatureSimple Moving Average (SMA)Exponential Moving Average (EMA)
Calculation MethodEqual weight for all periodsMore weight to recent prices
ResponsivenessSlower, less sensitiveFaster, more responsive
Lag TimeHigher lag due to equal weighting across all periodsLower lag due to more emphasis on recent prices
Best forLong-term trend analysisShort-term trading signals
Reaction to VolatilitySmooths out price actionReacts quickly to new price data
Noise FilteringBetter at filtering out short-term fluctuationsMay respond to minor, insignificant price changes
Suitability for BeginnersEasier to understand and applyRequires a better understanding of price weighting
Use in Popular IndicatorsCommonly used in Bollinger Bands and MA crossoversCore component of MACD and other momentum indicators

1. Calculation Method

SMA: The Simple Moving Average assigns equal weight to all data points within the selected period. This method is simple and easy to apply, but slower to react to recent price shifts.

EMA: The Exponential Moving Average applies greater weight to more recent data points, making it more responsive to current market conditions and price changes.

2. Responsiveness

SMA: SMA reacts more slowly to price movements, making it better for identifying stable, longer-term trends without being influenced by short-term fluctuations.

EMA: EMA adjusts quickly to price movements, allowing traders to catch momentum shifts or reversals earlier, especially in active or volatile markets.

3. Best for

SMA: Best used for long-term trend analysis and spotting major levels of support or resistance in relatively stable market conditions.

EMA: Favoured by short-term or swing traders who require faster trading signals for timely entries and exits.

4. Reaction to Volatility

SMA: Provides a smoother line that filters out erratic price spikes, helping traders maintain focus on the underlying trend during periods of high volatility.

EMA: Due to its sensitivity, EMA may react more dramatically to sudden price changes, which can lead to faster—but sometimes less reliable—signals.

5. Lag Time

SMA: Has a higher lag because it treats all price data equally, which can delay recognition of market turning points.

EMA: Shows less lag by prioritizing recent price action, helping traders respond to changes more quickly.

6. Noise Filtering

SMA: More effective at filtering out short-term price noise, making it easier to identify the broader market direction.

EMA: While quick to react, EMA may also reflect minor fluctuations that are not significant to the larger trend.

7. Suitability for Beginners

SMA: Straightforward to calculate and interpret, making it ideal for beginner traders who are just learning technical analysis.

EMA: Slightly more complex due to its weighting mechanism, but provides more advanced insight for traders with some experience.

8. Use in Popular Indicators

SMA: Commonly used in tools like Bollinger Bands or moving average crossovers for trend confirmation.

EMA: Serves as the foundation of momentum-based indicators such as the Moving Average Convergence Divergence (MACD), which relies on quick reaction to price shifts.

Advantages and Disadvantages of EMA and SMA

Both the simple moving average and the exponential moving average offer unique benefits and drawbacks:

Simple Moving Average (SMA) Advantages:

  • Simple and easy to use: A straightforward formula makes it beginner-friendly.
  • Good at filtering market noise: Smooths out erratic price movements in trending markets.
  • Reliable for long-term trends: Commonly used for support/resistance on higher timeframes (e.g., 200-day SMA).

Simple Moving Average (SMA) Disadvantages:

  • Slow to react: Equal weighting causes a delayed response to price shifts.
  • Can miss quick reversals: May still reflect old trends after the market has changed direction.

Exponential Moving Average (EMA) Advantages:

  • More responsive: Reacts quickly to recent price movements due to the weighted formula.
  • Better for short-term trading: Favoured by scalpers and day traders needing faster signals.
  • Effective in volatile markets: Captures momentum in fast-moving assets like forex or crypto.

Discover the 10 most volatile forex pairs to watch and trade.

Exponential Moving Average (EMA) Disadvantages:

  • Prone to false signals: Sensitive to price spikes in sideways or choppy conditions.
  • Requires tuning: Needs careful adjustment of settings to suit your strategy and asset class.

When Should You Use SMA or EMA?

Your choice depends on your trading style, asset class, and timeframe.

Use Simple Moving Average (SMA) when:

  • You’re a long-term trader or investor: SMA provides stable signals that help identify major market trends.
  • You prefer smoother signals: It’s slower reaction filters out short-term noise, making it ideal for steady trend confirmation.
  • You’re focusing on key levels: Commonly used for identifying long-term support or resistance, especially the 100-day or 200-day SMA.

Example: A stock investor might use the 200-day SMA on Microsoft (MSFT) to determine whether the stock remains in a long-term uptrend before entering a position.

Use Exponential Moving Average (EMA) when:

  • You’re a short-term or swing trader: EMA reacts quickly to price action, making it useful for faster trade decisions.
  • You need early entry and exit signals: Their responsiveness helps capture momentum shifts as they develop.
  • You’re trading volatile instruments: Ideal for forex, precious metals, or indices where speed matters in capturing breakouts or reversals.

Example: A trader using the 20 EMA on the 15-minute chart of XAUUSD (gold) may identify intraday reversals earlier than one using a 1-hour SMA, gaining a timing edge in volatile conditions.

In Summary

The key difference between simple moving average and exponential moving average is how they respond to price changes, while SMA offers smoother, slower signals suited for long-term trends, while EMA reacts faster and is ideal for short-term trading. Your choice depends on your strategy and market conditions, and many traders combine both to balance stability with responsiveness.

Start Trading with Moving Averages on VT Markets

At VT Markets, we provide the tools you need to apply SMA and EMA strategies across forex, indices, commodities, and crypto. Whether you prefer MetaTrader 4 (MT4), MetaTrader 5 (MT5), or our own proprietary platform, you’ll get:

  • Real-time charting tools to plot moving averages
  • Flexible timeframes from 1-minute to monthly views
  • Access to the VT Markets demo account to test your strategies risk-free
  • Transparent, competitive spreads across major instruments
  • 24/5 support through our Help Centre for platform and trading guidance

Create an account and join VT Markets today, and refine your trading using powerful tools like the EMA and SMA.

Frequently Asked Questions (FAQs)

1. What is the difference between simple moving average and exponential moving average?

The main difference is that SMA gives equal weight to all prices in a period, while EMA gives more weight to recent prices, making it more responsive to current market movements.

2. Can I use both EMA and SMA at the same time?

Yes, many traders use both for confirmation. For example, a crossover of a short-term EMA above a long-term SMA can signal a trend change.

3. Which moving average is better for day trading?

The EMA is generally preferred for day trading due to its responsiveness to recent price movements.

4. Are moving averages accurate in volatile markets?

EMAs are more suitable in volatile conditions. Combining them with indicators like RSI or MACD can improve accuracy, but no indicator guarantees results.

5. Can moving averages be used for all asset classes?

Yes, moving averages are widely used across various markets, including forex, stocks, indices, commodities, and cryptocurrencies. The logic behind them remains the same, though ideal settings may vary by asset type and volatility.

6. How do I choose the right period for a moving average?

It depends on your trading style and timeframe. Short-term traders may use 9, 12, or 20-period MAs, while long-term traders often prefer 50, 100, or 200-period MAs. Backtesting different settings on your target asset can help you fine-tune your approach.

7. What is a moving average crossover strategy?

This involves using two moving averages—one short-term and one long-term. A bullish crossover occurs when the short-term MA crosses above the long-term MA, suggesting upward momentum. A bearish crossover signals the opposite.

8. When should I use SMA vs EMA?

Use SMA for long-term trend analysis and smoother signals in stable markets. Use EMA when you need faster responses in short-term or volatile trading environments. Choosing the right one depends on your strategy and timeframe.

Week ahead: Japanese elections add global uncertainty

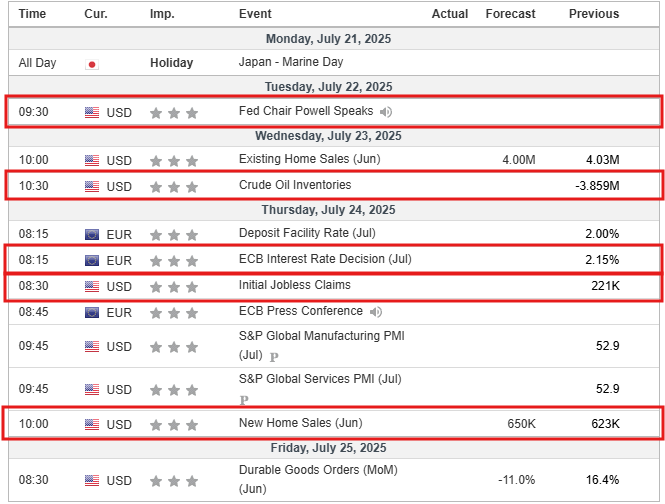
With a potential Fed rate cut in focus, markets remain perched between bullish momentum as well as political and central banks uncertainty. Key inflation figures, central bank decisions, and global political shifts could be the major volatility triggers, defining the overall risk landscape. As liquidity is low in summer, careful risk positioning and awareness of geopolitical events such as the Middle East tensions are essential.

Key Catalysts:

  • U.S. CPI/PPI data & Fed commentary: Crucial for Fed rate-cut outlook.
  • Trade headlines related to Trump’s tariff decisions impacting safe-haven flows.
  • Geopolitical updates including Middle Eastern tensions that can sway gold demand

KEY ECONOMC INDICATORS & NEWS HEADLINES

Currencies

  • The U.S. dollar weakens as Fed rate cut seems imminent
  • With the Japanese upper-house election looming, the Japanese Yen will depend on the political outcomes and the monetary policy trajectory of the U.S. for more clarity
  • Global dialogue continues in the G20 finance meeting on U.S. tariffs concerns
  • ECB likely holds rates steady on July 23–24
  • Turkish Lira reacts as the TCMB is expected to slash rates by 250 bps on July 24

Commodities

  • Crude oil prices rallied after drone strikes in the Iraqi Kurdistan, as concerns about Middle East supply routes revived
  • Gold eases after some strength in the U.S. dollar and bond yields trimmed safe-haven demand, though its trajectory remains linked to Fed and tariff headlines

Equities

  • S&P 500 and Nasdaq near record highs, led by strong earnings and corporate buybacks. Notably, Citadel says U.S. firms will repurchase $1T in stock this year
  • Global stock markets showing stronger risk appetite while supported by robust U.S. market data
  • Asian equities stabilise alongside the strength in Wall Street, with markets in Tokyo, Hong Kong and Shanghai all rose on Friday
key-economic-event

MARKET MOVERS

USD/JPY

usd-jpy-usdjpy

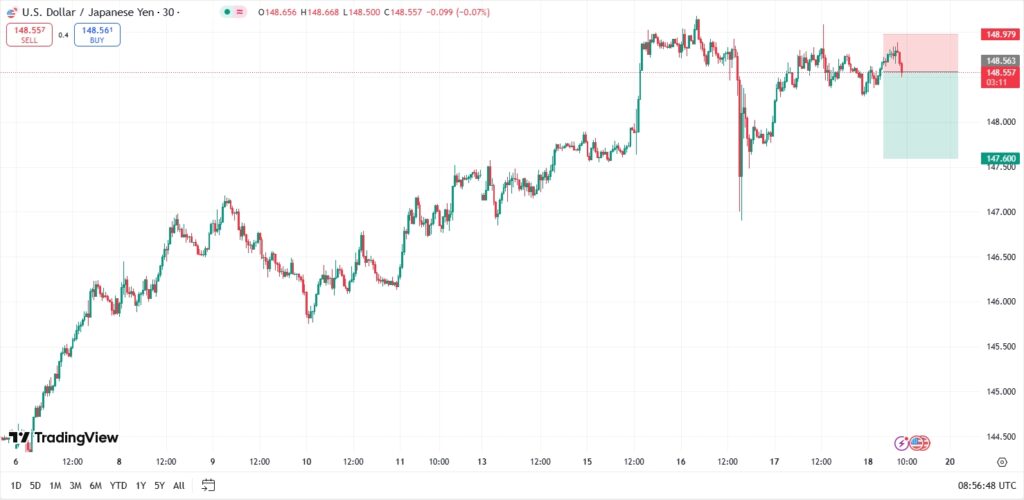
USD/JPY remains bullish but faces a critical test at the 150.00 level. Election-induced yen volatility and developments from the Fed and tariff concerns may heighten intraday swings. With the USD/JPY being expected to start the week in the 148.40 to148.60 range, a few scenarios may play out for traders.

  • Buy position: Target 1 150.00 to 150.50 / Target 2 152.00 to153.00 with stop loss placed below 147.80
  • Sell position: Target 1 145.85 / Target 2 143.75 with stop loss placed above 150.20
  • Range scalping: Buy and sell between 148.00 and 150.00 until breakout clarity emerges

Key price levels to observe include:

  • Primary: 148.00, the rising trendline and short-term support
  • Secondary: 147.15 to 147.30, lower support zone that would invalidate bullish momentum
  • Tertiary: 145.85 to 145.00, deeper slack if technical structure weakens

EUR/USD

eur-usd-eurusd

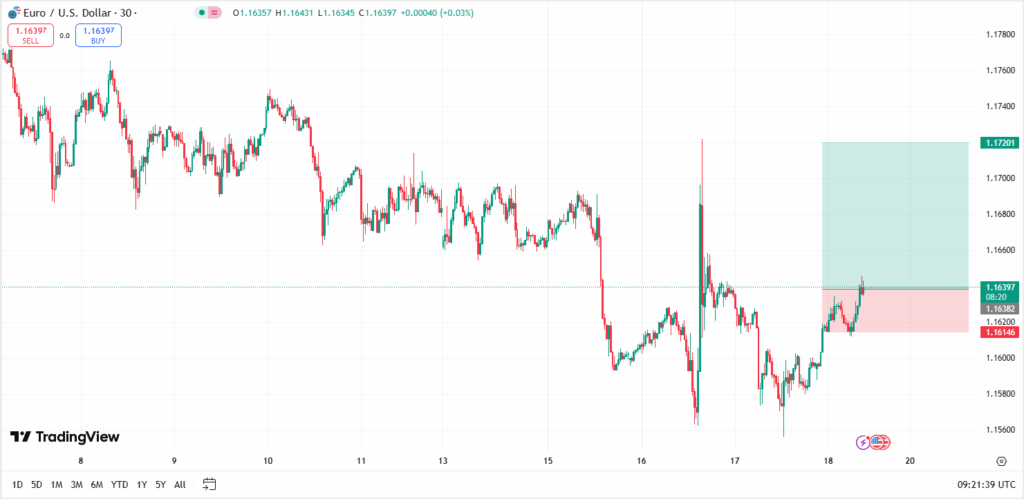
The EUR/USD is projected to open between 1.1740 to 1.1760, supported by the U.S. dollar softness ahead of the Fed decision coming Wednesday, as well as a dovish ECB sentiment.

  • Buy position: Subject to a daily close above 1.1820 confirming the continuation of a bullish breakout, look out for Target 1 1.1850 / Target 2 1.1900 to 1.2000 with stop loss placed below 1.1720
  • Sell position: With a failure at resistance or a drop below 1.1700, look out for Target 1 1.1650 / Target 2 1.1600 with stop loss placed above 1.1830
  • Range scalping: Buy and sell between 1.1700 and 1.1800 until breakout clarity emerges

Key price levels to observe include:

  • Primary: 1.1700 to 1.1720, minor support from congestion and recent swing lows
  • Secondary: 1.1650 to 1.1670, broader consolidation region
  • Tertiary: 1.1600 to 1.1620, deeper mean-reversion zone if weakness intensifies

XAU/USD

gold-usd-xauusd

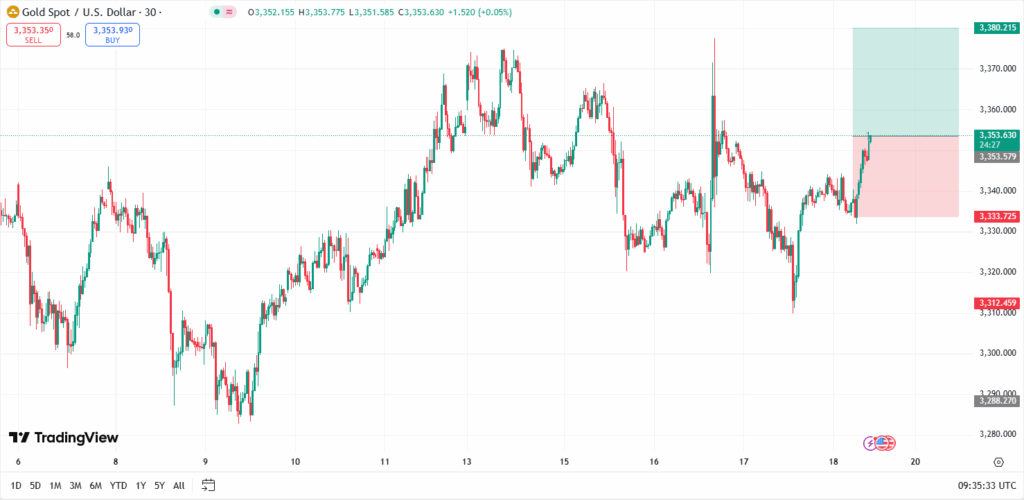
Gold is consolidating inside an ascending triangle pattern, bounded by support around $3,320 to $3,330 and resistance near $3,375. A breakout above would signal renewed bullish momentum, while a drop below $3,320 may trigger a deeper correction. Expect a range-bound open between $3,330 and $3,340, with markets reacting to U.S. inflation data and trade headlines.

  • Buy position: Target 1 $3,450 / Target 2 $3,500 with stop loss placed below $3,320
  • Sell position: Target 1 3,260 / Target 2 $3,200 with stop loss placed above $3,375
  • Range scalping: Buy and sell between $3,330 and $3,375 until breakout clarity emerges

Key price levels to observe include:

  • Primary: $3,320 to $3,330, the level forming triangle base as well as the 50-day SMA support
  • Secondary: $3,300 to $3,310, the lower channel zone whereby a breach suggests bearish follow-through
  • Tertiary: $3,245 to $3,260 is a deeper support if both above levels fail

Click here to open account and start trading.

What is Simple Moving Average (SMA) & How to Use It?

The Simple Moving Average (SMA) is a popular tool in trading, helping traders filter out market noise and identify underlying trends by averaging prices over a specific period. In this article, we’ll explain what the SMA is, how to calculate it, and how it can be applied in various trading strategies to improve your decision-making.

What is the Simple Moving Average?

A Simple Moving Average (SMA) is one of the most commonly used tools in technical analysis, helping traders identify trends by smoothing out price fluctuations. It is a type of moving average that calculates the average price of an asset over a specified number of periods, making it a straightforward yet effective method for tracking market movements.

The Simple Moving Average is called ‘simple’ because it takes an unweighted average of prices over the selected period. This easy-to-understand indicator highlights trends in price data, helping traders make informed decisions.

Formula for Simple Moving Average (SMA)

The formula for calculating the Simple Moving Average is:

Simple Moving Average = (Sum of Prices) / (Number of Periods)

Where:

  • Sum of Prices refers to the total of the closing prices for each period you’re analyzing (e.g., the sum of the closing prices for the last 10 days),
  • Number of Periods is the number of data points you are averaging (e.g., 10 days for a 10-day SMA).

This formula simply averages the closing prices over a specific time frame, providing a smoothed line that represents the asset’s price over the chosen period.

How to Calculate Simple Moving Average

To calculate the Simple Moving Average, follow these steps:

  • Choose a time: Decide on the number of periods for which you want to calculate the average (e.g., 5, 10, 50, or 200 days).
  • Collect the data: Gather the closing prices for each period. For example, if you’re calculating a 10-day SMA, collect the last 10 closing prices.
  • Add up the closing prices: Add the closing prices of all the periods you’re analyzing.
  • Divide by the number of periods: Divide the sum of the prices by the number of periods (e.g., 10 for a 10-day SMA).

Example: 

Let’s calculate a 10-day SMA with the following data:

  • Day 1: Price = $20
  • Day 2: Price = $22
  • Day 3: Price = $24
  • Day 4: Price = $26
  • Day 5: Price = $28
  • Day 6: Price = $30
  • Day 7: Price = $32
  • Day 8: Price = $34
  • Day 9: Price = $36
  • Day 10: Price = $38

Calculate the 10-day SMA (the average of the last 10 closing prices):

SMA = (20 + 22 + 24 + 26 + 28 + 30 + 32 + 34 + 36 + 38) / 10

SMA = 290 / 10 = 29

So, the 10-day Simple Moving Average (SMA) is $29.

How to Use Simple Moving Average in Trading

The Simple Moving Average (SMA) is an essential tool for traders, helping to identify trends, determine support and resistance levels, and guide trading decisions. Here’s how to use the SMA in different market scenarios:

1. Trend Identification

The Simple Moving Average is an effective tool for identifying market trends by averaging price data over a specified period. A rising SMA indicates an upward trend, while a declining SMA points to a downward trend. Traders use the SMA to validate trends and avoid false signals.

Example: In the stock market, when Microsoft (MSFT) is trading above its 50-day SMA, it suggests that the stock is in an uptrend. If the 50-day SMA crosses above the 200-day SMA, it can signal the beginning of a strong bullish move. Conversely, if the stock price drops below its SMA, it could indicate the reversal of the trend and potential bearish conditions, giving traders a chance to act before the trend fully shifts.

2. Support and Resistance

The Simple Moving Average (SMA) acts as dynamic support and resistance. When prices are above the moving average, the SMA can act as support, with the price bouncing upwards when it approaches the SMA. On the other hand, when the price is below the SMA, it may act as resistance, preventing upward movement.

Example: In forex trading, the major currency pair, EUR/USD, frequently uses the 100-day SMA as a dynamic support level. When the price retraces towards the 100-day SMA and finds support there, traders may see this as a signal to buy. If the price drops below this level, the SMA could turn into resistance, signaling a possible downward trend, and traders may decide to exit or short the pair.

3. Crossovers

The SMA crossover strategy is a popular approach for identifying potential entry and exit points. A bullish crossover (Golden Cross) occurs when a shorter-term SMA crosses above a longer-term SMA, suggesting an upward momentum. The opposite, a bearish crossover (Death Cross), occurs when the short-term SMA crosses below the long-term SMA, signaling a potential downtrend.

Example: For precious metals, like gold (XAUUSD), traders often watch the 50-day SMA and the 200-day SMA. In 2024, when the 50-day SMA crossed above the 200-day SMA for gold, it signaled the beginning of a bullish trend, encouraging traders to take long positions. A crossover like this is considered a strong buy signal in commodities, as it suggests that the price may continue to rise.

Learn the key differences between long and short positions.

What Are the Differences Between SMA and EMA?

The key difference between the Simple Moving Average (SMA) and the Exponential Moving Average (EMA) lies in how they handle price data:

  • Weighting: The SMA treats all prices equally, while the EMA gives more weight to recent prices.
  • Responsiveness: The SMA reacts more slowly to recent price changes, making it a smoother, more stable indicator. In contrast, the EMA is more responsive and quicker to react to price changes.
  • Lagging vs. Leading Indicator: The SMA is a lagging indicator, meaning it takes longer to react to price changes. The EMA, being more sensitive to recent prices, acts as a leading indicator and can provide earlier signals.
  • Smoothing Effect: The SMA offers a smoother and more stable line by averaging all prices evenly. The EMA is less smooth and reacts more sharply to price movements, making it ideal for capturing rapid market changes.

The SMA is more suitable for identifying long-term trends and providing a stable, averaged perspective on price movement. The EMA, on the other hand, is better for short-term trading strategies that require quick reactions to price changes and market shifts.

Common Mistakes to Avoid When Using SMA

While the Simple Moving Average is a powerful tool, there are several common mistakes traders should avoid:

  • Over-reliance on SMA: Many traders make the mistake of relying solely on the SMA for decision-making. It’s important to use it in conjunction with other technical indicators like RSI, MACD, or Bollinger Bands for more reliable signals.
  • Ignoring Market Volatility: SMA can lag during periods of high volatility. Traders who ignore market conditions may misinterpret signals. For instance, during volatile market events, the SMA might not react quickly enough to changes in direction.
  • Choosing the Wrong Timeframe: Using an SMA that is too short (e.g., a 5-day SMA) can lead to false signals during choppy markets. It’s important to choose an SMA time that aligns with your trading strategy.
  • Not Accounting for Market News: While SMA is a valuable tool, it doesn’t account for fundamental factors like earnings reports, news events, or economic data. These can influence the price and may cause the SMA to lag behind the market.
  • Ignoring Price Action: Traders sometimes focus too much on the SMA and overlook the price action itself. Price patterns, candlestick formations, and trendlines are just as crucial in confirming signals from the SMA. Relying solely on the SMA without considering price action can lead to missed opportunities or false entries.

In Summary

The Simple Moving Average (SMA) is an effective tool for identifying trends and acting as dynamic support or resistance. However, while useful, the SMA should be combined with other indicators, such as RSI or MACD, to provide more reliable trading signals. Avoiding common mistakes like over-reliance on the SMA and ignoring market conditions will help traders use it more effectively in their strategies.

Start Trading Today with VT Markets

Ready to put your knowledge of the Simple Moving Average to the test? VT Markets provides access to MetaTrader 4 (MT4) and MetaTrader 5 (MT5), offering advanced trading tools for better decision-making. Explore our Help Centre for resources and support, and practice risk-free with a VT Markets demo account to sharpen your trading skills before going live.

Start trading today with VT Markets and take your trading skills to the next level.

Frequently Asked Questions (FAQs)

1. What is Simple Moving Average?

The Simple Moving Average (SMA) is a technical analysis tool that calculates the average price of an asset over a specific number of periods, providing a smoothed line to help identify trends.

2. How to calculate the Simple Moving Average?

To calculate SMA, sum the closing prices for the selected period and divide by the number of periods. For example, a 10-day SMA is the average of the last 10 closing prices.

3. How to use the Simple Moving Average in trading?

SMA is used for identifying trends, providing support and resistance, and generating trade signals through crossover strategies.

4. What is the difference between SMA and EMA?

The SMA gives equal weight to all prices, while the EMA places more weight on recent prices, making it more responsive to new price movements.

5. What are the advantages of using Simple Moving Average (SMA)?

The SMA is simple to calculate and helps smooth out price data, making it easier to identify trends. It is widely used by traders to reduce market noise and understand long-term price movement.

6. Can SMA be used for all asset classes?

Yes, the SMA is applicable across various financial markets, including stocks, forex, commodities, and cryptocurrencies. The same principles apply to all markets, regardless of the asset class.

7. Can I use SMA with other technical indicators?

Yes, the SMA is often combined with other indicators such as RSI, MACD, or Bollinger Bands to confirm signals and improve the accuracy of trading decisions.

8. Why does the SMA lag behind price movements?

The SMA lags because it is based on past data, giving equal weight to each price point. This means that the SMA reacts more slowly to rapid changes in price, making it less sensitive to short-term price fluctuations.

9. Which is better, EMA or SMA?

EMA is generally better for short-term traders who need quicker, more responsive signals, as it reacts faster to recent price changes. SMA, however, is better suited for identifying long-term trends and providing stability in analysis. The choice depends on the trader’s strategy—EMA for quicker reactions and SMA for smoother, long-term trend analysis.

Japanese election tensions push Nikkei lower

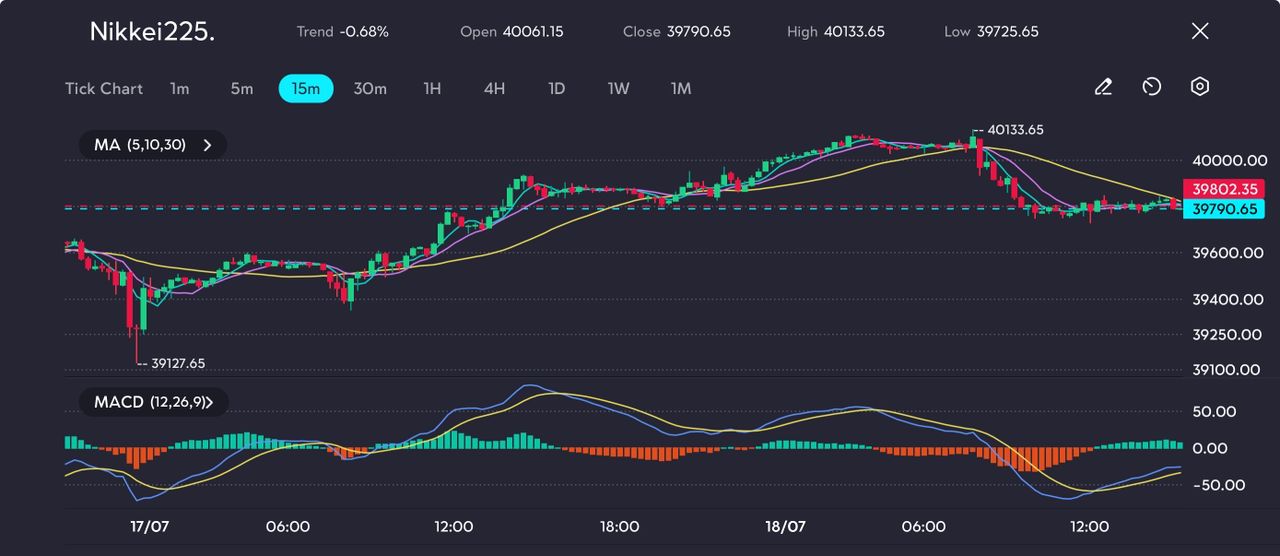
The Nikkei 225 came under pressure Friday, closing at 39,819 after briefly testing resistance near 40,133.65 earlier in the session. What began as a mild attempt to extend the gains from Thursday quickly unravelled into cautious selling, driven by a mix of macro uncertainty, election anxiety, and disappointing trade data.

Nikkei Slips as Elections Shake the Calm in Tokyo

The Japanese government bonds had the yields dropping across maturities, ahead of the closely-watched upper house election this coming Sunday. Concurrently, the Topix mirrored the move, dipping 0.2% to 2,834, as market participants chose to de-risk ahead.

Trade Tensions Weigh on Tech Stocks

One of the bigger drags came from Japan’s high-flying electronics and semiconductor names, which reversed sharply amid fears that strained trade ties with the US could begin to bite.

Disco Corp plunged 8.8%, Advantest fell 4.4%, and Sony Group slid 2.2%, with Keyence Corp dropping 0.6%. The June trade data didn’t help—shipments to the US dropped sharply, raising red flags just weeks before a key trade deadline in August.

Yet despite the drop, there is a degree of resilience underneath. For the week, the Nikkei still managed to gain 0.4%, bouncing back from last week’s losses. That modest lift has largely been credited to Japan’s latest inflation print, which came in lower than expected.

With inflationary pressure softening, the Bank of Japan is now seen more likely to hold rates steady, giving equities some breathing room, at least in the short term.

Technical Analysis: Nikkei 225

Nikkei 225 saw a sharp rejection from its peak of 40,133.65 earlier in the session, triggering a steep drop that found support around 39,725. The price has since stabilised, but it’s trading just under the 30-period moving average, suggesting the pullback is yet to be fully neutralised.

nikkei-225-technical-analysis

Picture: Nikkei trims gains after hitting 40,133. MACD hints at recovery, but bulls need to reclaim 39,800+, as seen on the VT Markets app

Short-term moving averages (5 and 10) remain compressed and below the 30-MA, signalling caution. However, MACD shows early signs of bullish crossover with bars flipping green and lines curling upward. These are hints of a recovery attempt. That said, a break above 39,800 is needed to regain upward momentum. Failing that, price may consolidate or retest the 39,700 area.

Traders may want to consider watching for a move above the 30-MA for confirmation of bullish continuation.

Outlook for the Japanese Stock Market

Looking ahead, the Nikkei faces a storm of potential catalysts. The outcome of the weekend election, clarity (or lack thereof) on the US-Japan trade track, and any signals from the BoJ’s next move could all shift the dial rapidly. Until then, traders may prefer to stay on the sidelines, hoping the market does not punish hesitation too harshly.

Click here to open account and start trading.

Dividend Adjustment Notice – Jul 18 ,2025

Dear Client,

Please note that the dividends of the following products will be adjusted accordingly. Index dividends will be executed separately through a balance statement directly to your trading account, and the comment will be in the following format “Div & Product Name & Net Volume”.

Please refer to the table below for more details:

Dividend Adjustment Notice

The above data is for reference only, please refer to the MT4/MT5 software for specific data.

If you’d like more information, please don’t hesitate to contact info@vtmarkets.com.

Bitcoin readies breakout on stablecoin surge

Bitcoin is currently stabilising as growing investor interest and increased trading activity signal cautious optimism. Although short-term indicators suggest some hesitation, the market seems to be building momentum quietly, preparing for a potential breakout in the near future.

Bitcoin stabilises, keeping traders alert

Bitcoin continues to hover steadily between $116,000 and $120,000, leaving traders cautiously optimistic as the cryptocurrency prepares to gather momentum for a potential breakout.

Overnight, BTC reached a peak of $120,062 before retreating to around $118,300, signalling that the market is digesting recent gains while anticipating the next directional move.

The positive sentiment isn’t driven by price alone. According to CryptoQuant analyst Amr Taha, a fresh influx of $2 billion in newly issued stablecoins entered derivatives platforms earlier today.

This surge in liquidity, mainly through Tether (USDT), is widely seen as a sign of institutional capital moving into the market, setting the stage for leveraged long positions across Bitcoin and major altcoins.

Liquidity and leverage dynamics

Large stablecoin deposits have historically served as a precursor to significant rallies.

When such inflows target derivatives exchanges, they often precede a rise in open interest  –  a pattern currently unfolding in the market.

Open interest is climbing in tandem with price action, reflecting bullish sentiment and heightened trader engagement.

However, this also increases risk. A rising open interest indicates growing leverage, which can amplify gains in the short term but also intensify losses if market sentiment reverses suddenly.

Technical analysis

Bitcoin has recently slipped into a short-term downtrend after failing to sustain the $120,000 threshold, with a local high of $120,062 followed by a pullback towards $118,000.

Picture: BTC rejected at 120K and losing steam fast, as seen on the VT Markets app.

The MACD indicator reveals weakening momentum through a pronounced bearish crossover and expanding histogram divergence, signalling continued selling pressure in the near term.

BTC’s price has now fallen below the key short-term moving averages (5, 10, and 30 periods), and the recent upward movement looks more like a corrective bounce than a trend reversal.

Broader macroeconomic factors have added to bearish pressures. Fed Chair Jerome Powell reaffirmed the Federal Reserve’s cautious approach to rate cuts this week, while on-chain data from CryptoQuant shows slowing inflows to derivatives exchanges, suggesting a reduced appetite for aggressive leveraged longs.

With a lower high established and $118,000 being retested, bulls must regain control above $119,000 swiftly, or risk BTC revisiting the $117,000–$116,500 liquidity zone.

A local top or just a pause?

Despite indications of short-term fatigue, Bitcoin has yet to experience a sharp pullback.

This resilience suggests solid underlying demand and a market more prone to consolidation than capitulation.

At the time of writing, BTC trades at $119,171, marking a 2.4% increase over the past 24 hours.

With fresh stablecoin liquidity poised for deployment and derivatives traders positioning for further gains, the key question remains whether Bitcoin can push decisively beyond $120,000 or if it needs to shake out weaker hands first.

Click here to open account and start trading.

How to make earnings season work for you

Want to know why stock prices sometimes surge or crash overnight – seemingly without warning? It often comes down to one thing: earnings season.

Whether you’re watching Apple, Netflix, or a major index like the S&P 500, the quarterly results that companies release can shake your trading strategy – or supercharge it.

For traders, earnings season might seem noisy or unpredictable. But with the right preparation, it can become a valuable period of opportunity.

What is earnings season?

Earnings season refers to the period when publicly listed companies report their financial results for the previous quarter. This happens four times a year, usually in January, April, July, and October.

Most companies publish their results within a few weeks of each other, making these periods particularly busy for traders.

The reports typically include key figures such as revenue, net profit, earnings per share (EPS), and forward guidance. They offer insight into how a company is performing and what it expects in the months ahead.

Market participants closely follow these releases because they influence sentiment, expectations, and – often – share prices.

For instance, when Tesla reported better-than-expected earnings in July 2024, its share price jumped more than 10% in after-hours trading. In contrast, a company might beat profit forecasts but still drop in value if its future guidance is weak.

Why earnings season matters to traders

Earnings reports can lead to sharp price movements, especially when results differ from what analysts or the market expected.

That’s why these releases are often seen as catalysts – not only for the individual stock, but sometimes for an entire sector or even the broader index.

Consider the impact when large US banks like JPMorgan or Citigroup report strong numbers. Their results can influence the performance of financial stocks across the board and even drive momentum in the Dow Jones Industrial Average or S&P 500.

This makes earnings season a critical time to monitor key players, not just for stock-specific moves but for potential sector-wide trends.

Traders who are well prepared can use this volatility to their advantage. It creates opportunities for short-term trades, breakout setups, or momentum plays – but only if approached with discipline and planning.

How to prepare for earnings season

To make the most of earnings season, preparation is key. By planning ahead, you can avoid surprises, spot better opportunities, and trade with more confidence. Here’s how to get started.

Build a focused watchlist

Start by selecting a handful of high-impact companies that tend to move markets. You don’t need to follow every stock – focusing on names like Apple, Microsoft, Amazon, or Tesla can be more effective, especially if you’re familiar with their sectors or past performance.

Track earnings dates

Use an earnings calendar to stay on top of when these companies are set to report. Knowing whether results will be released before the market opens or after it closes is key to planning your entries and exits.

Understand market expectations

Price movements are usually driven by how actual results compare to expectations. Take time to check analyst forecasts for earnings per share (EPS), revenue, and forward guidance. Studying a company’s past results can also help identify patterns – such as how it tends to perform after beating or missing estimates.

Consider the broader market context

Earnings don’t exist in isolation. Central bank decisions, inflation data, or geopolitical developments can shape how the market reacts to company results. A strong report might not lead to a rally if investor sentiment is cautious or global conditions are uncertain.

Prioritise quality over quantity

Rather than chasing every potential setup, focus on a few well-researched opportunities that align with your trading style. This helps you stay disciplined and avoid emotional decision-making when the market gets noisy.

How to trade during earnings season

There are two main ways to trade earnings: entering positions before the announcement or reacting afterward.

Some traders take positions ahead of releases, aiming to profit from surprises. This approach relies on anticipating market sentiment but carries the risk of sharp price gaps if results disappoint.

For example, Netflix’s stock soared after beating subscriber forecasts in Q2 2024 but fell over 12% the previous quarter when results missed expectations.

For those seeking lower risk, waiting to trade the reaction can be wiser. This means looking for breakout moves or pullbacks once the price starts trending after the announcement, often using technical patterns to confirm momentum.

Regardless of strategy, managing risk is crucial. Earnings season brings high volatility, so reduce position sizes, use stop-loss orders, and avoid overexposure. Sometimes, the best choice is to stay on the sidelines and observe – discipline can be your greatest asset.

Common mistakes to avoid

Many traders face challenges during earnings season. To help you avoid common pitfalls, watch out for these mistakes:

  • Forgetting earnings dates: Not knowing when a company reports can leave you exposed to unexpected volatility.
  • Assuming good results always mean a price increase: Markets price in expectations in advance; even strong earnings can lead to a selloff if forecasts were too optimistic.
  • Overconfidence and large positions: Placing big trades on hunches or reacting emotionally to early moves can lead to significant losses.
  • Ignoring risk management: Trading without stop-losses or overleveraging increases your risk unnecessarily.
  • Chasing trades: Jumping into a position after a big move can result in poor entry points and higher losses.

By staying aware of these common errors, you’ll be better positioned to protect your capital and trade more effectively during earnings season.

Conclusion

Earnings season is one of the most active and potentially rewarding periods in the markets – but success depends on preparation. With the right mindset, a well-chosen watchlist, and effective risk management, even non-professional traders can approach this time with confidence and clarity.

Now is the time to put your knowledge into action. Open a live account with VT Markets today and gain access to powerful trading tools, lightning-fast execution, and real-time market data. Don’t miss out on the opportunities earnings season offers – start trading smarter and seize your moment with VT Markets.

Back To Top
server

Hello there 👋

How can I help you?

Chat with our team instantly

Live Chat

Start a live conversation through...

  • Telegram
    hold On hold
  • Coming Soon...

Hello there 👋

How can I help you?

telegram

Scan the QR code with your smartphone to start a chat with us, or click here.

Don’t have the Telegram App or Desktop installed? Use Web Telegram instead.

QR code