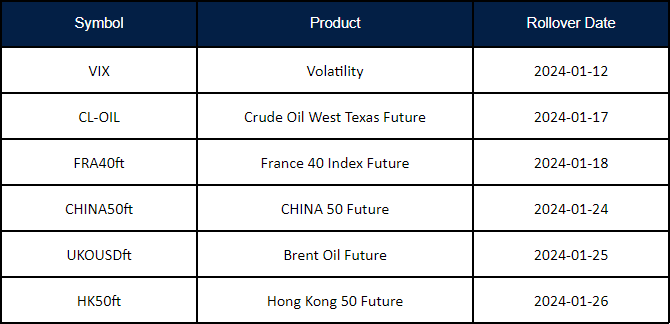
New contracts will automatically be rolled over as follows:
Please note:
• The rollover will be automatic, and any existing open positions will remain open.
• Positions that are open on the expiration date will be adjusted via a rollover charge or credit to reflect the price difference between the expiring and new contracts.
• To avoid CFD rollovers, clients can choose to close any open CFD positions prior to the expiration date.
• Please ensure that all take-profit and stop-loss settings are adjusted before the rollover occurs.
• All internal transfers for accounts under the same name will be prohibited during the first and last 30 minutes of the trading hours on the rollover dates.
If you’d like more information, please don’t hesitate to contact info@vtmarkets.com.
Embarking on the exhilarating journey of Forex trading is like riding a rollercoaster, with its ups and downs, twists, and turns. Just like a rollercoaster ride, the financial markets can be thrilling, and sometimes, unpredictable.
In the last Bull market, spanning from March 2009 to February 2020, the S&P 500 surged an astonishing 339%, transforming a $10,000 investment into a remarkable $43,900. It was a period of exuberance and optimism, where the financial landscape seemed boundless.
However, as we’ve witnessed, the financial markets are not all highs and cheers. The Bear market that swiftly followed in March 2020, triggered by the unforeseen COVID-19 pandemic, illustrated the capricious nature of financial markets. In just over a month, the S&P 500 plummeted by 33.9%, showcasing the rapid shift from exuberance to caution.
These events underscore the importance of understanding bull and bear markets for Forex traders, as navigating these fluctuations can be both challenging and rewarding.
In this article, we’ll delve into the meaning and characteristics of bull and bear markets, explore the reasons behind their occurrences, and equip you with strategies to thrive in both market conditions.
What is a Bull Market?
The term “Bull Market” finds its roots in the behaviour of the formidable bull. When a bull charges, it thrusts its horns upward, symbolising a rising market. This metaphor encapsulates the essence of a Bull Market, where the financial landscape experiences an upward surge, mirroring the powerful and optimistic momentum witnessed when a bull charges forward.
A Bull Market, as the name suggests, denotes a period of optimism, growth, and ascending asset prices. During this phase, investor confidence is on the rise, fostering a positive outlook and a readiness to embrace risk-taking activities.
Numerous factors contribute to the emergence of a Bull Market, including favorable economic indicators such as robust GDP growth, low unemployment rates, and stellar corporate earnings. Accommodative government policies, favorable monetary measures, and overall confidence in the financial system work in tandem to propel asset prices upward during these bullish phases.
Bull markets exhibit varying durations, ranging from a few months to several years. Notably, they tend to outlast bear markets and have occurred for an impressive 78% of the past 91 years. On average, a bull market persists for approximately 973 days, equivalent to 2.7 years.
What is a Bear Market?
The term “Bear Market” finds its origin in the actions of a bear. When a bear attacks, it swipes its paws downward, symbolising a declining market. This imagery captures the essence of a Bear Market, where financial conditions take a downturn, akin to the motion of a bear moving its paws downward.
A Bear Market, as the name suggests, represents a period of pessimism, decline, and falling asset prices. During this phase, investor confidence diminishes, leading to a negative outlook and a reluctance to engage in risk-taking activities.
Several factors contribute to the emergence of a Bear Market, including unfavourable economic indicators such as economic contractions, rising unemployment rates, and weakened corporate earnings. Unfavourable government policies, restrictive monetary measures, and a general lack of confidence in the financial system collectively contribute to driving asset prices downward during these challenging market phases.
Historically, bear markets tend to be shorter than bull markets. On average, a bear market lasts just 289 days, or just under 10 months. While some bear markets have extended over years, the longest recorded bear market occurred during the Great Depression from March 1937 to April 1942, lasting for 61 months.
In recent decades, bear markets have generally become shorter in length. For instance, in 1990, a bear market lasted for just three months. Recovery periods after bear markets vary; since World War II, it has taken about two years, on average, for the stock market to recover or reach its previous high.
It’s crucial to note that even during bear markets, the stock market can witness significant gains. Over the last two decades, over half of the S&P 500’s strongest days occurred during bear markets, emphasising the unpredictable nature of market movements.
Lucia Heffernan, Wall Street Gothic source: Rehs Contemporary Galleries, Inc., New York City
What Should a Trader Do in a Bull or a Bear Market?
Navigating the waters of financial markets requires traders to be versatile, adapting their strategies to the prevailing conditions – be it the soaring heights of a bull market or the challenging terrain of a bear market.
Strategies for Traders During a Bull Market:
1. Trend-Following: In the upbeat atmosphere of a bull market, traders can align with the prevailing trend, known as trend-following. This involves capitalising on the upward momentum of assets, riding the wave of optimism among investors.
2. Momentum Trading: Another effective strategy during a bull market is momentum trading. Traders identify assets with strong recent performance, anticipating that the upward momentum will continue. This approach leverages the positive sentiment that characterises bull markets.
3. Strategic Investments: Bull markets provide an ideal environment for strategic investments. Traders may consider allocating resources to growth-oriented assets and industries, capitalising on the prevailing optimism and economic expansion.
Strategies for Traders During a Bear Market:
1. Hedging: As the market takes a downturn, traders may employ hedging strategies to protect their portfolios from significant losses. Techniques such as options or inverse exchange-traded funds (ETFs) can act as a financial shield against the falling prices prevalent in a bear market.
2. Contrarian Approaches: Adopting a contrarian mindset in a bear market involves going against the prevailing sentiment. Traders may seek opportunities in oversold assets, expecting a potential rebound despite the overall negative outlook.
3. Defensive Investments: Shifting towards defensive assets like bonds, gold, or stable dividend-paying stocks helps mitigate risk during a bear market. These defensive investments act as a protective buffer against the downward pressures on asset prices.
Effective risk management is crucial for successful trading, no matter the market conditions. Traders must establish clear risk tolerance levels, ensuring they are comfortable with potential losses. Diversifying portfolios by spreading investments across different assets and industries helps mitigate the impact of poor performance in specific sectors.
Additionally, implementing stop-loss orders is vital in both bull and bear markets, automatically selling a security when it reaches a predetermined price to help traders minimise losses and protect gains.
Successfully navigating financial markets requires not only strategic acumen but also emotional resilience. In the optimism of a bull market, where euphoria can take hold, maintaining discipline is paramount to avoid impulsive decisions driven by overconfidence or greed.
Conversely, in the challenges of a bear market, characterised by fear and panic, traders must adhere to their strategies, steering clear of emotional reactions to market fluctuations.
Regardless of the market conditions, adaptability remains a psychological asset. Continuous learning about market conditions, economic indicators, and evolving strategies is essential for traders to thrive.
Navigating Bull and Bear Markets with VT Markets
Unlock the optimal approach to profit from both bullish and bearish market trends through CFD trading with VT Markets. Tailored to empower traders in diverse conditions, CFDs offer the flexibility to capitalise on market rises and falls seamlessly.
Whether going long to ride the upward momentum or going short to benefit from downturns, VT Markets provides a dynamic platform that allows swift trading across various asset classes. Diversify your portfolio effortlessly with currencies, indices, energies, metals, commodities, shares and bonds.
With user-friendly platforms and educational resources, VT Markets makes CFD trading accessible and effective. Open your live trading account in just 5 minutes and experience a landscape where adaptability converges with opportunity in the ever-changing dynamics of financial markets.
In conclusion, navigating the Forex rollercoaster demands a keen understanding of both bull and bear markets. The euphoria of bull markets, exemplified by the remarkable S&P 500 surge from 2009 to 2020, must be balanced with an awareness of downturns like the swift bear market triggered by the COVID-19 pandemic in 2020.
Traders must adapt strategies to both bullish and challenging bear markets, employing techniques such as trend-following, momentum trading, hedging, and contrarian approaches. Effective risk management and a resilient mindset are crucial, emphasising continuous learning and adaptability. In this landscape, traders can find success by employing versatile strategies and maintaining a disciplined and adaptable approach to market dynamics.
DXY index reflects the US dollar’s rebound on Wednesday.
Day concludes with the dollar retracing from session highs due to Fed minutes causing a pullback in yields.
Focus on Major Currency Pairs and Gold:
Near-term outlook analyzed for major pairs like EUR/USD and USD/JPY.
Fed’s Influence on Dollar Movement:
Last FOMC meeting minutes impact the dollar’s trajectory.
Indicates the potential for sustained high-interest rates and a cautious approach toward easing.
Macro Data Importance:
Fed’s policy outlook in a state of flux.
Macro data becomes crucial in guiding the central bank’s next moves and timing of the first rate cut.
Upcoming Jobs Report:
All eyes on the December nonfarm payrolls survey (NFP) releasing on Friday.
Consensus estimates project 150,000 new jobs, with a potential uptick in the unemployment rate to 3.8%.
Labor Market’s Role in Dollar’s Recovery:
Dollar’s continued recovery hinges on robust and dynamic hiring.
Strong job growth signaling economic resilience could drive yields higher and support the greenback.
Scenario Analysis for Dollar’s Future:
NFP figure above 200,000 considered bullish for the US dollar.
Below-expectation job growth (e.g., under 100,000) could weaken the dollar, confirming expectations for significant rate cuts and indicating economic downshifting.
STOCK MARKET:
Stock Market News Today:
Stocks extend losses at the beginning of the new year.
Nasdaq slides over 1%.
Market Indices Performance:
Dow Jones Industrial Average (^DJI) drops over 0.7% (285 points decline).
S&P 500 (^GSPC) slips approximately 0.8%.
Nasdaq Composite (^IXIC) experiences a nearly 1.2% decline.
Reasons for Stock Decline:
Optimism for swift interest-rate cuts diminishes.
Fresh jobs data and Federal Reserve meeting minutes highlight uncertainty in the timing of rate cuts.
Labor Market Data:
New data from the Bureau of Labor Statistics reveals 8.79 million job openings at the end of November.
Lowest level since March 2021, missing economists’ expectations of 8.82 million openings.
Market Conditions and Expectations:
Year-end market rally expectations take a hit.
Stock indexes and bond prices experience their worst start to a year in decades.
Bonds decline for the fourth consecutive day, pushing the 10-year Treasury yield (^TNX) initially near 4% before reversing to close at roughly 3.91%.
Fed Meeting Minutes Impact:
Stocks show little change after the release of minutes from the recent Federal Reserve meeting.
Minutes indicate Fed officials believe “upside risks” to inflation have diminished.
Majority of participants express the view that a lower target range for the federal funds rate would be appropriate by the end of 2024.
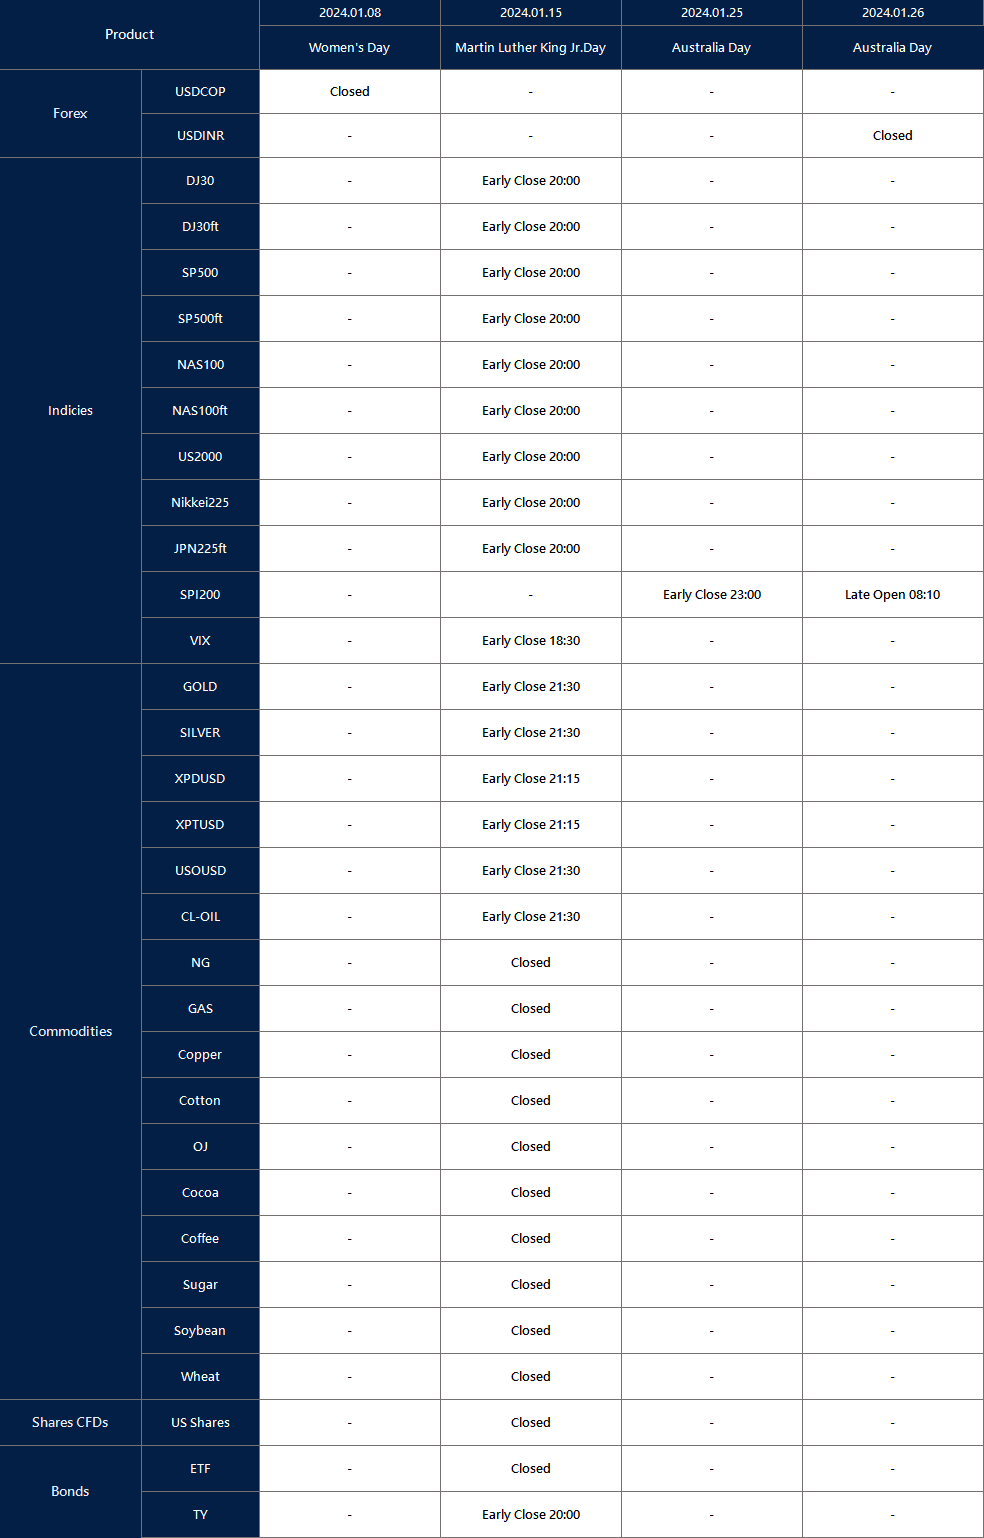
Affected by international holidays, the trading hours of some VT Markets products will be adjusted. Please check the following link for the remaining affected products:
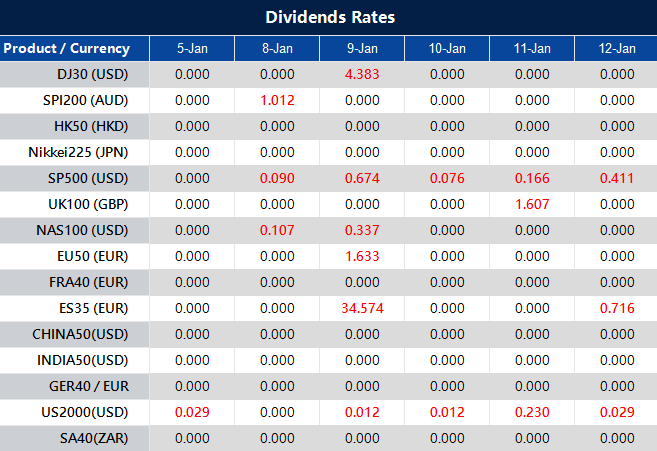
Please note that the dividends of the following products will be adjusted accordingly. Index dividends will be executed separately through a balance statement directly to your trading account, and the comment will be in the following format “Div & Product Name & Net Volume ”.
Please refer to the table below for more details:
The above data is for reference only, please refer to the MT4/MT5 software for specific data.
If you’d like more information, please don’t hesitate to contact info@vtmarkets.com.
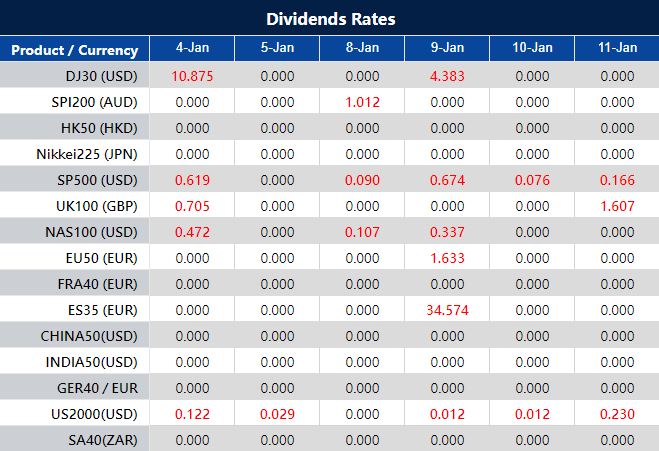
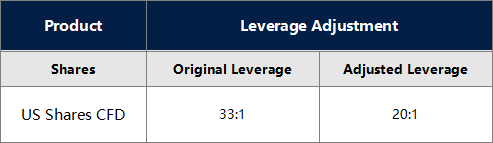
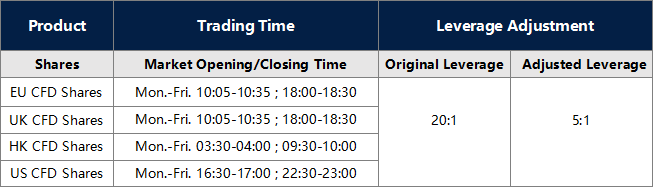
To provide a favorable trading environment to our clients, VT Markets will modify the trading setting of all share CFDs on Jan 8 , 2024:
1. All US Shares products leverage will be adjusted to 20:1 .
2. MT5 All Shares products: New positions opened within 30 minutes before market closing and after market opening will start with leverage of 5:1 . After the mentioned period, the leverage will be resumed to original leverage and will not be adjusted back to 5:1 .
The above data is for reference only; please refer to the MT4 and MT5 software for specific data.
Friendly reminders:
1. All specifications for Shares CFD stay the same except leverage during the mentioned period.
2. The margin requirement of the trade may be affected by this adjustment. Please make sure the funds in your account are sufficient to hold the position before this adjustment.
If you’d like more information, please don’t hesitate to contact info@vtmarkets.com.


