Please note that the dividends of the following products will be adjusted accordingly. Index dividends will be executed separately through a balance statement directly to your trading account, and the comment will be in the following format “Div & Product Name & Net Volume ”.
Please refer to the table below for more details:
The above data is for reference only, please refer to the MT4/MT5 software for specific data.
If you’d like more information, please don’t hesitate to contact info@vtmarkets.com.
Written on December 18, 2023 at 7:14 am, by anakin
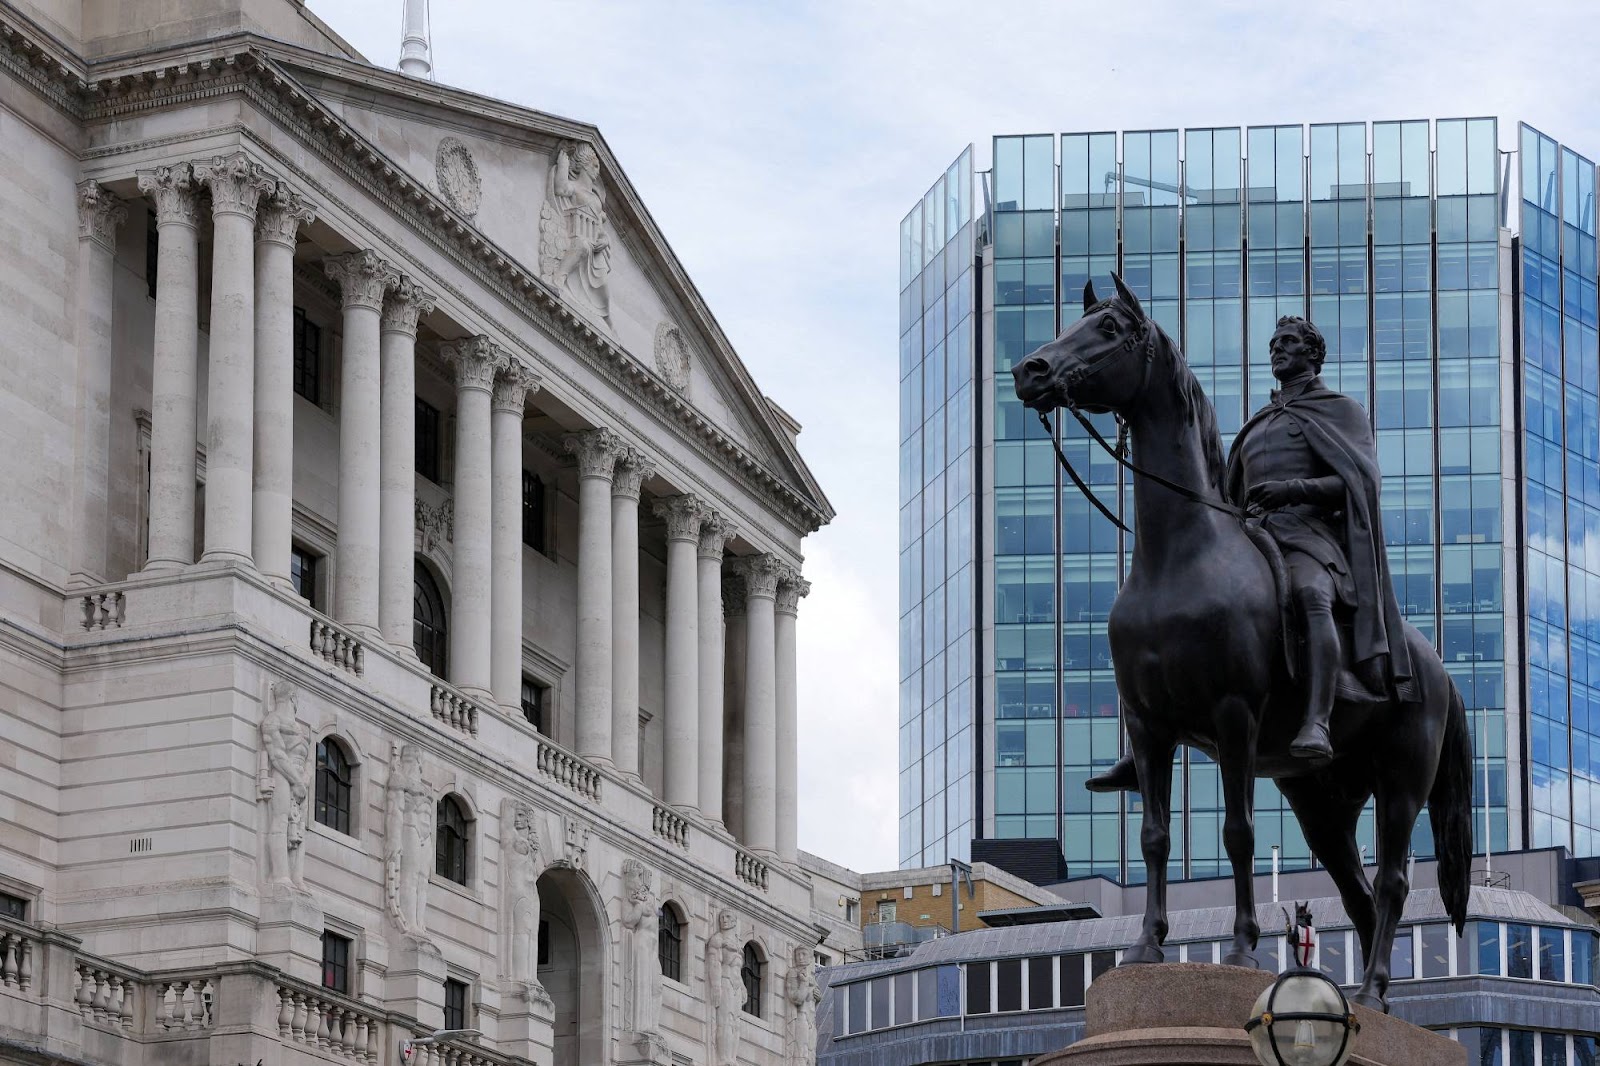
This week, the market’s focus will primarily revolve around the Bank of Japan’s rate decision. Investors are eagerly anticipating any statements from the bank’s governor Kazuo Ueda, especially after observing the impact of the strong Japanese Yen arising from a weakening US Dollar. In addition to this, consumer price index (CPI) and gross domestic product (GDP) data for various regions will also be released, possibly further affecting the market.
As always, traders are advised to exercise caution as we approach these significant market highlights for the week:
Bank of Japan’s interest rate decision (19 December 2023)
Following its October meeting, the Bank of Japan (BOJ) maintained its key short-term interest rate at -0.1% and held 10-year bond yields steady at approximately 0%.
No changes are expected in the BOJ’s upcoming rate statement, scheduled for release on 19 December.
Canada CPI (19 December 2023)
Canada’s CPI rose by 0.1% month-over-month in October 2023, rebounding from a 0.1% decline in September.
Analysts expect a decrease of 0.2% in the CPI figures for November, scheduled for release on 19 December.
UK annual CPI (20 December 2023)
The UK’s annual CPI data reflected a decline in the UK’s inflation rate, from 6.7% in August and September 2023 to 4.6% in October 2023.
Analysts expect the UK’s annual CPI to drop further to 4.3% in the next set of updated figures, scheduled for release on 20 December.
US final GDP (21 December 2023)
The US economy saw an annualised expansion of 5.2% in Q3 2023, surpassing a preliminary estimate of 4.9% and marking the strongest growth since Q4 2021.
Analysts expect a 5.2% expansion in the US economy to be confirmed following the release of updated GDP data on 21 December.
UK retail sales (22 December 2023)
Retail sales in the UK declined by 0.3% month-over-month in October 2023 following a revised 1.1% decrease in September.
Analysts expect a 0.5% increase in the next set of UK retail sales figures, scheduled for release on 22 December.
Canada GDP (22 December 2023)
The Canadian economy grew by 0.1% in September 2023, primarily propelled by a 0.3% increase in goods-producing industries. This also marked its first upturn in six months.
Analysts expect a 0.2% increase in the next set of GDP data for Canada, slated for release on 22 December.
US core PCE price index (22 December 2023)
Core personal consumption expenditure (PCE) prices for the US increased by 0.2% in October 2023, marking a slight easing from the 0.3% rise observed in September.
Analysts expect a 0.2% increase in the core PCE price index for the US following the release of updated data on 22 December.
Written on December 18, 2023 at 2:50 am, by anakin
The Forex market’s landscape is constantly evolving, with various countries emerging as key players based on the number of active traders.
In 2023, according to data provided by Forex Broker Report, there’s been a significant global distribution of Forex traders. This spread is largely influenced by the intricate dynamics of advanced financial systems and regulatory frameworks.
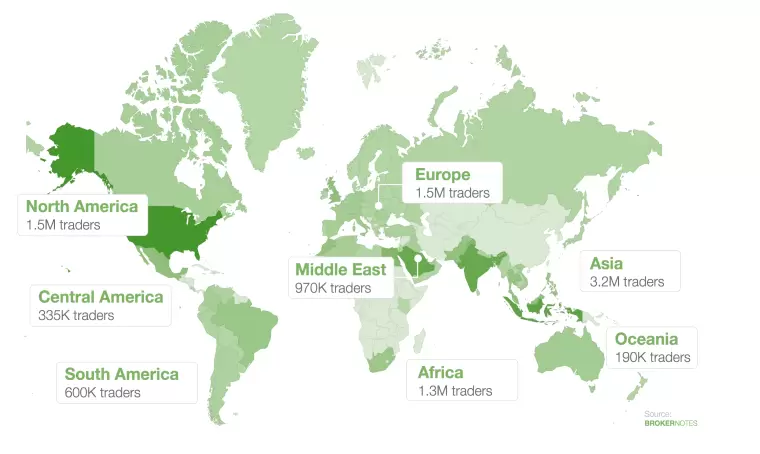
The regional distribution of online Forex traders Source: Broker Notes
The global distribution of online Forex traders, as highlighted in the ForexBrokers.com report, shows a notable regional variance: Asia leads with 3.2 million online traders, Europe follows with 1.5 million, and Africa with 1.3 million, while the United States also shows a substantial presence in the Forex market. These figures underscore the widespread popularity and varied levels of Forex trading engagement across different regions.
As we delve into the top 10 countries at the forefront of Forex trading, each presents a unique combination of attributes and challenges within their Forex markets.
1. United Kingdom (341,000 Traders)
The UK, especially London, is not just Europe’s but one of the world’s foremost financial hubs. The Financial Conduct Authority (FCA) provides robust regulation, ensuring transparency and trader protection. London’s time zone advantageously positions it to capitalise on both Asian and American market hours, enhancing its Forex trading activity.
2. United States (335,000 Traders)
The U.S. boasts a highly developed financial market with extensive Forex trading activity. The regulatory environment, overseen by organisations like the CFTC and NFA, ensures a secure trading platform for a diverse array of traders. The U.S. dollar’s dominance in global finance further amplifies the country’s role in the Forex market.
3. Japan (223,000 Traders)
Japan’s Forex market has witnessed exponential growth since retail Forex trading was legalised in 1998. The Japanese yen, a major currency in Forex markets, is often involved in carry trades due to Japan’s low-interest-rate environment. The Financial Services Agency (FSA) maintains a well-regulated trading environment, balancing openness with trader protection.
4. Singapore (218,000 Traders)
As a critical financial centre in Asia, Singapore’s strategic location enables significant trading overlap with global markets. The Monetary Authority of Singapore (MAS) is known for its stringent regulatory standards, fostering a secure and efficient trading environment. Singapore’s advanced technological infrastructure also contributes to its robust Forex market.
5. Hong Kong (200,000 Traders)
Hong Kong stands as a significant gateway to Asian markets, with a stable economy and a strong regulatory framework. The Hong Kong dollar is a crucial currency in Forex markets, and the region’s proximity to mainland China adds to its strategic trading position. Hong Kong’s sophisticated financial services sector attracts traders globally.
6. Australia (195,000 Traders)
Australia’s Forex market is underpinned by its resource-driven economy and political stability. Regulated by the Australian Securities and Investments Commission (ASIC), the market offers a safe environment for traders. The Australian dollar, a commodity currency, is highly influenced by the country’s trade dynamics, particularly with China.
7. Switzerland (182,000 Traders)
Switzerland’s reputation for financial stability and banking secrecy makes its Forex market attractive. The Swiss Franc, a safe-haven currency, is a popular choice during global economic uncertainties. Switzerland’s Forex market benefits from its neutrality and the country’s stringent regulatory practices.
8. France (120,000 Traders)
France’s Forex market is integral to the Eurozone. The Euro’s strength and stability, combined with France’s significant economic position in Europe, make it a key player in Forex trading. The Autorité des Marchés Financiers (AMF) ensures a well-regulated trading environment.
9. Germany (109,000 Traders)
Germany’s robust economy and the Euro’s prominence bolster its Forex market. Germany’s Forex trading is influenced by its strong industrial and export sectors. The Federal Financial Supervisory Authority (BaFin) provides a stringent regulatory framework, ensuring market integrity.
10. China (105,000 Traders)
China’s growing Forex market reflects its rising economic power. The Chinese Yuan’s increasing inclusion in global Forex trading symbolises China’s expanding financial influence. However, the market is more regulated and less open than in other major countries, with strict oversight from the People’s Bank of China and SAFE.
In conclusion, the Forex trading landscape in 2023 highlights the diversity and dynamism of global financial markets. Each of the top 10 countries offers unique advantages and challenges, shaped by their respective economic conditions, regulatory frameworks, and currency strengths. These nations not only provide significant opportunities for Forex traders but also play a crucial role in shaping the future of international finance and trade.
Written on December 15, 2023 at 8:32 am, by anakin
In the fast-paced world of Forex trading, where fortunes can be made or lost in the blink of an eye, the importance of selecting the right trading approach cannot be overstated.
Today, over 70% of traders rely on algorithmic trading methods, as revealed by the research report “Predictive Assessment of Electronic Trade Dynamics: 2022-2027“. This staggering statistic underscores the prevalence and influence of algorithmic trading in the contemporary financial landscape.
Understanding the nuances of both manual and algorithmic trading is crucial for non-professional traders to navigate these complexities successfully. Let’s delve into these approaches, exploring their intricacies and uncovering the key considerations that can shape the success of Forex trading.
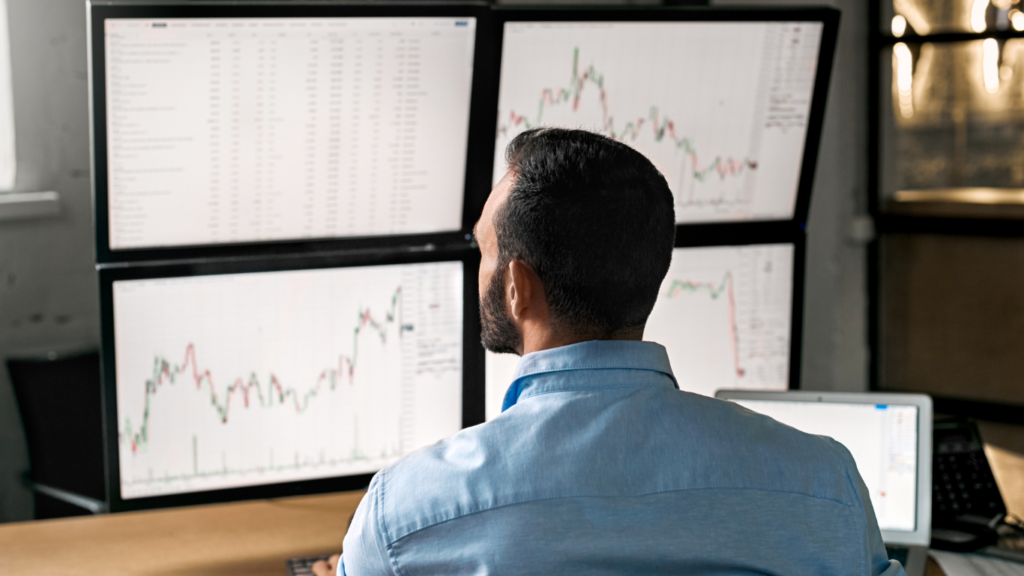
Manual Trading: The Art of Hands-On Decision-Making
Involving a traditional, hands-on approach where traders rely on intuition and market analysis, manual trading provides a unique learning experience and enables the exercise of emotional control.
This method offers a practical learning environment, allowing traders to engage directly with the market. For instance, envision a trader meticulously analysing historical price charts, identifying key support and resistance levels, and anticipating a trend reversal based on a combination of technical indicators and economic factors.
Actively participating in decision-making processes, manual trading helps traders develop emotional control – a crucial aspect of success. Consider a scenario where a trader, faced with a sudden market downturn, resists the impulse to panic sell and instead relies on their analysis to make rational decisions, avoiding potentially significant losses.
However, manual trading has its challenges. The time-intensive nature demands constant attention, making it challenging for traders with busy schedules. Emotional challenges remain prevalent, and the limited capacity for multitasking can hinder a trader’s ability to seize multiple opportunities simultaneously.
To illustrate, imagine a manual trader who, after studying market conditions, identifies a potential breakout in a currency pair. This trader monitors the charts, patiently waiting for the opportune moment to enter the market. When the anticipated reversal occurs, the trader executes a well-timed trade, capitalising on insights gained through hands-on analysis.
In essence, manual trading offers a personalised and engaging experience for traders willing to invest time and effort into understanding the intricacies of the Forex market. While it requires discipline and focused attention, the skills acquired through manual trading can be invaluable for those seeking a deep connection with their trading strategies.
Algorithmic Trading: The Precision of Automated Decision-Making
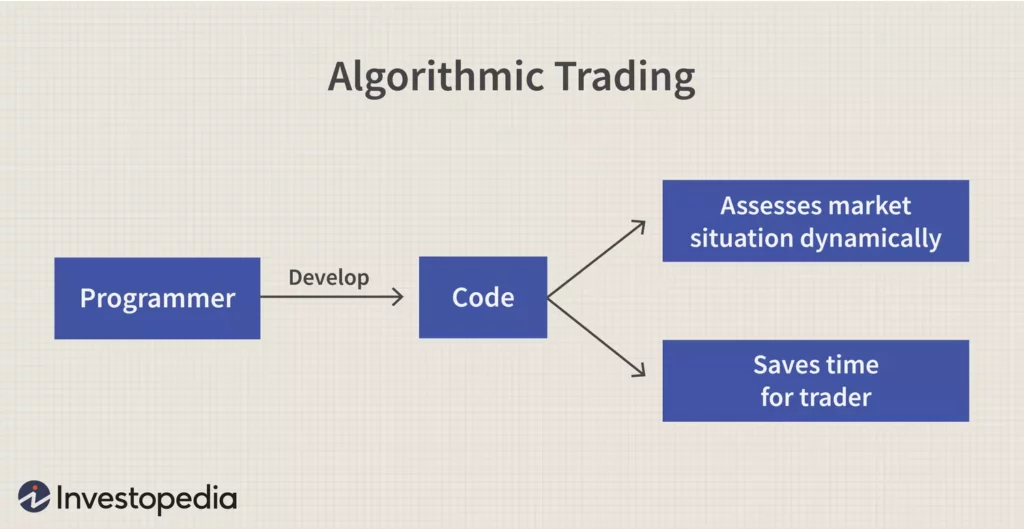
In stark contrast to manual methods, algorithmic trading relies on automated execution and data-driven decisions, emphasising speed, efficiency, and systematic strategy application.
Algorithmic trading excels in speed and efficiency, processing vast market data in milliseconds. An example is an algorithm identifying and capitalising on price discrepancies across markets, executing trades instantaneously.
Algorithmic trading model source: Investopedia
Crucial to algorithmic trading, backtesting validates strategies using historical data, minimising the risk of flawed analysis. Imagine a trader developing an algorithm identifying profitable trends through historical price movements, ensuring viability before live application.
Despite its advantages, algorithmic trading has complexities. A steep learning curve demands proficiency in programming and data analysis. Over-reliance on historical data poses risks, as strategies may lose effectiveness in rapidly changing markets.
Consider a trader developing a sophisticated algorithm with machine learning techniques, allowing anticipation of price movements accurately and consistently yielding profits by adapting to evolving market conditions.
Algorithmic trading comes with risks, including system failures and technical challenges. Traders must be vigilant to address potential issues promptly, as glitches or failures could lead to unintended consequences.
In essence, algorithmic trading offers an efficient, systematic approach to Forex trading. Despite technical demands and potential risks, a well-designed algorithm has the potential to unlock consistent profits in the ever-evolving financial landscape.
Factors to Consider: Choosing Between Manual and Algorithmic Trading
When faced with the decision between manual and algorithmic trading, a careful evaluation of several key factors can significantly impact your trading journey.
Factor 1.Risk Tolerance:
Manual Trading: Ideal for those comfortable with risk, offering flexibility and adaptability.
Algorithmic Trading: Suited for risk-averse individuals, providing a disciplined and controlled approach.
Factor 2.Time Commitment:
Manual Trading: Demands constant attention and time investment.
Algorithmic Trading: Offers automation, saving time for exploring opportunities and strategy refinement.
Factor 3.Skill Level:
Manual Trading: Requires a deep understanding of market dynamics and analysis.
Algorithmic Trading: Involves programming and data analysis skills.
In summary, align your trading approach with your risk tolerance, time commitments, and skill set to make an informed decision between manual and algorithmic trading.
For example, a computer science-savvy trader might excel in algorithmic trading, leveraging programming skills. Meanwhile, a trader attuned to market psychology may find success in manual trading.
Each method has unique benefits, ensuring a strategic fit for your preferences and enhancing your success in Forex trading.
Combining Manual and Algorithmic Trading: The Power of Hybrid Strategies
As technology and trading methodologies evolve, the concept of hybrid trading has emerged as a compelling strategy for traders seeking the best of both worlds. By combining manual and algorithmic approaches, traders can capitalise on the strengths of each method, creating a versatile and adaptive trading strategy.
source: Freepik
Intuitive Decision-Making with Efficiency
Hybrid trading combines manual intuition with algorithmic efficiency. Traders leverage the strengths of both approaches – making informed decisions based on market understanding while benefiting from the speed and precision of automated execution.
Risk Management at the Core
Central to hybrid trading is robust risk management. Traders can swiftly adapt to changing market conditions by switching between manual and algorithmic modes. This dynamic approach enhances risk mitigation, allowing traders to navigate diverse market scenarios with agility.
A trader, combining economic insight with sentiment analysis algorithms, may switch between manual and algorithmic modes based on market events. This adaptability ensures critical decision-making during unexpected situations.
Continuous Adaptation and Learning
Hybrid traders embrace continuous adaptation and learning. The synergy between manual and algorithmic methods enables real-time strategy refinement, crucial in the ever-changing Forex market.
Optimising Strengths, Minimising Weaknesses
By combining manual and algorithmic trading, traders aim to optimise strengths while mitigating weaknesses. Manual trading adapts to unique market conditions, while algorithmic trading provides efficiency in executing predefined strategies.
VT Markets welcomes traders of all styles, whether engaging in manual or algorithmic trading.
For manual traders, the user-friendly interfaces of MT4, MT5, and WebTrader Plus ensure a seamless and intuitive experience across Forex, indices, commodities, and other assets. Execute trades with precision and efficiency, empowered by real-time data and analytical tools.
Alternatively, for those who prefer automated strategies, leverage the platform’s compatibility with expert advisors. Implement finely-tuned algorithmic approaches tailored to the nuances of your preferred instrument and aligned with unique trading objectives.
In conclusion, both manual and algorithmic trading have their merits and drawbacks. Forex traders should explore both approaches, considering factors such as risk tolerance, time commitment, and skill level. Embracing a hybrid strategy and leveraging the tools and opportunities provided by platforms like VT Markets can empower traders to navigate the Forex market successfully. Continuous learning and adaptation are key in this ever-evolving financial landscape.
Summary:
Manual trading and algorithmic trading are two primary approaches to engaging in financial markets.
Manual trading involves hands-on decision-making but faces challenges like time intensity.
Algorithmic trading relies on automated execution but has a steep learning curve.
Hybrid trading, blending manual intuition with algorithmic efficiency, is gaining popularity.
Consider your risk tolerance, time commitments, and skill set when choosing between manual and algorithmic trading in Forex.
Written on December 15, 2023 at 7:56 am, by anakin
Please note that the dividends of the following products will be adjusted accordingly. Index dividends will be executed separately through a balance statement directly to your trading account, and the comment will be in the following format “Div & Product Name & Net Volume ”.
Please refer to the table below for more details:
The above data is for reference only, please refer to the MT4/MT5 software for specific data.
If you’d like more information, please don’t hesitate to contact info@vtmarkets.com.
Written on December 15, 2023 at 7:32 am, by anakin
Please note that the dividends of the following products will be adjusted accordingly. Index dividends will be executed separately through a balance statement directly to your trading account, and the comment will be in the following format “Div & Product Name & Net Volume ”.
Please refer to the table below for more details:
The above data is for reference only, please refer to the MT4/MT5 software for specific data.
If you’d like more information, please don’t hesitate to contact info@vtmarkets.com.
Written on December 14, 2023 at 8:25 am, by anakin
Please note that the dividends of the following products will be adjusted accordingly. Index dividends will be executed separately through a balance statement directly to your trading account, and the comment will be in the following format “Div & Product Name & Net Volume ”.
Please refer to the table below for more details:
The above data is for reference only, please refer to the MT4/MT5 software for specific data.
If you’d like more information, please don’t hesitate to contact info@vtmarkets.com.
Written on December 13, 2023 at 9:12 am, by anakin
Please note that the dividends of the following products will be adjusted accordingly. Index dividends will be executed separately through a balance statement directly to your trading account, and the comment will be in the following format “Div & Product Name & Net Volume ”.
Please refer to the table below for more details:
The above data is for reference only, please refer to the MT4/MT5 software for specific data.
If you’d like more information, please don’t hesitate to contact info@vtmarkets.com.
Written on December 12, 2023 at 7:55 am, by anakin
Please note that the dividends of the following products will be adjusted accordingly. Index dividends will be executed separately through a balance statement directly to your trading account, and the comment will be in the following format “Div & Product Name & Net Volume ”.
Please refer to the table below for more details:
The above data is for reference only, please refer to the MT4/MT5 software for specific data.
If you’d like more information, please don’t hesitate to contact info@vtmarkets.com.
Written on December 11, 2023 at 7:41 am, by anakin
This week, the market’s primary focus revolves around the rate decisions of major central banks as they convene for their final meetings in 2023. Aside from these pivotal central bank decisions, the market is also keeping a close eye on the US consumer price index and producer price index, given that signs of inflation could influence the Fed’s policies during this period.
As always, traders are advised to exercise caution as we approach these upcoming market highlights for the week:
US consumer price index (12 December 2023)
Consumer prices in the US remained unchanged in October after a 0.4% increase in September.
Analysts expect no changes in the updated consumer price index for November, set to be released on 12 December.
UK monthly gross domestic product (13 December 2023)
The UK’s monthly gross domestic product (GDP) grew by 0.2% month-over-month in September 2023, following a 0.1% growth in August.
Updated figures are set to be released on 13 December, with analysts expecting the UK’s GDP to contract by 0.1%.
US producer price index (13 December 2023)
Producer prices in the US fell by 0.5% month-over-month in October 2023, marking the most significant decline since April 2020.
Analysts are forecasting an increase of 0.1% in the updated producer price index for the US, set to be released on 13 December.
The Fed’s interest rate decision (14 December 2023)
For the second consecutive time in November, the Federal Reserve maintained the federal funds rate at its 22-year high of 5.5%, a reflection of policymakers’ commitment to balancing the goal of reaching a 2% inflation target while avoiding excessive monetary tightening.
The next rate statement is slated for release on 14 December, with analysts expecting the rate to stay steady at 5.5%.
Swiss National Bank’s interest rate decision (14 December 2023)
The Swiss National Bank (SNB) unexpectedly opted to maintain its benchmark policy rate at 1.75% during its September 2023 meeting. This decision marks a temporary halt in the rate-hike campaign initiated in June of the previous year.
No change is expected in the SNB’s forthcoming rate statement, slated for release on 14 December.
Bank of England’s interest rate decision (14 December 2023)
During its November meeting, the Bank of England held firm on its benchmark interest rate, keeping it steady at a 15-year high of 5.25% for the second consecutive time. This decision comes as a response to recent indications of a slowdown in the UK’s economy coupled with the persistent challenge posed by elevated inflation.
The next rate statement is expected to be released on 14 December, with analysts expecting the rate to be maintained at 5.25%
European Central Bank’s interest rate decision (14 December 2023)
The European Central Bank (ECB) maintained its interest rates at 4.5% in October, signalling a notable departure from its 15-month trend of consecutive rate hikes. This decision underscores a shift towards a more cautious approach among policymakers, influenced by easing price pressures and apprehensions regarding an impending recession.
No change is expected in the ECB’s forthcoming rate statement, slated for release on 14 December.
US retail sales (14 December 2023)
After a 6-month stretch of growth, retail sales in the US declined by 0.1% month-over-month in October 2023.
Analysts expect another 0.1% decrease in the forthcoming retail sales data for the US, scheduled to be released on 14 December.
Written on December 11, 2023 at 2:10 am, by anakin