The US Dollar Index (DXY) is trading just below 99.0, with potential for further falls if a lasting Middle East peace deal is reached and shipping through the Strait of Hormuz returns to normal.
Attention is on the March US CPI release, with expectations for headline CPI to rise by 0.9 percentage points to 3.4% year-on-year. Core CPI is forecast to edge up from 0.2% to 0.3% month-on-month.
Federal Reserve Focus On Core Inflation
The Federal Reserve is expected to focus on possible second-round effects from energy prices, which may show up in core inflation after several months. The CPI report is not expected to alter market pricing for the Fed unless inflation is much higher than forecast.
Higher inflation may also feed into US domestic politics, with some Republicans opposing the war and rising petrol prices. This could increase pressure on President Donald Trump to pursue a peace deal.
With inflation in the news, further near-term dollar weakness may be harder to sustain. Middle East developments are still described as the main factor for near-term moves in USD.
Looking back at the analysis from 2025, we can see the same core drivers are at play today: geopolitical tensions and inflation. The focus then was on a potential Middle East peace deal and its impact on the Dollar. This framework remains useful for assessing the market now.
Today Market Drivers And Trade Setups
While the Strait of Hormuz is calmer, we now see persistent risks from naval standoffs in the South China Sea. These tensions have kept a floor under the dollar as a safe-haven asset, much like the Mideast risks did back then. Recent data from the U.S. Maritime Administration shows shipping insurance premiums for that region have edged up 5% in the last quarter, reflecting this nervousness.
Unlike the modest core CPI acceleration we watched for in 2025, today’s challenge is stickier inflation. The latest report for March 2026 showed core inflation holding firm at 3.1%, preventing the Federal Reserve from signaling any clear dovish pivot. This keeps rate cut expectations for the second half of the year in doubt.
This dynamic helps explain why the Dollar Index is not below 99.0 as it was during that period of optimism in 2025. Today, the DXY is holding strong around the 104.5 level. This strength reflects a market pricing in higher-for-longer US rates compared to its global peers.
For derivative traders, this environment suggests preparing for continued volatility rather than a clear directional trend. We see value in strategies like long strangles on major pairs like EUR/USD, which would profit from a significant move in either direction driven by a Fed surprise or a geopolitical flare-up. The Cboe FX Volatility Index (EUVIX) has ticked up to 7.8, showing the market is pricing in more chop ahead.
Given the persistent US inflation data, a tactical trade could involve buying near-term call options on the Invesco DB U.S. Dollar Index Bullish Fund (UUP). This provides upside exposure if the Fed delays cuts further, while capping downside risk to the premium paid. With the DXY testing resistance at 104.5, such a position would benefit from a breakout towards the 105.50 highs we saw late last year.
USD/CAD rebounded to about 1.3833 on Friday from a two-week low of 1.3805, ending a four-day decline. The move came as the US Dollar firmed ahead of US–Iran talks over the weekend in Pakistan on terms linked to a 10-point peace proposal.
The US Dollar Index (DXY) was up 0.15% at about 98.95 at the time of writing. Earlier in the week, Iran delivered a 10-point proposal after agreeing to reopen the Strait of Hormuz and accept a two-week truce, with a permanent ceasefire under discussion.
Key Data In Focus
Markets are also awaiting US March Consumer Price Index (CPI) data due at 12:30 GMT, which may affect expectations for Federal Reserve policy. In Canada, labour market data at 12:30 GMT is forecast to show 15K jobs added after an 83.9K drop in February, while unemployment is seen at 6.8% versus 6.7%.
USD/CAD traded near 1.3830, with the 20-day EMA flattening around 1.3824 after nearly a month of gains. RSI was 53.6, above 50, with support near 1.3800 and then 1.3752, while resistance sits at 1.3870 and 1.3967.
The USD/CAD pair is finding its footing near 1.3650 today, April 10, 2026, after a small dip earlier this week. The move comes as the US Dollar shows broad strength ahead of key inflation data. This price action suggests buyers are stepping in at technically important levels.
The US Dollar Index is holding firm above 104.50, as we are all still digesting the Consumer Price Index report from two days ago. That data showed headline inflation at a stubborn 3.1% year-over-year, which was higher than the 2.9% markets were looking for. This has pushed back expectations for any Federal Reserve interest rate cuts.
Options And Technical Levels
In Canada, last week’s labor report showed a healthy gain of nearly 40,000 jobs, which should be supportive for the loonie. However, this strength is being muted by the overpowering narrative of a resilient US economy and a cautious Fed. Oil prices, with WTI crude hovering near $85 per barrel, are providing a floor for the Canadian dollar but not a catalyst for a rally.
We remember how much of 2025 was defined by the Bank of Canada and the Fed moving in lockstep on policy. The current environment feels different, as the Fed’s singular focus on inflation is creating a policy gap that is giving the US dollar a distinct advantage. This divergence is a key theme for us this quarter.
With the US Producer Price Index data coming out later today, we believe implied volatility in near-term USD/CAD options may be undervalued. Traders could look at buying straddles if they anticipate a significant price move in either direction following the release. This strategy profits from a sharp move, regardless of direction.
For those with a directional bias to the upside, a bull call spread is a good way to express this view with managed risk. We see an opportunity in buying a May expiry call option with a 1.3700 strike and simultaneously selling one at the 1.3800 strike. This limits your upfront cost and defines your maximum potential gain.
Key support is now the 50-day moving average around 1.3610. A decisive break below this level would change the current positive outlook, and we would consider purchasing puts to hedge long positions. Until then, the path of least resistance appears to be sideways to higher.
AUD/JPY edged lower after four days of gains, trading near 112.50 during European hours on Friday. The pair stayed subdued as the Australian Dollar held losses after China’s March CPI data.
China’s CPI rose 1% year on year in March, down from 1.3% in February and below the 1.2% forecast. CPI fell 0.7% month on month after a 1.0% rise previously.
China Inflation Data Pressures Aussie Dollar
China’s PPI rose 0.5% year on year, after a 0.9% decline, for its first increase since September 2022. The move was partly linked to higher energy costs amid disruptions in the Strait of Hormuz.
The Australian Dollar also faced pressure from renewed risk aversion tied to uncertainty around the US–Iran ceasefire. Planned US–Iran talks in Islamabad this weekend remained unconfirmed on Friday.
The Japanese Yen found support as markets priced in a possible April Bank of Japan rate rise amid oil-led inflation risks. Japan’s 10-year government bond yield rose to near 2.4%, close to its highest level since 1998.
Japan’s government considered releasing about 20 days’ worth of extra oil reserves from early May to steady domestic supply. The article was corrected on April 10 at 08:32 GMT to confirm CPI at 1% and that AUD/JPY fell after four days of gains.
BoJ Expectations And Hedging Strategy
The divergence between the Australian Dollar and the Japanese Yen presents a clear opportunity for us. China’s softer-than-expected inflation data is weighing on the AUD, given the close trade links between the nations. At the same time, the market is increasingly betting on the Bank of Japan to raise interest rates this month, which is strengthening the Yen.
This risk-off sentiment, driven by the fragile US-Iran ceasefire, is reflected across markets, with the CBOE Volatility Index (VIX) climbing over 15% in the last week to settle near 16.5. This shows a growing demand for portfolio protection. We believe buying AUD/JPY put options with expirations after the late April BoJ meeting offers a good way to position for a further decline from the current 112.50 level.
From a technical standpoint, we are watching the 111.80 level, which corresponds to the 100-day moving average and has acted as key support in recent weeks. Looking back, we saw a similar build-up in expectations in early 2024, just before the historic March rate hike that ended negative interest rates. A decisive break below this support could trigger a more significant downward move.
The sharp rise in Japan’s 10-year bond yield to nearly 2.4% signals that the local market is taking the prospect of another rate hike very seriously. All eyes will be on the Bank of Japan’s policy meeting scheduled for April 25-26. The government’s consideration of releasing oil reserves further underscores the domestic pressure building from energy-driven inflation.
GBP/JPY rose for a fifth straight day and reached a two-month high near 213.85 in early European trading on Friday. The pair was set for strong weekly gains.
The Japanese yen stayed weak amid concern about instability in the Strait of Hormuz. Iran again shut traffic through the route after Israeli attacks on Lebanon, and Donald Trump warned of fresh strikes if an Iran deal fails.
Strait Of Hormuz Risk And Japan Energy Exposure
About 90% of Japan’s crude oil imports pass through the Strait of Hormuz. This raised concern about effects on Japan’s economy if disruption continues.
Benjamin Netanyahu said he instructed officials to begin direct negotiations with Lebanon as soon as possible. A US State Department official said Lebanon–Israel talks will be held next week in Washington, DC.
US–Iran talks were scheduled in phases between late Friday night and Saturday. Hopes of a ceasefire helped limit crude oil price rises and reduced pressure on the yen.
A firmer US dollar weighed on the pound and helped cap GBP/JPY. Even so, the pair remained in an uptrend, with pullbacks seen as limited.
Carry Trade Tailwinds And Positioning
A correction on 10 April at 08:14 GMT changed the move to a two-month high near 213.85, not a one-month high near 133.85.
We recall a similar setup around this time in 2025 when GBP/JPY was pushing above 213.00. Tensions in the Strait of Hormuz were a key factor then, creating significant headwinds for the energy-dependent Japanese economy. That fundamental weakness in the Yen ultimately proved correct, fueling the cross pair’s rally through the second half of that year.
The primary driver for Yen weakness remains the vast interest rate gap, a factor even more pronounced today. With the Bank of England holding rates at a firm 5.5% to manage inflation, the Bank of Japan’s recent move to just 0.1% offers little support for its currency. This differential continues to make holding long GBP/JPY positions attractive through carry trades.
Geopolitical risk, highlighted by the events in 2025, remains a critical vulnerability for the Yen. Japan’s reliance on Middle Eastern crude oil has not diminished, with recent METI data showing over 92% of its supply still transits the region. Any flare-up in tensions could therefore trigger a rapid sell-off in the Yen, mirroring the price action we saw last year.
Given the persistent upward trend, traders should view any pullbacks in GBP/JPY as opportunities to position for further gains. Buying call options or implementing bull call spreads could be an effective way to capitalize on the upside while defining risk. These strategies would benefit from both a gradual grind higher driven by rate differentials and any sudden spike in volatility from geopolitical news.
Brent crude is trading near USD 96 per barrel after sharp intraday moves linked to Middle East news. It almost reached USD 100, then fell below USD 95 following Israel–Lebanon reports, before rising again to about USD 96–97.
Brent crude futures were priced at USD 96/bbl at the time of writing. Market pricing also reflects a higher risk premium linked to the region.
Strait Of Hormuz Disruption
Ship traffic through the Strait of Hormuz remains heavily disrupted at less than 10% of normal levels, despite a US–Iran ceasefire. Iran is directing vessels to transit near Larak Island, citing mine risks.
Reports say Iran may introduce cryptocurrency transit tolls, with opposition reported from Western leaders and the International Maritime Organization. Peace talks between the US and Iran, mediated by the Pakistani prime minister, are due to start on Saturday, but disagreements over the agenda persist.
Tensions also remain over whether the ceasefire should cover Lebanon, following Israel’s deadly attacks there on Wednesday. The article notes it was produced using an AI tool and reviewed by an editor.
With Brent crude currently trading more calmly around $85 a barrel, we are reminded of the extreme volatility in 2025. Last year’s intraday swings between $95 and $100 showed how sensitive prices are to Middle East headlines. This past instability suggests traders should remain positioned for sudden supply-side shocks.
Positioning And Volatility Strategies
The paralysis of the Strait of Hormuz in 2025, which saw traffic fall below 10% of the normal 21 million barrels per day, is a critical historical lesson. That event demonstrated how quickly geopolitical risk gets priced into options, causing implied volatility to surge. We should therefore watch for any naval buildups or diplomatic friction in the region as a leading indicator.
In the coming weeks, we should consider strategies that profit from price movement itself, not just direction. During the 2025 crisis, the oil volatility index (OVX) soared above 60, levels not seen since early 2022, rewarding holders of long straddles. With the OVX now sitting near a calmer 35, such positions could be a relatively cheap hedge against a repeat event.
The failed US-Iran talks last year served as a clear trigger for bullish call-buying strategies. We must be ready to deploy similar tactics if diplomatic channels appear to fray once more. Conversely, any unexpected progress on sanctions or maritime security would be a signal to protect against a sharp price drop with put options.
We must also factor in OPEC+ behavior, which was a secondary factor during the 2025 scare. The cartel’s spare capacity, estimated today at around 3.5 million barrels per day, is our main buffer against a price spike. Any statements from key members suggesting an unwillingness to use this buffer would be a strong bullish signal for front-month futures contracts.
UOB’s economists said GBP/USD remains positive in the short term after moving above 1.3450. They said the Pound could move towards 1.3520, but only if it records a daily close above 1.3480.
They noted that GBP reached 1.3485 before pulling back. They also said the short-term rally had looked overdone when spot was 1.3400 on 08 Apr, and later reiterated the need for a close above 1.3480 when spot was 1.3390 on 09 Apr.
Short Term Technical View
They raised the “strong support” level to 1.3330 from 1.3280. They said the chance of a close above 1.3480 remains as long as support holds.
For intraday trade, they expected a range of 1.3390 to 1.3465. The article stated it was created using an AI tool and reviewed by an editor.
This time last year, in April 2025, we saw a cautiously positive short-term outlook for GBP/USD. We were looking for a daily close above 1.3480 to confirm a potential move toward 1.3520. The strong support level had just been raised to 1.3330, indicating a fragile but present upward bias.
Fast forward to today, April 10, 2026, and the environment is entirely different, with the pair trading much lower around 1.2550. This significant decline over the past year reflects diverging economic paths between the UK and the US. The Federal Reserve has maintained a more hawkish stance than the Bank of England, strengthening the dollar.
Options Positioning Outlook
Recent statistics support the current weakness in the pound. The latest data from the Office for National Statistics (ONS) shows UK inflation, while falling, remains sticky at 3.1%, complicating the Bank of England’s decision-making on rate cuts. In contrast, US inflation has shown more consistent signs of cooling to 2.8%, giving the Fed less immediate pressure to ease policy.
For derivative traders, this suggests a bearish to neutral outlook in the coming weeks. Buying put options with strike prices below the 1.2500 psychological level could be a prudent way to position for a potential break lower, especially with UK GDP growth forecasts for 2026 revised down to a sluggish 0.5%. This strategy offers a defined risk if the pound unexpectedly rallies.
Alternatively, for those who believe the pair will stagnate as markets await clearer signals, selling out-of-the-money call options above the 1.2700 resistance level could generate income. This strategy profits from time decay if the pound fails to gather any significant upward momentum. The CBOE British Pound Volatility Index (BPVIX) remains moderately elevated, suggesting that option sellers can still collect a reasonable premium for taking on this risk.
Canada released March jobs data, with a forecast payroll rise of 15k after a fall of 83k in February. The unemployment rate is treated as a clearer guide than month-to-month payroll changes.
Markets are pricing about 40bp of Bank of Canada tightening by December. Expectations for further rate rises are limited, and near-term risks for Canadian Dollar front-end rates are tilted towards a more dovish outcome.
Attention may shift to USMCA renegotiations, which could weigh on Canada’s activity and jobs. USD/CAD has been driven by war-related news, and further de-escalation could see the pair move towards 1.3700.
The article was produced using an AI tool and checked by an editor.
Looking back at early 2025, we noted that markets were pricing in about 40 basis points of tightening from the Bank of Canada, which seemed too aggressive. Our view was that the unemployment rate, not volatile monthly job figures, was the key signal for the central bank. This dovish outlook on Canadian front-end rates suggested a weaker Canadian dollar was likely.
That perspective from last year has proven correct, as the Bank of Canada has since shifted to a neutral stance. The focus remains on labor market slack, and with Statistics Canada’s latest report showing the national unemployment rate ticking up to 5.9% in March 2026, the case for rate hikes is gone. Markets are now beginning to price in the possibility of a rate cut by the end of the third quarter.
This contrasts sharply with the situation in the United States, where recent inflation data came in at 3.4%, keeping the Federal Reserve on hold for the foreseeable future. This growing policy divergence between a potentially cutting BoC and a steady Fed puts upward pressure on the USD/CAD exchange rate. As of this week, the pair is trading around the 1.3650 level.
For derivative traders, this environment suggests positioning for further Canadian dollar weakness against the US dollar. We see value in buying USD/CAD call options with strike prices around 1.3750 and 1.3800, expiring in the next two to three months. This strategy allows for participation in further upside while capping potential losses if the trend reverses unexpectedly.
The ongoing USMCA renegotiations, which we flagged as a risk back in 2025, remain a background concern for Canadian economic activity. Any negative headlines from these trade talks could act as another catalyst for a weaker Canadian dollar. Therefore, holding positions that benefit from a higher USD/CAD continues to be a sound strategy.
Written on April 10, 2026 at 10:49 am, by josephine
Asian shares rose after a Wall Street rally, helped by lower oil prices following the US–Iran ceasefire. Japan’s Nikkei 225 was up 1.85% near 56,900, Hong Kong’s Hang Seng Index rose 0.64% near 25,900, China’s SSE Composite gained 0.77% near 4,000, and South Korea’s Kospi added 1.55% near 5,870.
Markets remained cautious due to uncertainty over how long the ceasefire will last. Expected US–Iran talks in Islamabad this weekend were still unconfirmed, with no official confirmation of delegates’ arrival on Friday.
Geopolitical Uncertainty And Market Implications
Israel continued strikes on Hezbollah despite plans for direct negotiations with Lebanon. US President Donald Trump said US forces would stay deployed around Iran until full compliance with the agreement is achieved.
In Japan, expectations grew that the Bank of Japan could raise rates in April. The 10-year government bond yield was near 2.4% on Friday, close to its highest level since 1998.
In China, March CPI rose 1% year on year, down from 1.3% in February and below the 1.2% consensus, while CPI fell 0.7% month on month after a prior 1.0% rise. PPI rose 0.5% year on year, rebounding from a 0.9% decline and marking the first increase since September 2022.
Looking back at the situation in April 2025, we saw a market rally built on the fragile hope of a US-Iran ceasefire. This optimism should be treated with caution, as the underlying geopolitical tensions remain high and diplomatic talks are not guaranteed. We should therefore consider using derivatives to hedge against a sudden reversal, such as buying put options on equity indices like the Nikkei 225 or Hang Seng.
Derivatives Hedging And Volatility Positioning
The sharp drop in oil prices is the main driver, but its stability is questionable, much like the price swings we saw during the Red Sea shipping disruptions in late 2023 and early 2024. Volatility in the energy sector is almost certain, making options strategies like straddles on oil ETFs a logical play. This position profits from a large price move in either direction, which is likely whether the ceasefire holds or abruptly fails.
The expectation that the Bank of Japan might raise interest rates is a significant development, echoing the historic end to negative interest rates we witnessed in March 2024. That move ultimately strengthened the yen, and we should anticipate a similar pattern. Positioning for a stronger yen through currency futures or call options against the US dollar seems like a prudent move.
In China, the conflicting data from March 2025, with weak consumer prices but rising factory gate prices, points to an uneven economic recovery. This pattern of inconsistent growth was a persistent theme throughout 2023 and 2024, often leading to market disappointment. Therefore, any rally in Chinese stocks may be short-lived, presenting an opportunity to buy put options on China-focused ETFs.
Emini S&P June futures formed an inverse head and shoulders pattern and reached the 100-day moving average target at 6,825. Minor resistance at 6,825/6,835 was cleared, setting a further target at 6,885/6,890, with minor resistance at 6,880 to 6,900.
Minor support is at 6,805/6,800, while a break below 6,790 could lead to 6,765/6,755 and stop levels for long positions are below 6,740. A break above 6,900 could lead to 6,925 and then 6,960/6,970.
Nasdaq Futures Key Levels
Emini Nasdaq June futures completed an inverse head and shoulders pattern and rose to 25,250/25,300. Support was retested at 25,030/25,000, with a rebound from 24,953; a break above 25,350 could target 25,600/25,630, while a break below 24,900 could lead to 24,800/24,750, with stops below 24,600.
Emini Dow Jones June futures broke above 48,100 to target 48,400/48,500, which was reached. A move above 48,600 could target 48,850/48,900; support is at 48,100/48,000, while a break below 47,900 could open 47,800/47,700, with stops below 47,550.
Jason Sen started on the LIFFE options trading floor in 1987 aged 19. In 2001, after the floor closed, he moved to day trading on computer screens.
We see that Emini S&P futures have pushed through resistance to hit our 6,825 target and are now approaching 6,890. This rally is underpinned by the latest March Consumer Price Index data, which came in at a manageable 2.8%, calming fears of an aggressive central bank response. With the market in overbought territory before the weekend, we prefer waiting to buy a dip over attempting a short position.
The Nasdaq has shown similar strength, running up to the 25,250/300 resistance zone we highlighted. This follows the resilient performance of the technology sector we witnessed throughout 2025, which consistently bounced back from pullbacks. We will be watching for a break above 25,350 to confirm the next move higher, targeting 25,600.
Dow Futures Trade Plan
For the Dow Jones futures, the bullish pattern has also played out, achieving our 48,400/500 objective. Market sentiment appears stable, with the CBOE Volatility Index (VIX) currently holding near 14, which encourages buying on weakness. A firm break above 48,600 would serve as our trigger for a new long position, targeting the 48,900 area.
Our overall strategy for the coming weeks is to look for pullbacks to established support levels rather than trying to short this rally. This patient approach is supported by last week’s jobs report, which showed a solid but not overly hot gain of 195,000 new jobs for March. This suggests the economy is stable, not overheating, which is a constructive backdrop for equities.
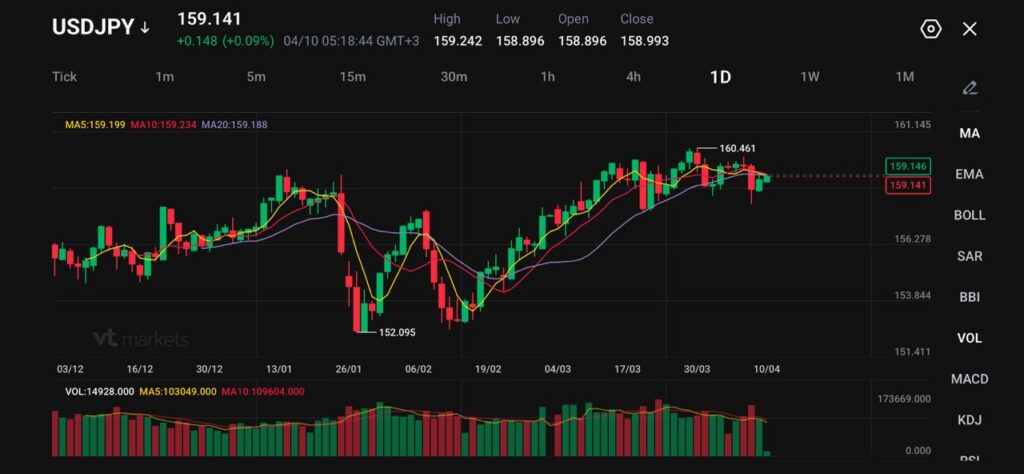
USDJPY trades at 159.141, up 0.148 (+0.09%), after a high of 159.242 and a low of 158.896.
The yen is still down about 2% since the conflict began, even after the ceasefire cooled oil and eased some stagflation pressure.
Markets remain focused on Kazuo Ueda and the April 28 BOJ decision, with traders still trying to judge whether the next move is a hike or another cautious hold.
The yen has stabilised rather than strengthened decisively. USDJPY is trading at 159.141, which shows that lower oil has helped, but only to a point.
The two-week ceasefire between the US and Iran cooled crude and reduced some of the pressure on Japan’s import bill, which gave the yen a bit of room to recover from the most stressed part of the move.
That relief has not turned into a clean reversal. The pair is still sitting close to the upper end of the recent range, and the market is still carrying the memory of the move toward 160.461. Traders are treating the ceasefire as temporary and conditional, not as a durable end to the energy shock.
A cautious near-term view still favours choppy trade in the upper 150s while the truce remains fragile.
Lower Oil Helps Japan, but the Damage Has Not Disappeared
The yen’s earlier weakness was tied directly to the energy shock. Japan imports most of its energy, so higher crude lifted import costs and worsened the growth-inflation mix. That is why the yen stayed weak even when safe-haven logic might normally have helped it.
The ceasefire has softened that problem, but it has not removed it. Shipping through Hormuz is still not fully normal, Israeli strikes on Lebanon continue to cloud regional sentiment, and the market still doubts how durable the current arrangement really is.
The drop in oil prices has reduced immediate stagflation fear, yet it has not fully repaired confidence in Japan’s external outlook.
That leaves the yen with partial support rather than a full macro tailwind.
BOJ Expectations Are Now the Main Domestic Driver
With the oil panic easing slightly, attention has shifted back to the Bank of Japan. Governor Kazuo Ueda has kept the tightening bias alive, but markets still do not know how forceful the next signal will be.
The Bank of Japan will probably increase its benchmark rate this month to avoid falling behind on controlling inflation, according to a former executive director at the central bank https://t.co/NHIRhR21ce
The BOJ left rates at 0.75% in March and said rising oil costs could feed underlying inflation, while officials have also stressed that financial conditions remain accommodative and real rates are still negative.
That creates a narrow and unstable balance. If the BOJ leans clearly toward another hike, the yen can find more support.
Japanese workers’ wages adjusted for inflation rose at the fastest pace since 2021, backing the case for the Bank of Japan to consider a rate hike as soon as this month https://t.co/CZFuzjiE8d
If Ueda stays cautious and emphasises the economic risks from the Middle East conflict, traders may conclude the BOJ wants more time, which would leave USDJPY vulnerable to another push higher.
Markets have already been pricing a meaningful chance of a move around the April 27–28 meeting window, so the risk is no longer just about direction. It is about whether the BOJ delivers the confidence traders expect.
USDJPY Technical Outlook
USDJPY is trading near 159.14, holding steady after pulling back from its recent high around the 160.46 level. Price action shows a pause in momentum following the prior rally, with the pair now consolidating in a tighter range just below key resistance.
The structure suggests buyers are still present, but upside momentum has cooled as the market digests gains near the upper boundary.
From a technical standpoint, the trend remains constructively bullish but softening in the near term. Price is hovering around the 5-day (159.19) and 10-day (159.23) moving averages, which are now flattening and offering immediate support.
The 20-day (159.18) sits just beneath, reinforcing a clustered support zone, while the broader structure continues to hold above the rising 30-day (157.18), keeping the underlying uptrend intact.
Key levels to watch:
Support: 159.00 → 158.40 → 157.20
Resistance: 159.90 → 160.50 → 161.10
The pair is currently consolidating just below the 159.90–160.00 resistance area. A clean break above this region would likely reopen the path toward 160.50, with scope for further upside if momentum builds.
On the downside, 159.00 is acting as immediate support. A break below this level could trigger a deeper pullback toward 158.40, though such a move would likely remain corrective unless the broader trend structure weakens.
Overall, USDJPY is in a controlled consolidation within an uptrend, with price holding above key moving averages. The next directional move will likely hinge on whether buyers can reclaim the 160.00 level or if sellers push the pair into a deeper retracement.
What Traders Should Watch Next
The next move depends on three linked drivers: whether the ceasefire holds, whether oil stays off the highs, and whether Ueda sharpens or softens the BOJ’s pre-meeting message. If crude stays lower and BOJ language firms up, the yen can extend its recovery.
If the truce weakens or the BOJ hesitates, USDJPY may stay pinned near the highs and start leaning back toward 160.
Why Is USDJPY Holding Near 159 Instead Of Falling More Sharply?
Lower oil prices have taken some pressure off Japan’s import bill, but the yen is still dealing with Bank of Japan uncertainty and a ceasefire that markets view as fragile rather than permanent. That has kept USDJPY close to 159.14 instead of driving a deeper drop.
How Did The US-Iran Ceasefire Help The Yen?
The ceasefire triggered a sharp fall in oil and reduced near-term stagflation fears. Japan is highly exposed to imported energy costs, so any cooling in crude usually gives the yen some relief.
Why Has The Yen Still Fallen About 2% Since The Conflict Began?
The broader move still reflects the damage from the earlier oil shock. Higher fuel costs worsened Japan’s growth-inflation mix and weakened the yen even when risk aversion was high. The current pullback in USDJPY has only recovered part of that move.
What Are Markets Expecting From The BOJ Now?
The BOJ kept rates at 0.75% in March, but markets have continued to price a meaningful chance of another move around the late-April meeting. The uncertainty is no longer just about whether the BOJ can hike, but whether Kazuo Ueda will signal that clearly enough before the decision.
Why Does BOJ Guidance Matter So Much For USDJPY?
USDJPY is sitting close to a crowded level, so even small shifts in BOJ language can move expectations quickly. A clearer tightening message would support the yen, while another cautious hold-or-wait tone could leave the pair leaning back toward 160.
Start trading now – Click here to create your real VT Markets account
Written on April 10, 2026 at 10:14 am, by josephine