Daily Market Analysis
Market Focus
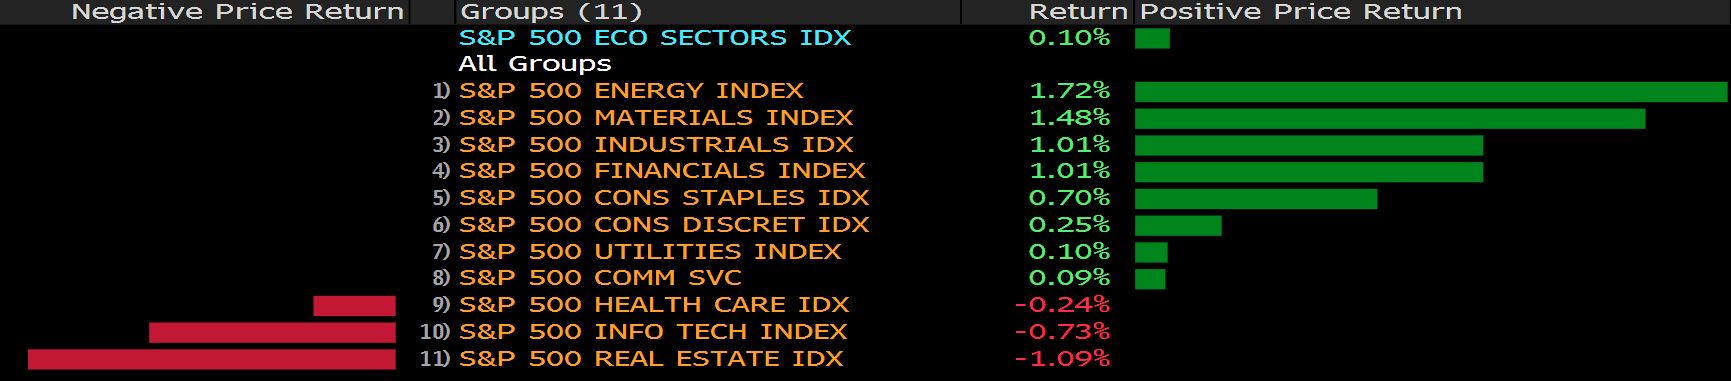
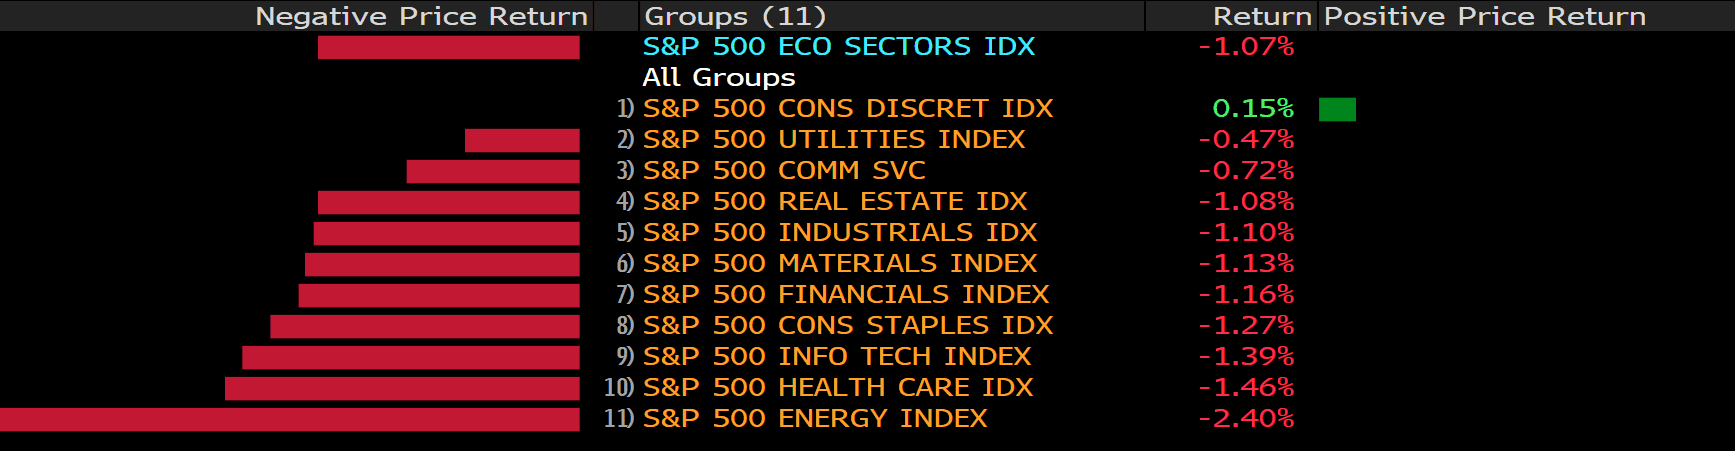
Stocks slid as the Federal Reserve signaled that a decision on a reduction of its bond-buying program could happen in 2021. Treasuries and the dollar were little changed.
The S&P 500 extended losses into a second day after minutes of the Federal Open Market Committee’s July gathering said most officials agreed last month they could start slowing the pace of asset purchases later this year. While the record shows they don’t yet have agreement on the timing or pace of tapering, most had reached consensus on keeping the composition of any reduction in Treasury and mortgage-backed securities purchases proportional.
Fed Chair Jerome Powell will have an opportunity next week to delve into the policy and economic outlook, during the Jackson Hole symposium — the central bank’s most prominent annual conference.
Earlier Wednesday, St. Louis Fed President James Bullard said he would like to see the tapering of the asset-purchase program done by the first quarter of 2022. Several other officials, including Robert Kaplan of Dallas and Esther George of Kansas City, have urged the central bank to begin removing stimulus as soon as the September meeting. Chair Powell and Vice Chairman Richard Clarida have suggested they would like to see further progress before considering a move to taper.
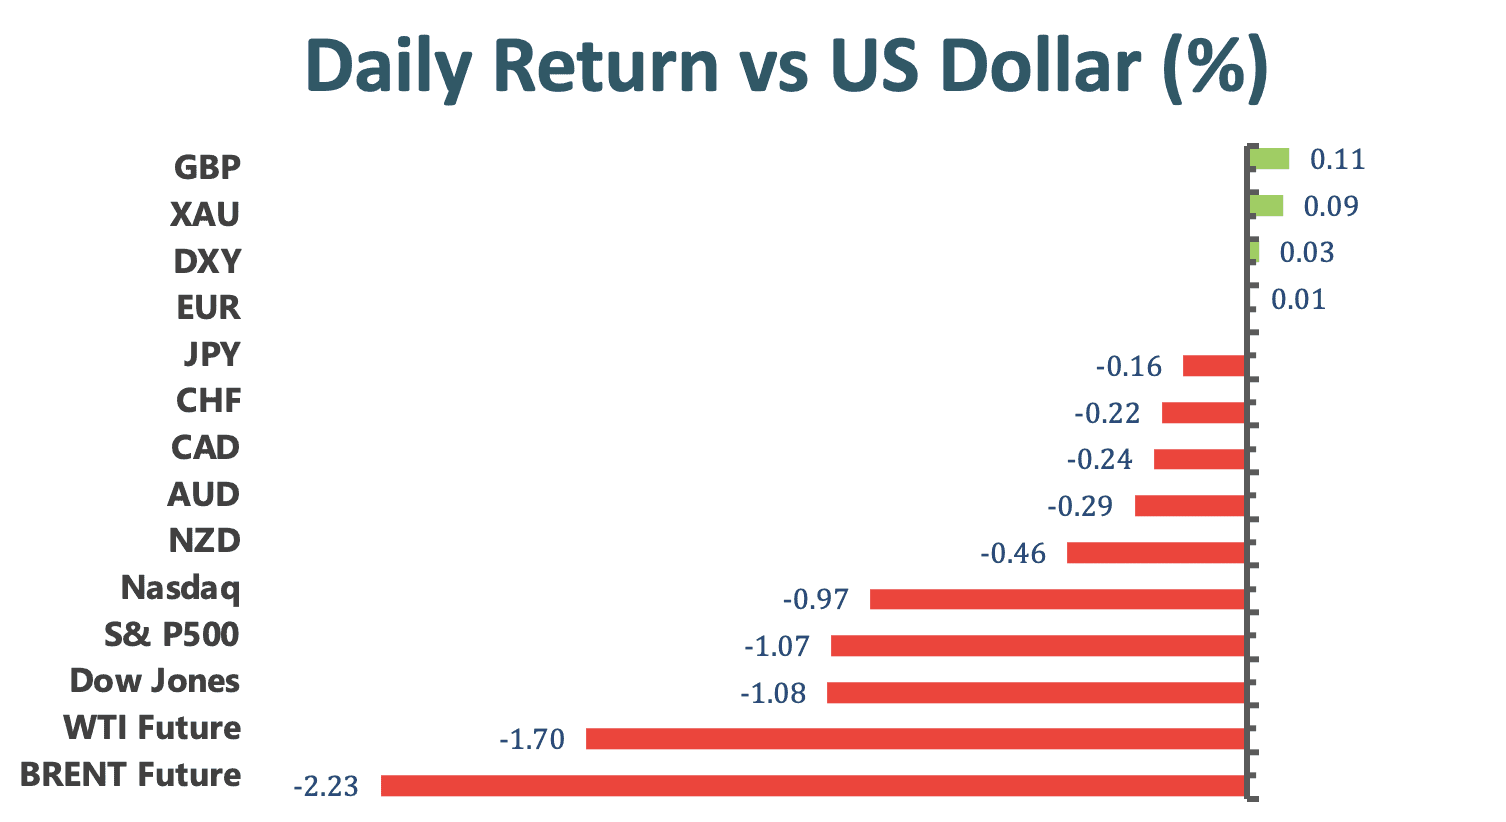
Main Pairs Movement:
The US Dollar fell sharply right after the release of FOMC meeting minutes, but then the greenback rebounded, hovering around 93.13 as time of writing. The FOMC minutes did note that conditions would likely warrant a reduction in the pace of asset purchases in coming months, but cautious language remains. The Federal Reserve indicated that they are in no rush of bond tapering.
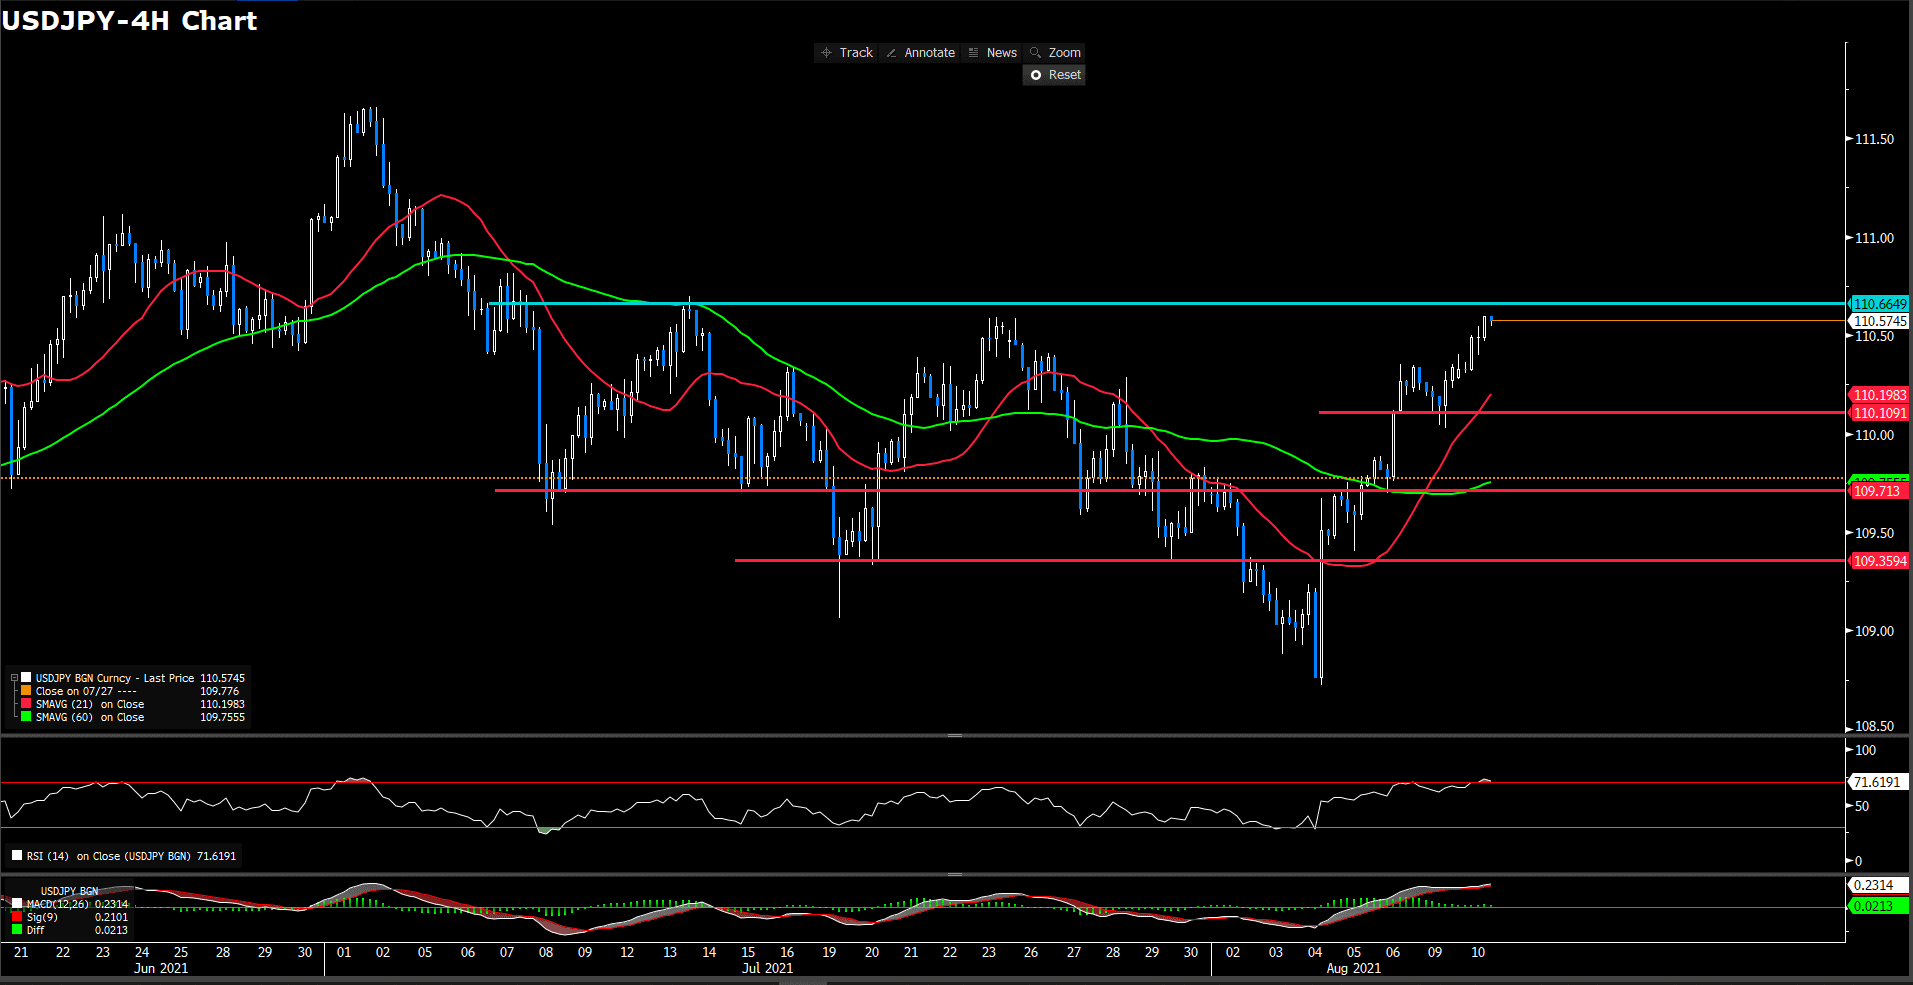
The USD/JPY pair climbed to a weekly high of 110.065 during US trading hours but then dipped lower after the FOMC meeting minutes released.
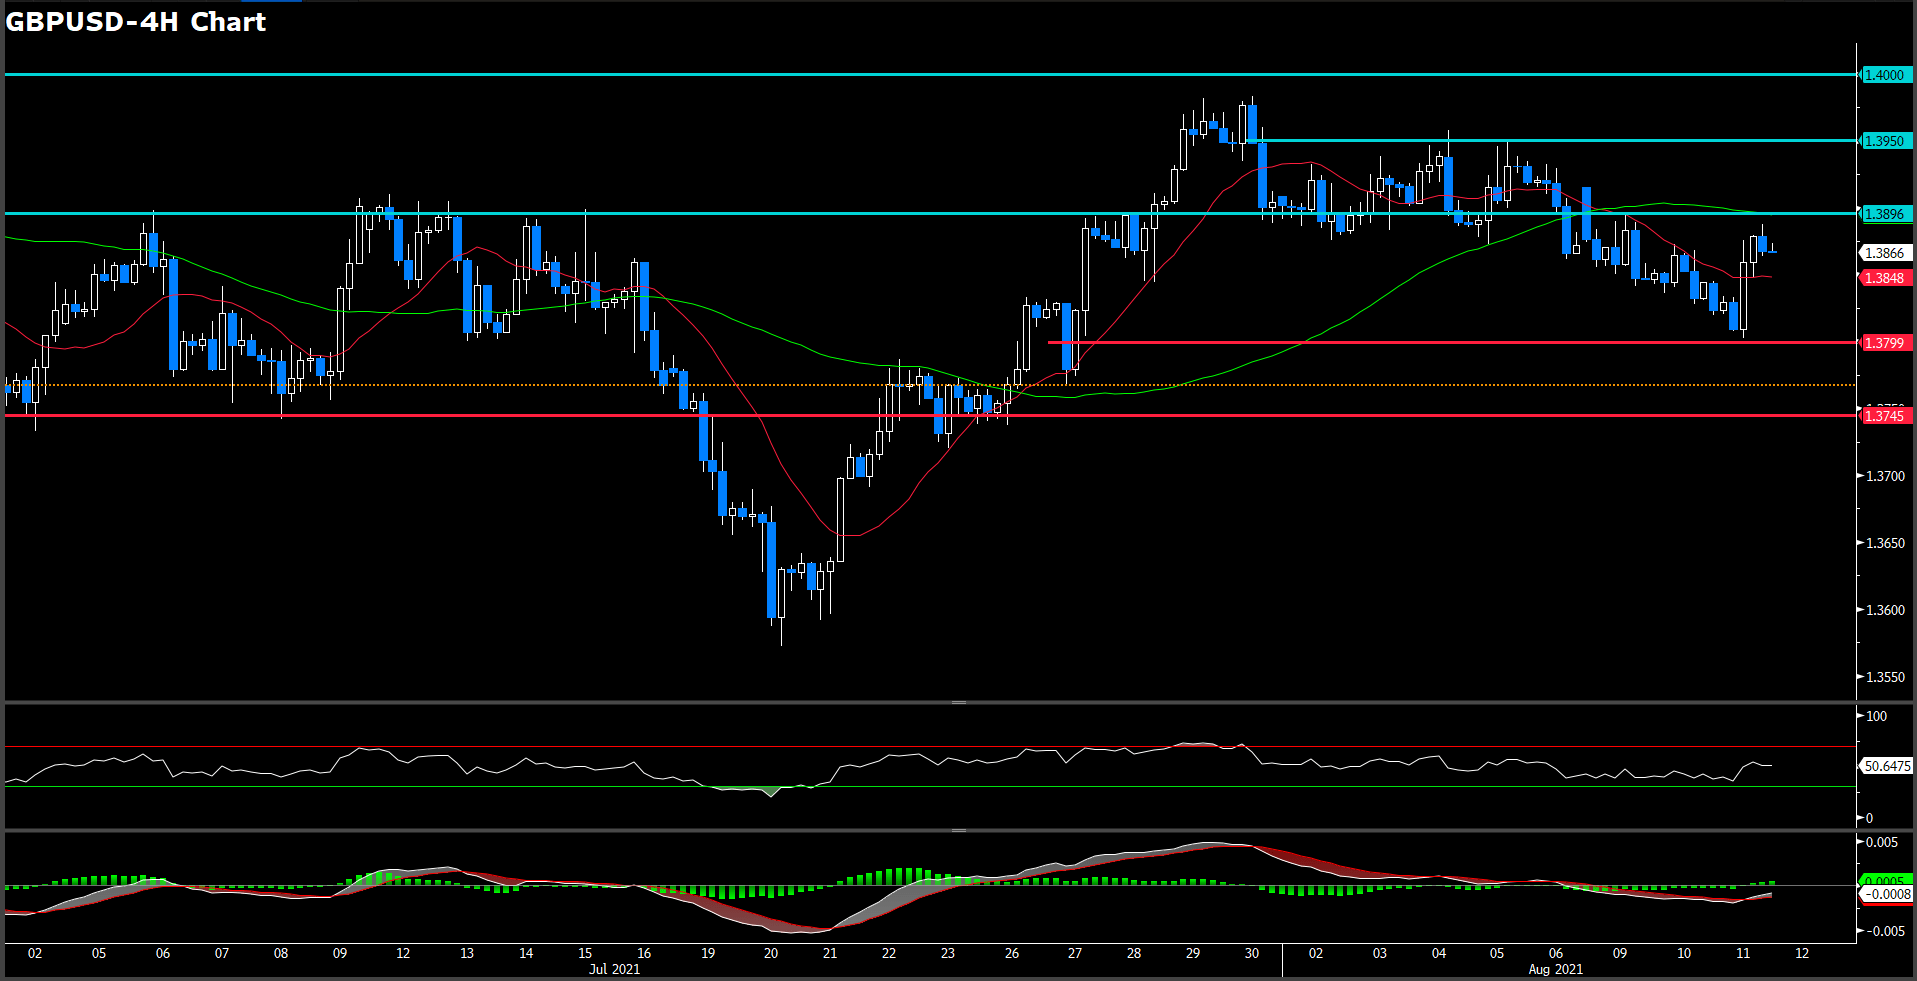
EUR/USD reaches daily high at 1.1742 after FOMC meeting minutes released, then retraced towards 1.1700. As time of writing, the GBP/USD pair is moving sideways and leaning on 1.3755 after advancing to a daily high of 1.3785.
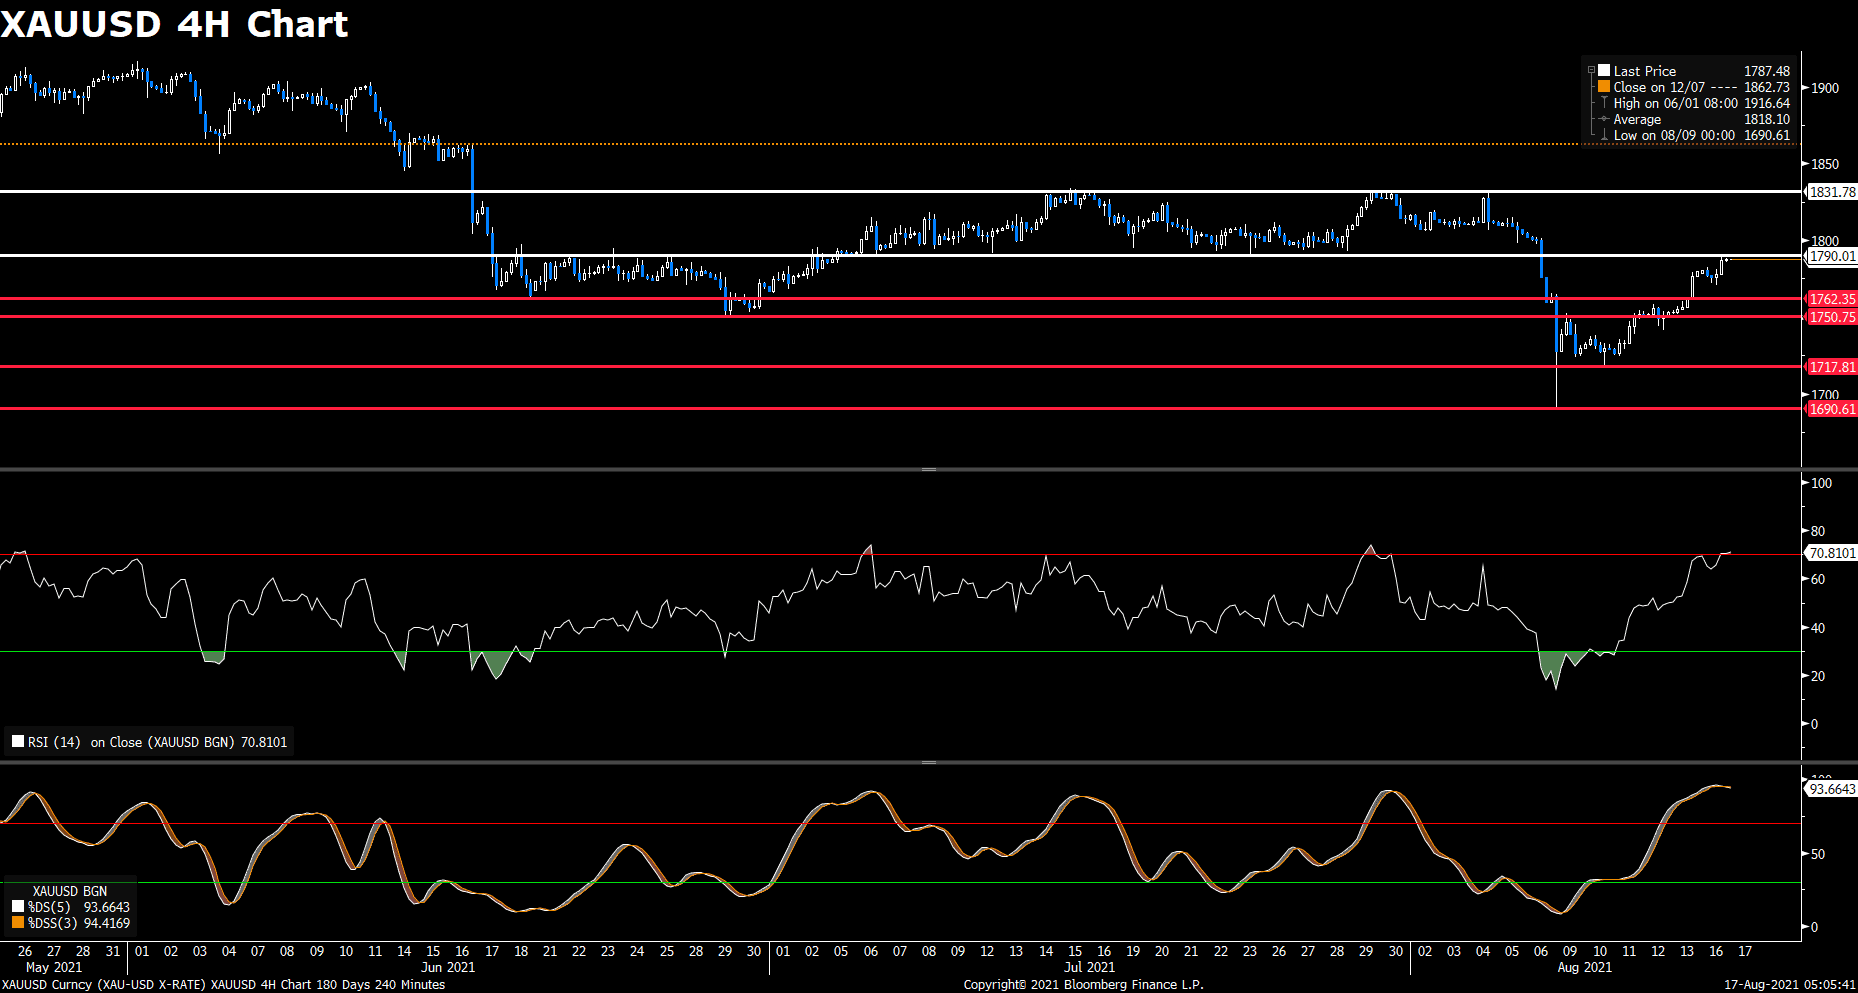
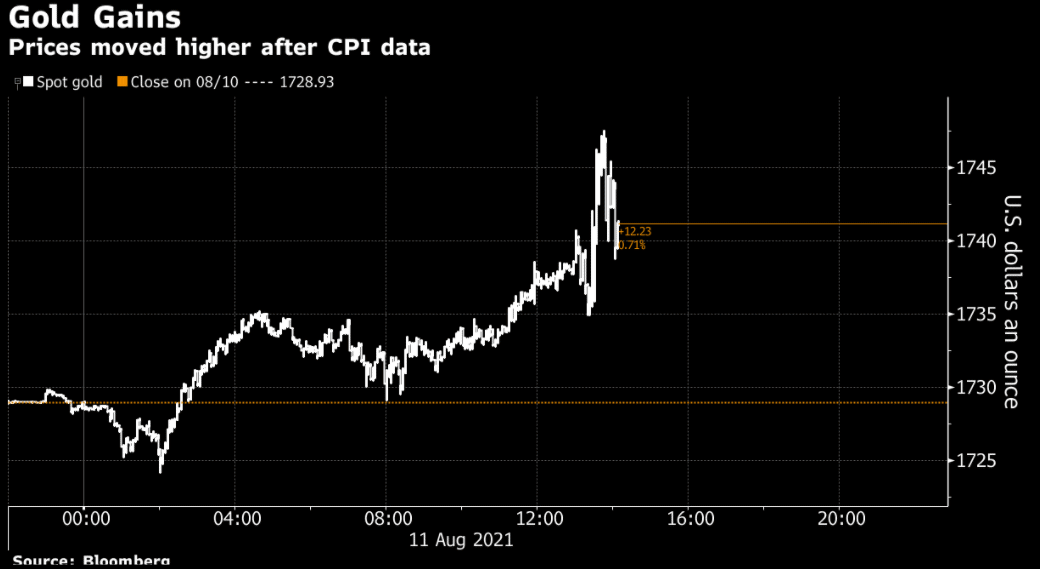
Gold edged lower after advancing to $1,790.47, ending the day in the red at around $1,787.32. Crude oil prices also fell on Wednesday, as the coronavirus remains a concern for the outlook for the energy complex amidst a strong US dollar.
Technical Analysis:
AUDUSD (4-hour Chart)
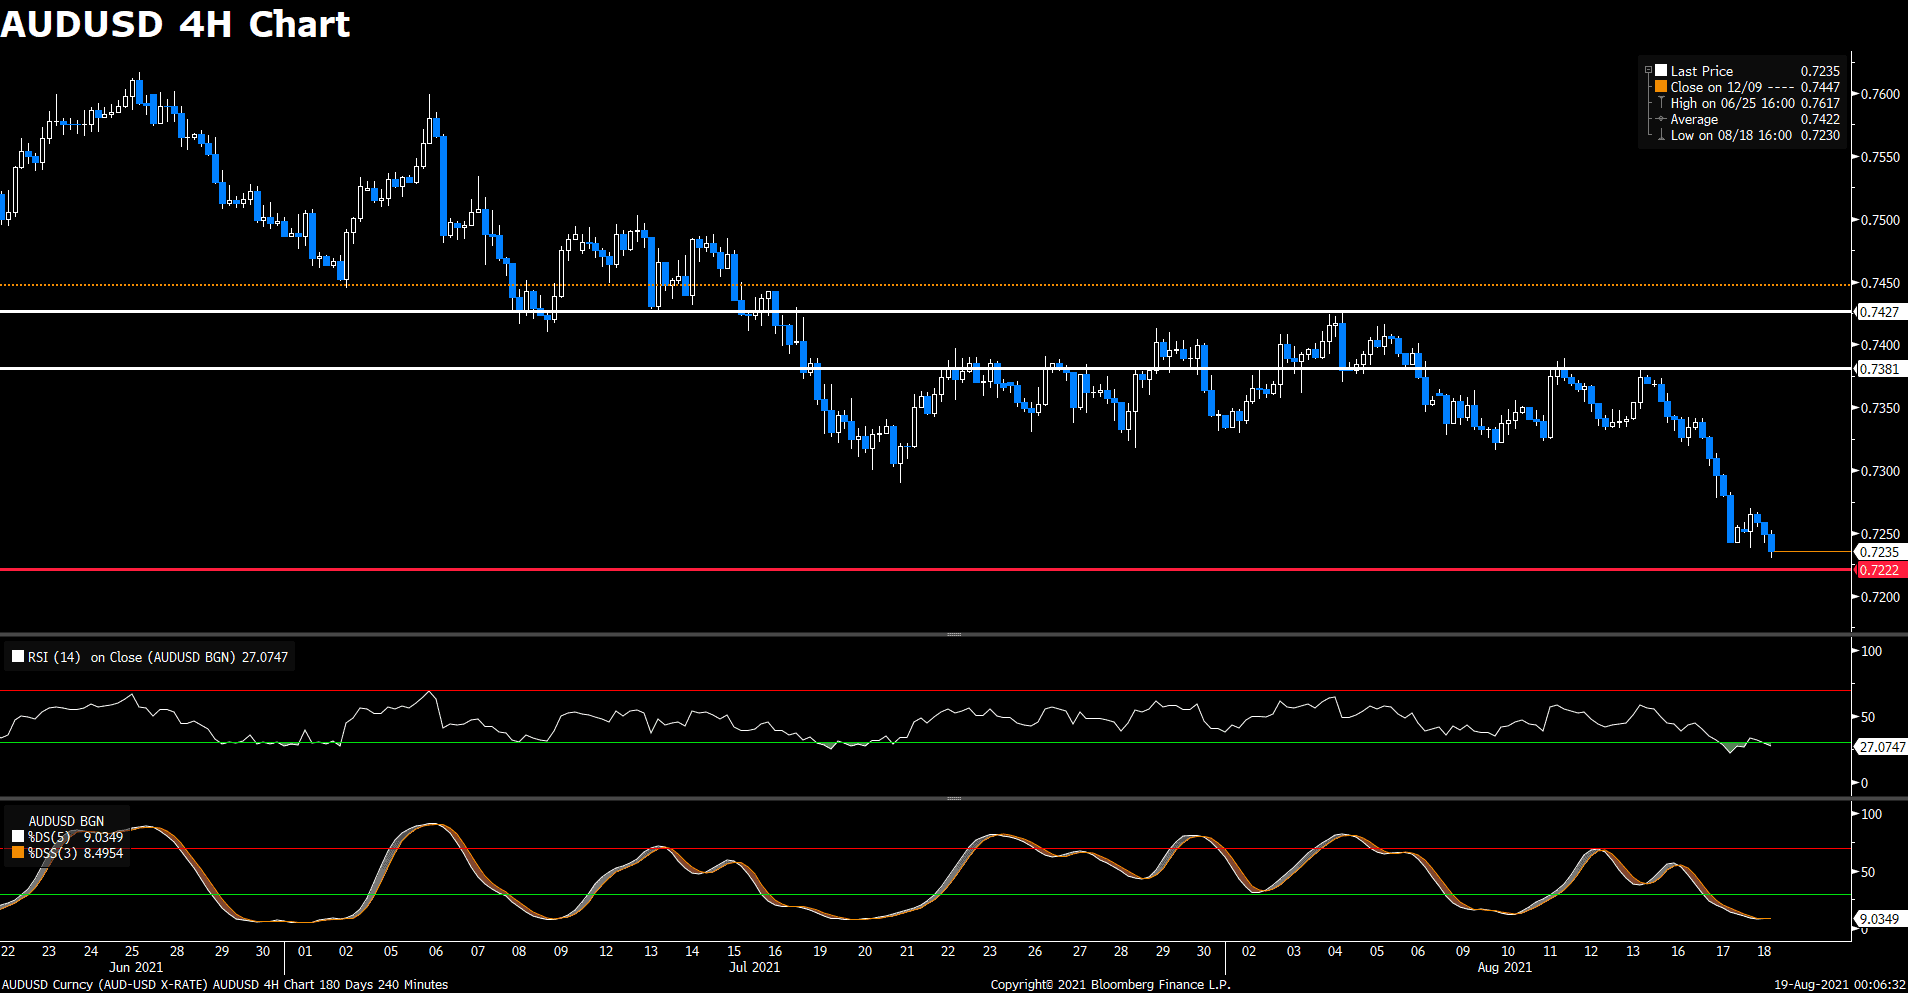
The AUD/USD pair touched its lowest level since November 2020 at 0.7231 on Wednesday as it extends the decline following the Reserve Bank of Australia (RBA) Minutes released this Tuesday. AUD/USD remains under pressure as the RBA Minutes warns that the current virus outbreaks and lockdowns had interrupted the recovery, and the exchange rate may face a further decline ahead of the Jackson Hole Symposium scheduled for August 26 to 28 amid the diverging paths for monetary policy.
For technical aspect, RSI indicator 26 figures as of writing, suggesting the market is oversold now, the downward trend may reverse in the near future. If we take a look at Stochastic Oscillator, the fast line lied under 20 level which shows that the market is in a weak position.
In conclusion, we think market will be bearish, and chances are high that the downward trend will maintain. AUD/USD may continue to drop, and the update to Australia’s employment report on Wednesday may keep the exchange rate under pressure as job growth is expected to contract for the second time this year.
Resistance: 0.7381, 0.7427
Support: 0.7222
EURUSD (4- Hour Chart)
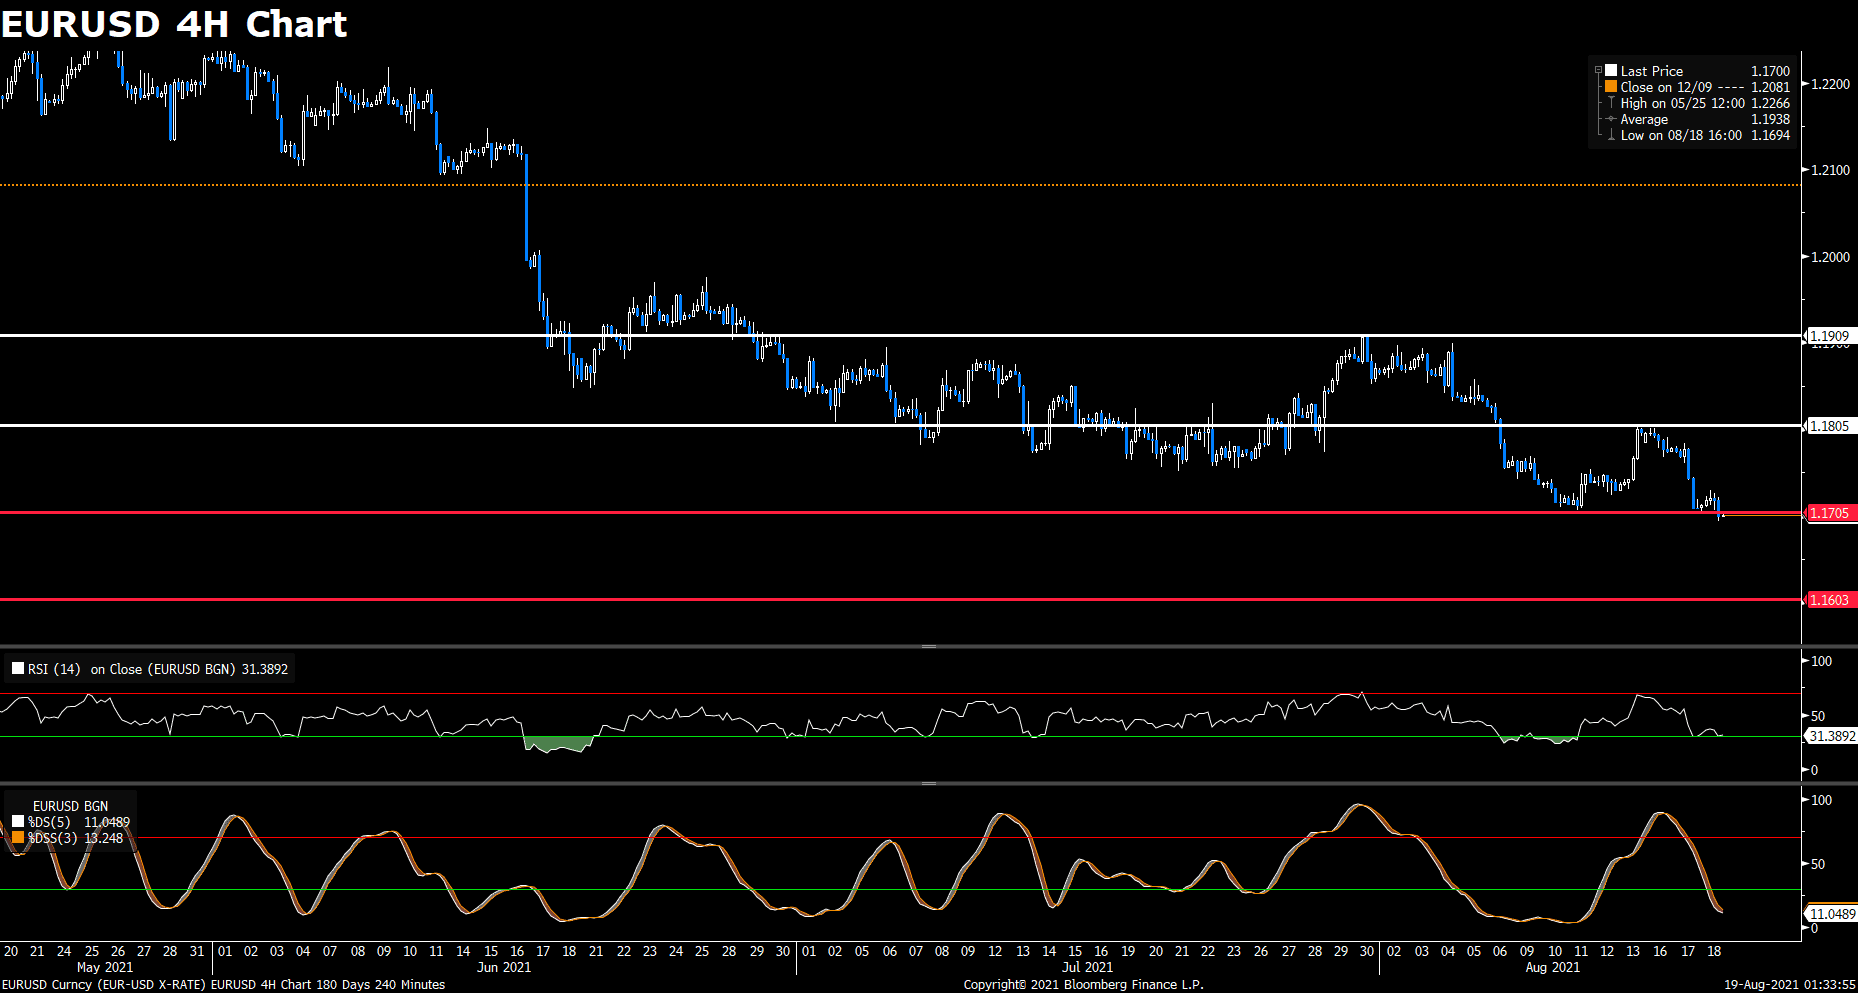
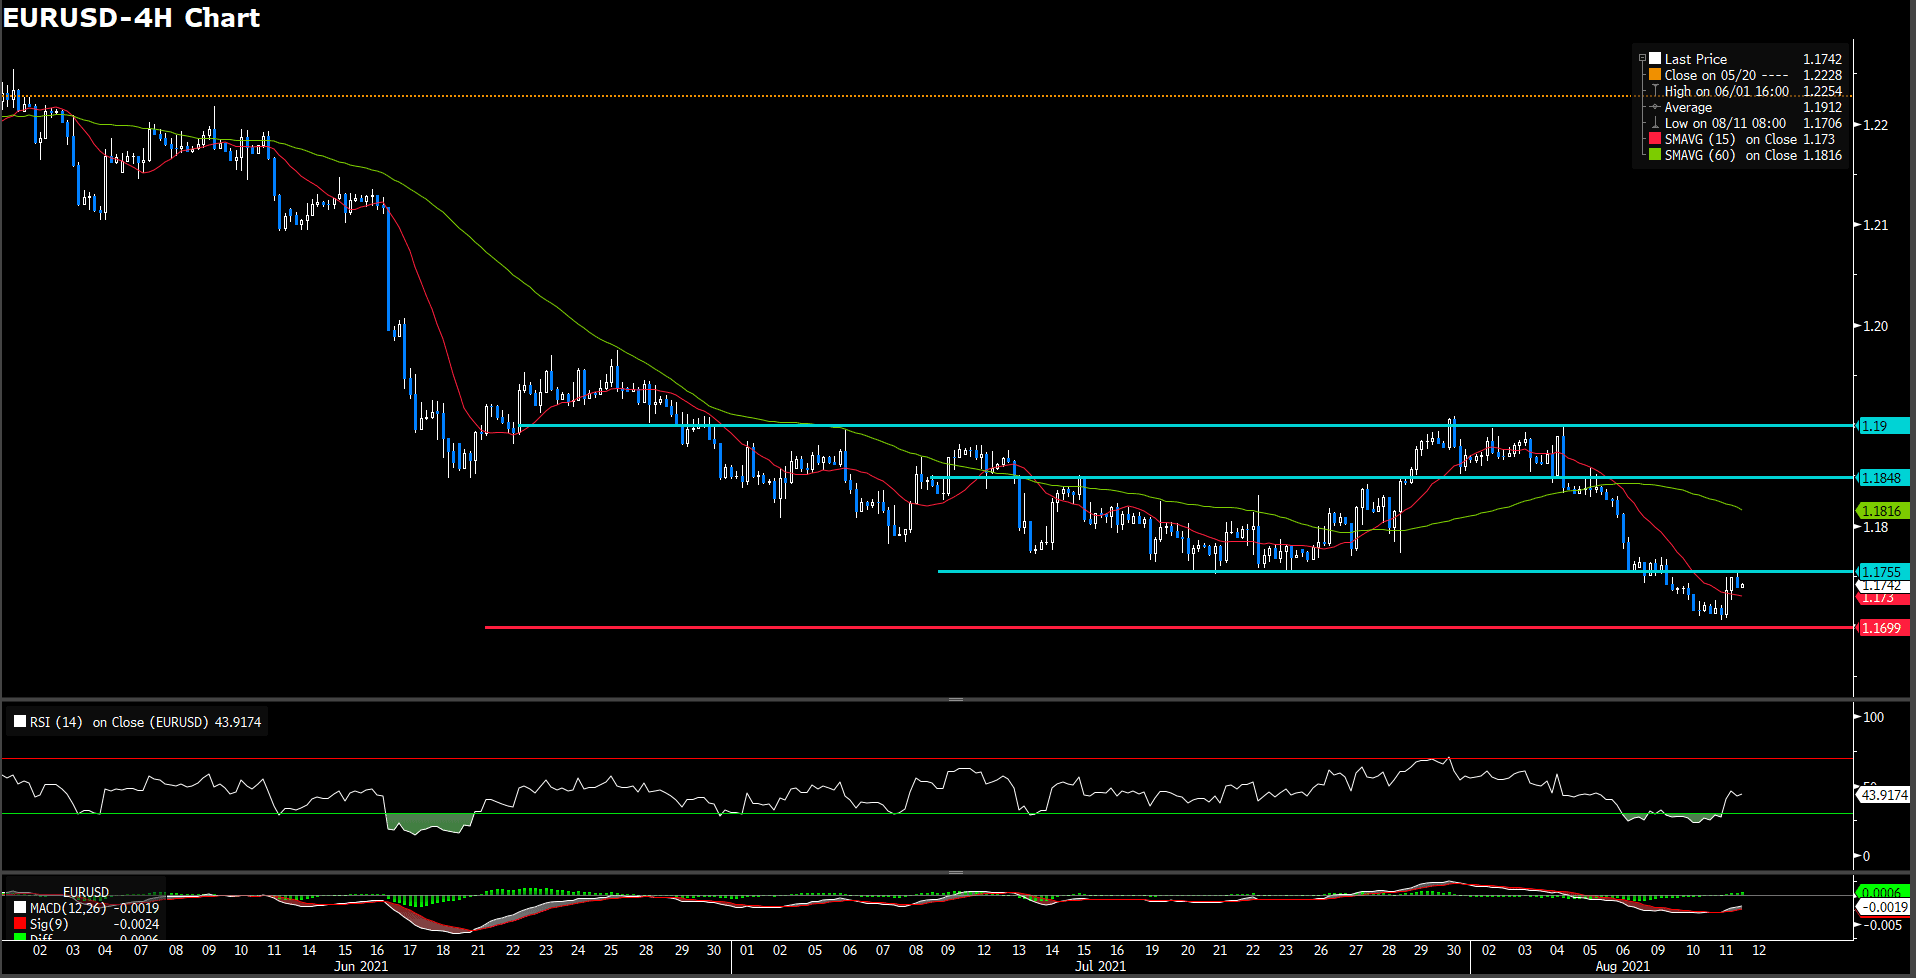
EUR/USD extended the decline and fell to 1.1693, reaching the lowest level since November 2020, as the pair falls for the third consecutive day after a brief recovery. It remains under pressure hovering around 1.1700. As for the US dollar, despite the weaker retail sales reported earlier in the week, the US Dollar picked up some defensive momentum, which put extended pressure on EUR/USD.
For technical aspect, RSI indicator 32 figures as of writing, suggesting bear-movement ahead. If we take a look at Stochastic Oscillator, the fast line lied below 20 level which shows that the market is in a weak position.
In conclusion, we think market will be bearish since the pair has already broken the 1.170 support line. The downward trend may persist for a while, and the next support should be 1.160, which was key at stopping bears bringing the pair lower back in November 2020. Traders should await the outcome of the FOMC minutes released this Wednesday, and search for clues about a tapering timeline for the purchase program which may trigger sharp moves.
Resistance: 1.1805, 1.1909
Support: 1.1705, 1.1603
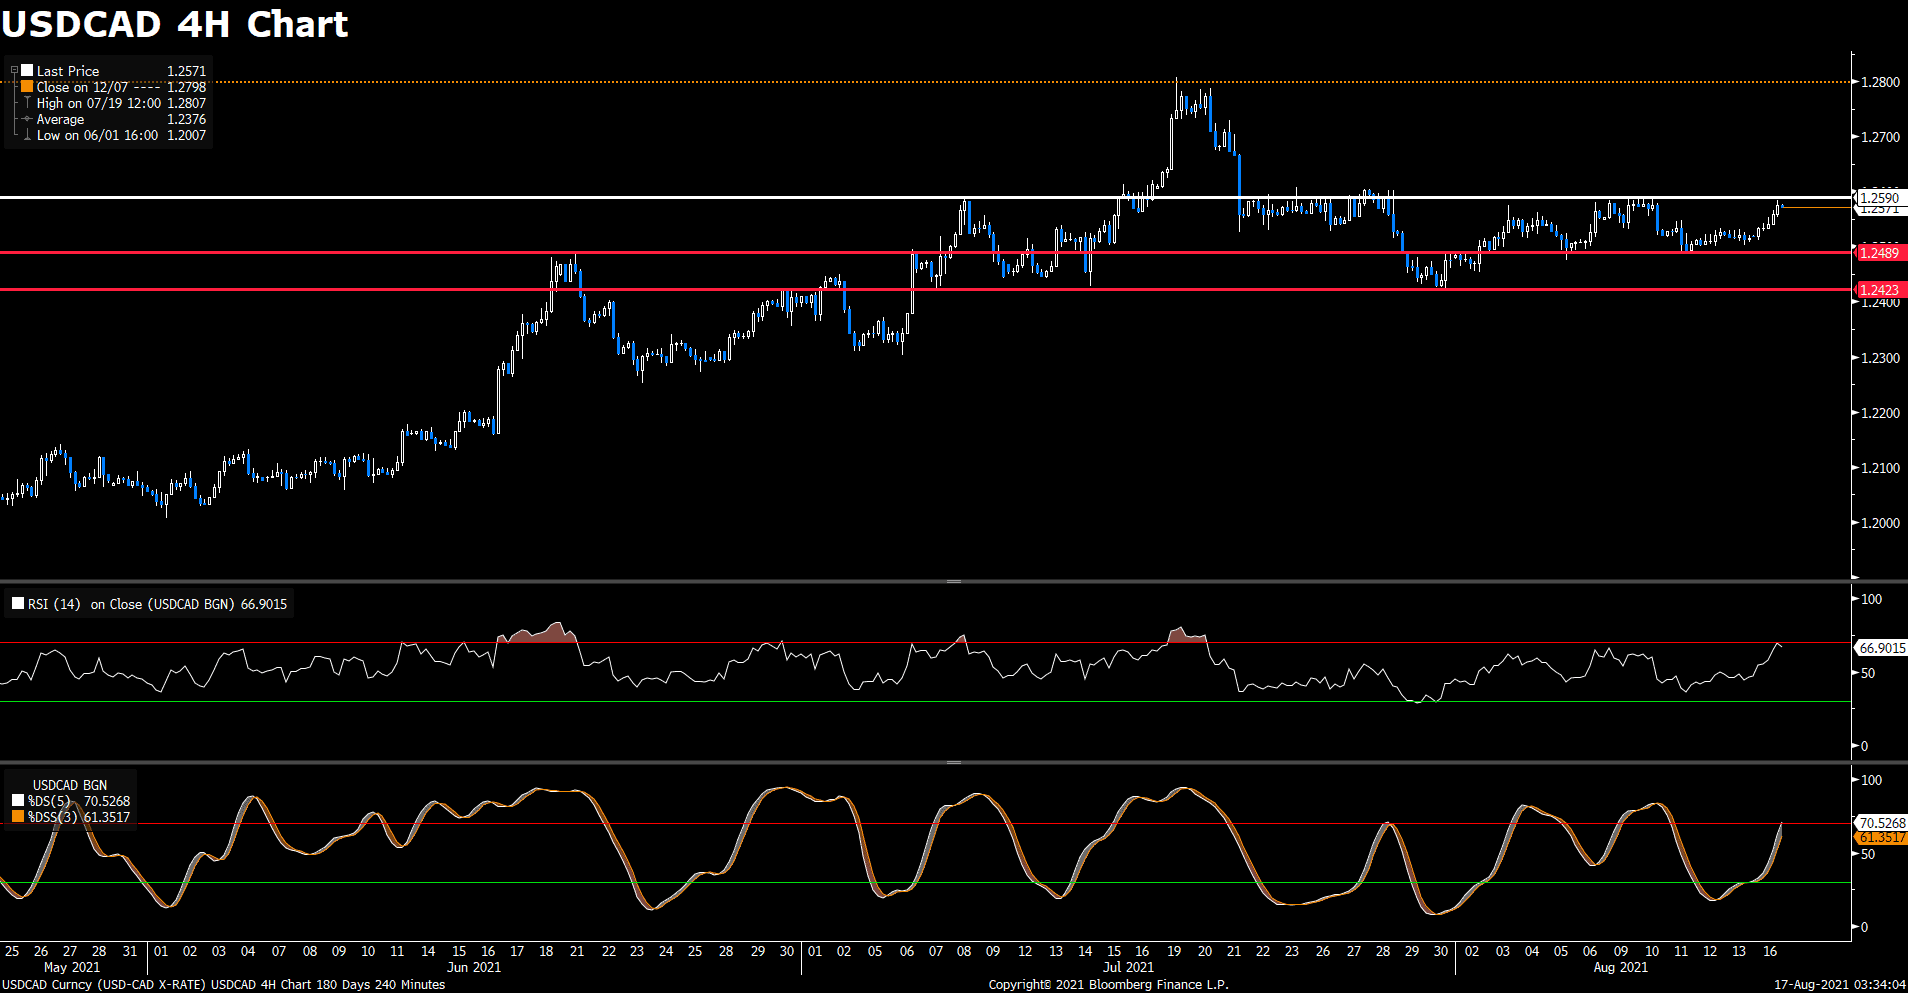
USDCAD (4- Hour Chart)
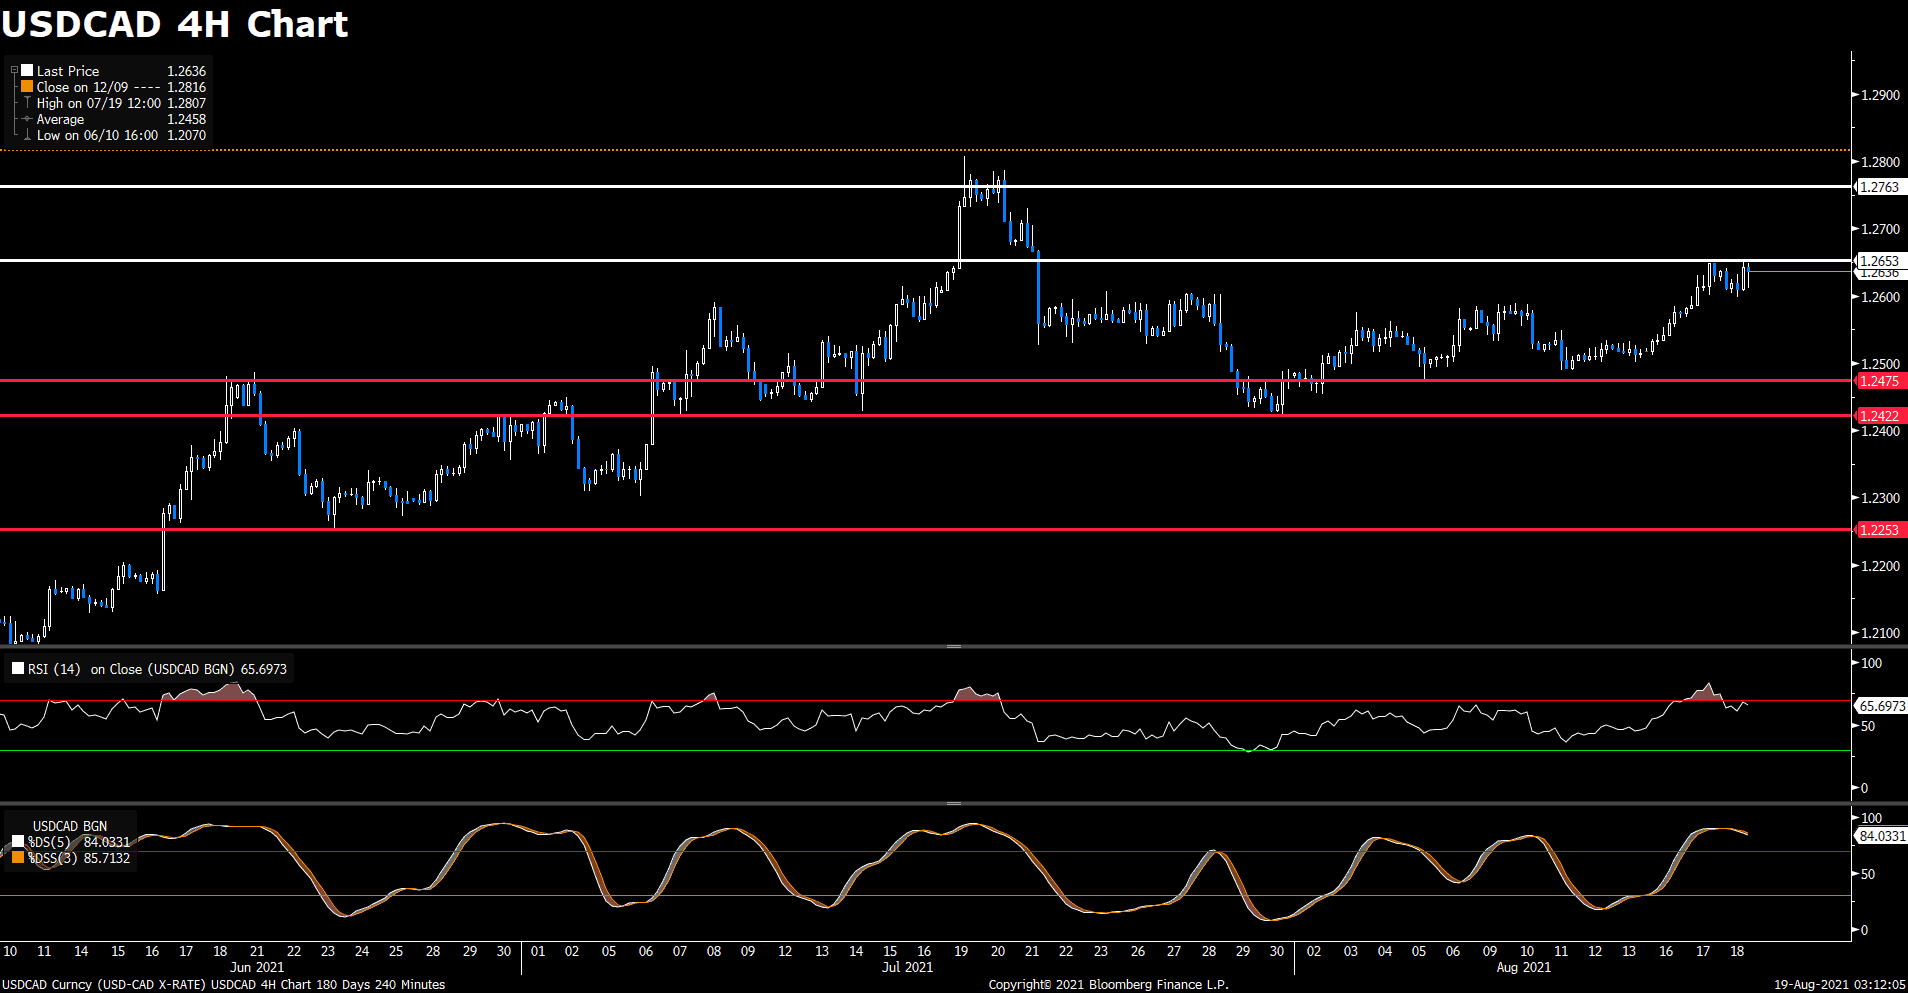
The USD/CAD pair reaches a monthly high at 1.2653 at the time of writing. As the price trades above yesterday’s high, this could open the door for a move towards 1.2800. After the Canada Core Consumer Price Index released this Tuesday, the price of USD/CAD reached a low of 1.2600 on an inflation rise in Canada, inflation hits 3.3% from 2.7% in the month of June. The base scenario for bond tapering in Canada remains on the table.
For technical aspect, RSI indicator 65 figures as of writing, suggesting bear-movement ahead. If we take a look at Stochastic Oscillator, the fast line lied above 80 level which shows that the market is in a strong position, the pair is overbought now and chances are high that it will continue to go up.
In conclusion, we think market will be bullish as long as the 1.2653 resistance line holds. Although the US dollar started to weaken against its major rivals after minutes of the FOMC’s July policy meeting revealed today, it was widely believed that the Fed will start asset tapering soon this year, so the prospect of the greenback is still bullish.
Resistance: 1.2653, 1.2763
Support: 1.2475, 1.2422, 1.2253
Economic Data
|
Currency |
Data |
Time (GMT + 8) |
Forecast |
||||
|
AUD |
Employment Change (Jul) |
09:30 |
-46.2K |
||||
|
USD |
Initial Jobless Claims |
20:30 |
363K |
||||
|
USD |
Philadelphia Fed Manufacturing Index (Aug) |
20:30 |
23.0 |
||||