Daily Market Analysis

Market Focus

US equity markets were negative as the bond yields became steady and investors rotated away from the stocks. In the meantime, European markets eked out a gain whilst most Asia shares fell the most in almost three weeks. Among those, Hong Kong equities declined to a 10 correction as it’s decision to temporarily suspend BioNTech vaccines.

Suez Canal snarled by giant ship has choked the key trade route. As one of the world’s busiest trade routes, it is very vital for the movement of crude oil and consumer goods. According to officials, no progress has been made so far. And the canal may be blocked for days. As around 12% of global trade such as oil shipments need to pass through the canal, this incident may potentially raise oil prices and shipping costs. As a result, oil prices jumped more than 5% today.

German Chancellor Angela Merkel decided to pull the plan for five- day lockdown over Easter. The withdrawal of the lockdown plan essentially meant that Germany remains under restrictions that were loosened before a third wave of infections.


Market Wrap

图表

描述已自动生成


Main Pairs Movement

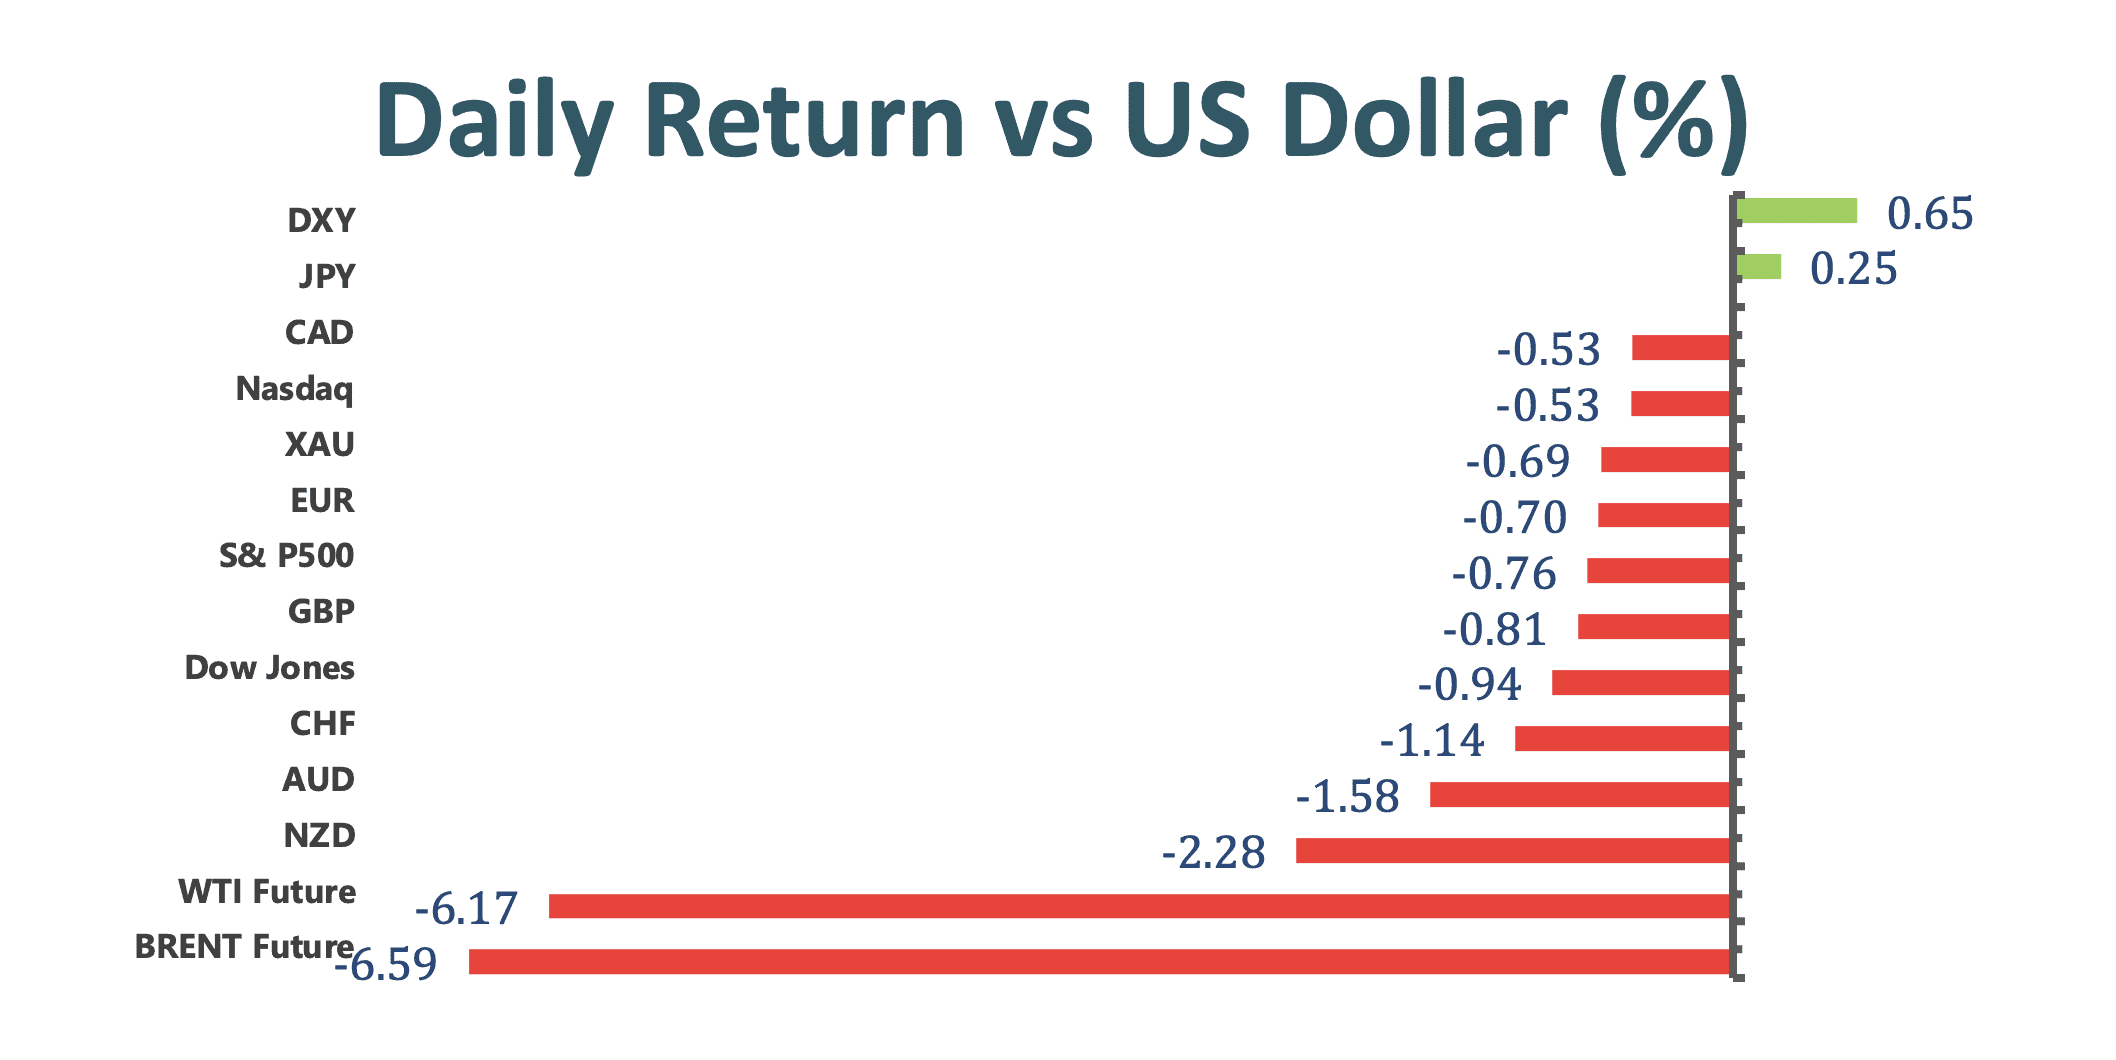
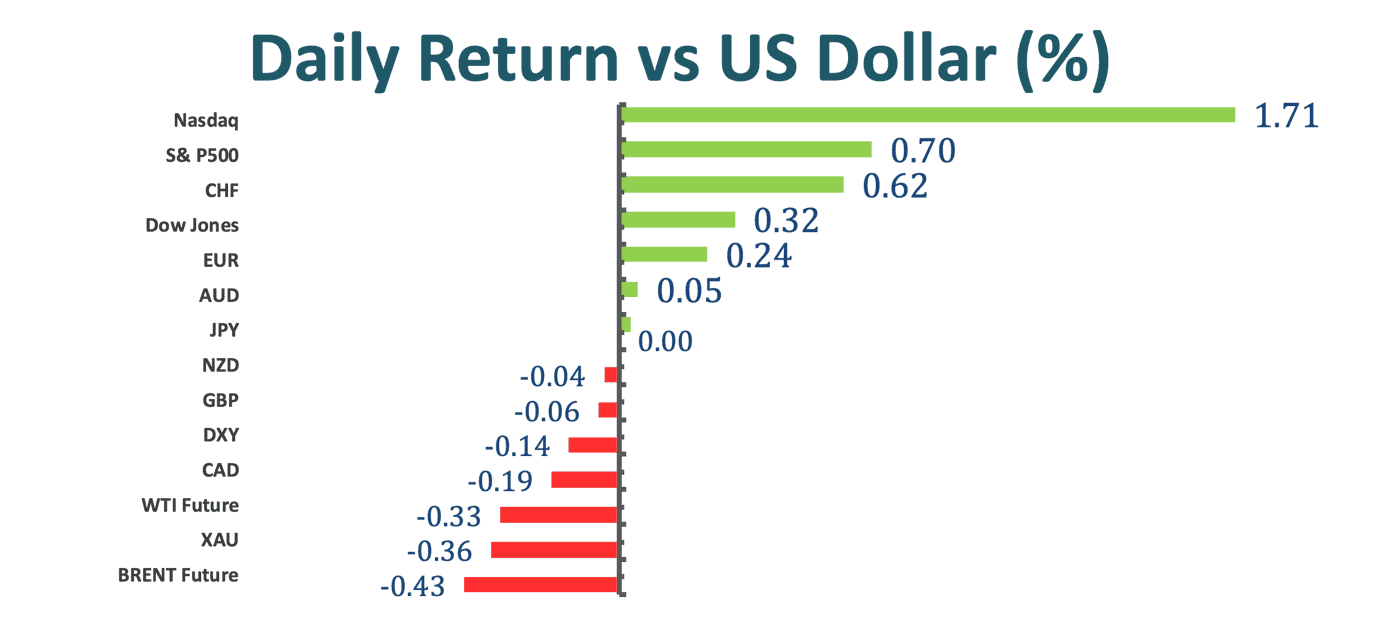
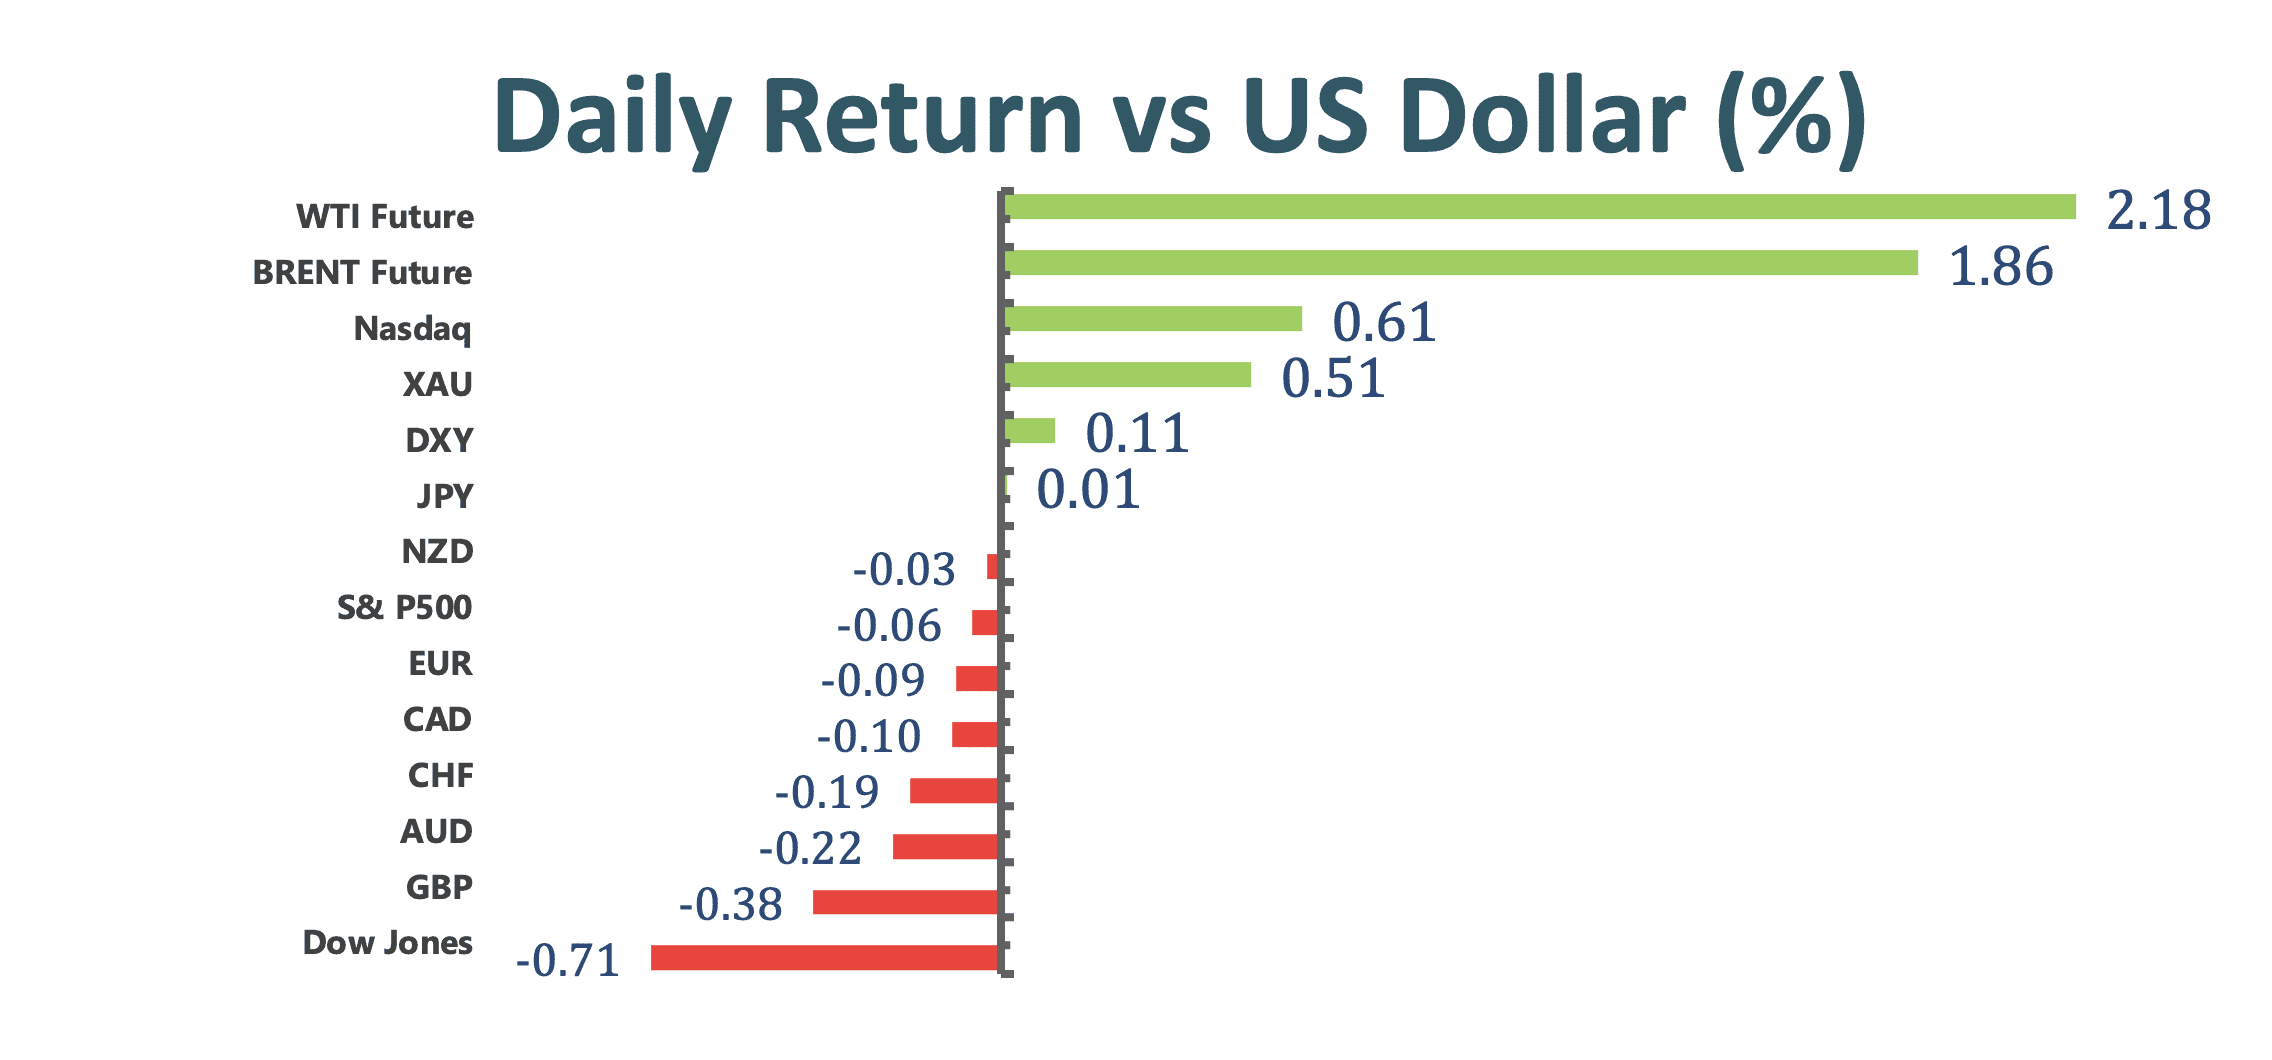
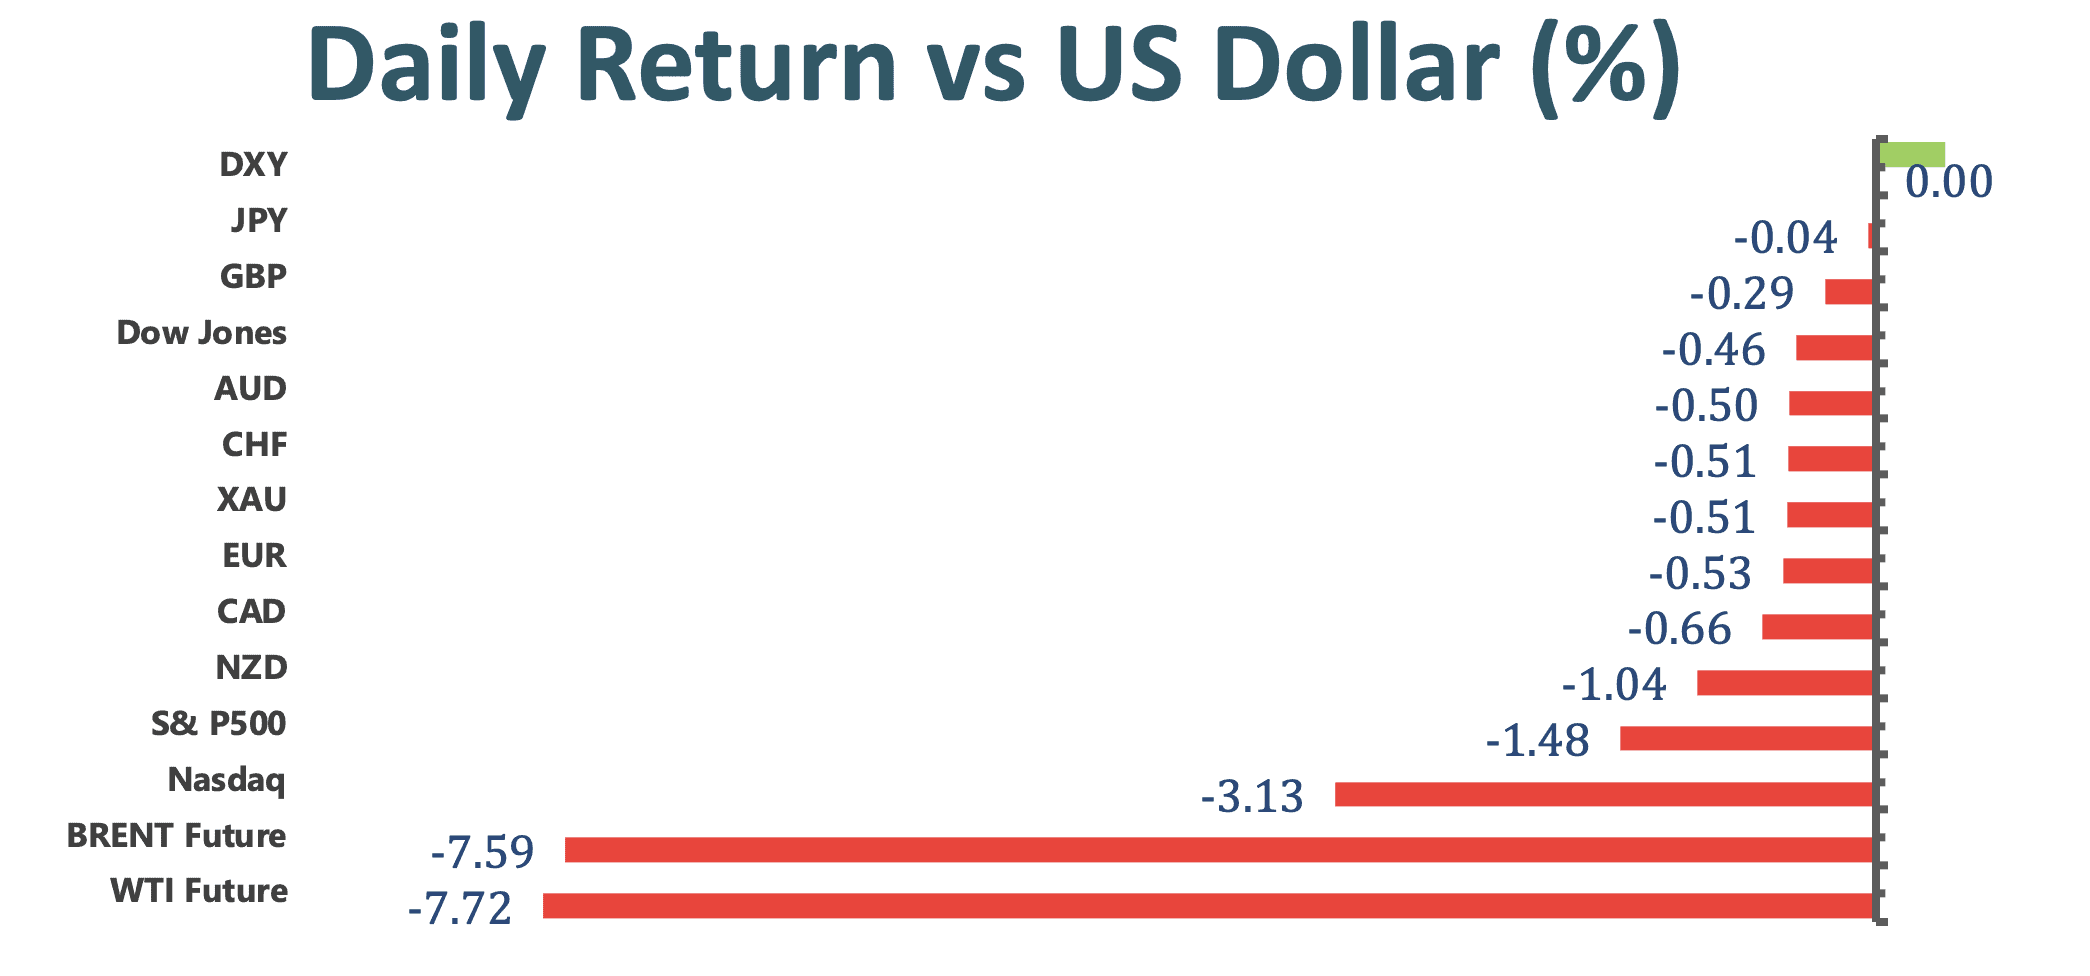
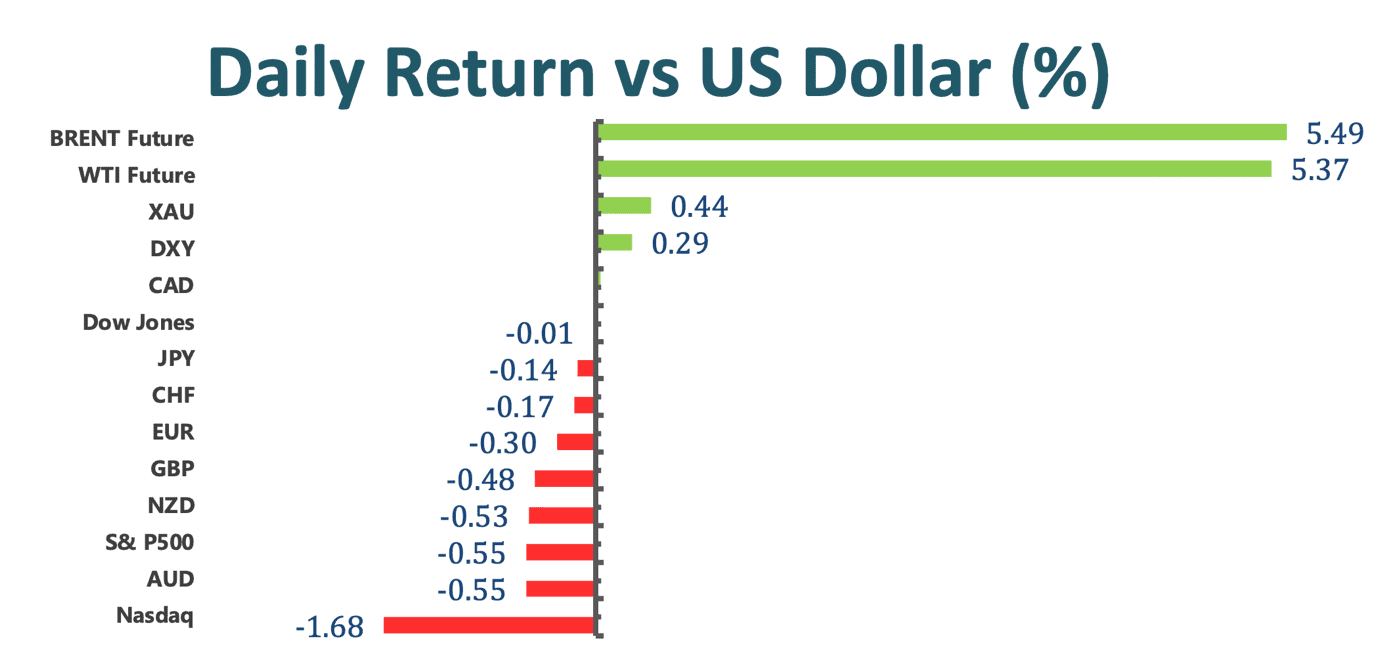
Crude Oil gained more than 5% as the blockage of the Suez Canal by a giant container ship is likely to send ripple of disruption through the global energy supply chain. Both US and European refiners that rely on the waterway may need to look for a temporary replacement.

Gold rose with ebbing yields and a disappointing US economic data. The demand for five years notes increased, and it has dropped around 10 basis points this week. With a good bond auction essentially supported gold. As a result, gold climbed about 0.4% today.

The British Pound struggled to close 1.37 against the US dollar as the US dollar gained traction and UK CPI missed estimates about 0.4%; at the same time, the Pound got weakened as the vaccination rollouts could slow down in the UK.

USDCAD declined further south below 1.2576 as oil prices rose above 60 on the back of an improvement in risk sentiment.


Technical Analysis:

USDJPY (Daily Chart)

USDJPY clings to modest daily gains around 108.76, keeping up its momentum within the ascending channel. The pair is confined to a tight range, consolidating in the near -term on the daily chart as it tries to adjust from the recent surge of the US Treasury yields. Since the RSI is still overbought, it is expected to see USDJPY to take a temporary break within the range from 109.45- 107.87. On the upside, the bulls need to contest and penetrate through the resistance of 109.45 to confirm the strength of the recent upside move. To the downside, the bears need to test all the way down to the support of 106.29(Fib. Retracement 33.2% ) in order to break the uptrend. Today, the move of the pair will eye on the US GDP reports and initial jobless claims.

Resistance: 109.45, 111.40

Support: 107.87, 106.29, 104.34


GBPUSD (Daily Chart)

GBPUSD pressures on downbeat mood amid strong US dollar and weak UK CPI report. The pair finally takes a break, trading at 1.37184, but still is in the negative territory after suffering from consecutive days of bearish momentum. On the four hour chart, the RSI is in the oversold consition, below 30, suggesting that it is expected to see a retreat; however, as the MACD indicator is still showing a bearish sign, the pair might continue to trade in the negative mode after the adjustment. To the downside, the bears will confirm if the pair breaks through the next resistance level of 1.3674. On the upside, the bulls need to test all the way up to 1.3868 in order to confirm a bearish- to- bullish momentum.

Resistance: 1.3674

Support: 1.3794, 1.3868, 1.3928


Gold (Daily Chart)

Gold continues to stay in a consolidation phase along with the resistance of 1746.91. The move of gold is likely to be determined whether the resistance level can be broken through. At this point, gold has hovered around the area for more than 5 trading sessions, thus expecting to see a breakthrough as bullish momentums are very strong at this point. At the same time, the MACD indicator also lends support to the bulls while the RSI is still neutral, giving gold rooms to move forward.

Resistance: 1746.91, 1790.23, 1825.24

Support: 1676.89


Economic Data

Currency

Data

Time (TP)

Forecast

CHF

SNB Interest Rate Decision

16:30

N/A

CHF

SNB Monetary Policy Assessment

16:30

N/A

GBP

BoE Gov Bailey Speaks

17:30

N/A

EUR

ECB President Lagarde Speaks

17:30

N/A

USD

GDP (QoQ) (Q4)

20:30

4.1%

USD

Initial Jobless Claims

20:30

730 k

Daily Market Analysis

Market Focus

US equity market suffered despite easing bond yields. The three big indexes were on the retreat. The S&P 500 index slumped 0.64%, with industrials and materials stocks led the decline.

Here is Bloomberg’s key takeaways from Janet Yellen and Jerome Powell House CARES act testimony:

 The Fed expects a temporary increase in fiscal stimulus in coming months. Powell repeated that the Fed will communicate well in advance when it gets closer to bond-buying tapering.
 Powell said inflation to move up over the course of this year, but it won’t get out of hand.
 Yellen characterized asset-price valuations as elevated by historical metrics. Powell added that while “some asset prices are a bit high,” banks are highly capitalized.
 Powell doesn’t favor complete privacy with regard to ownership of and transactions in a digital dollar. A system that relies on private governance or anonymous owners “would not be viable”.


Market Wrap

图表

描述已自动生成


Main Pairs Movement

Dollar was gaining traction on Tuesday, the dollar index ramped up 0.64%. The rally may be motivated by external forces, rather than US greenback itself. New Zealand government unexpectedly announced its move to fight rising house prices with a set of measures. The act will heavily hamper down rentier class as newly rolled out tax code makes housing speculation less profitable. To be specific, capital gains on properties investment will be taxed for any property held less than 10 years, compared to previous 5 years. The bigger implication is perhaps pandemic resilient or recovered countries like New Zealand are already getting their hands on reversing the consequence of a too loosen monetary policy. This synchronized expectation in turn dragged down currency crosses like the Aussie and Cable, where similar steps are followed.

Euro dollar plummeted 0.2% as investors are still digesting Turkey headline. Moreover, lockdown extension from Germany and Netherlands further weighed down on the shared currency. There is little sign of backdown from infection figures in Germany, Chancellor Angel Merkel noted “case numbers are rising exponentially thanks to the British variant of the virus, new British variant of coronavirus means we are effectively in a new pandemic. [lockdowns] will be extended until Easter.”

Renewed lockdown in Europe undermined oil price on Tuesday, the WTI crude and Brent crude futures plunged 6.17% and 6.59% respectively. Investors are worried that sluggish EU vaccination campaign will fall further behind amid resurgence of infections within the Euro Zone, thus decelerate the recovery in oil demand.


Technical Analysis:

EURUSD (Daily Chart)

Euro dollar looks to close the day with a solid breaish engulfing. Price was very close to climbing back above 1.1954 during yesterday’s session, but today’s recovering dollar strength killed bulls’ hope. More importantly, the double-top pattern is manefesting ifself as price broke through the neckline of 1.19. As we noted in previous analysis, this pair will exit the current consolidation pahse, and the bears will reclaim the driver seat. It is unsurprising to see a retaining selling bias given the breakout from a ascending trend. On the downside, the nearest contestant support lies around 1.1778, following by long standing 1.163. We are also seeing a bear revival from the MACD.

Resistance: 1.19, 1.195, 1.2215

Support: 1.1778, 1.163


NZDUSD (Daily Chart)

The long waited breakout on the Kiwi finally happened, after stuck inside a tight range between 0.7117 and 0.725. Price relentlessly plunged 2.14% on the news that New Zealand government will fight rising house price with a new set of policy. It is falling onto 50% Fibonacci of 0.7, which is also a significant pyschological support. We witnessed a strong bounce last time when this handle was contested, thus it is reasonable to induce a similar action this time around. However, if price fails to pull away from 0.7, then we suspect the starved bear will take price down to 0.69.

Resistance: 0.7117, 0.725, 0.7465

Support: 0.7, 0.69, 0.6768


XAUUSD (Daily Chart)

Gold is still clinging to the descending trendline, along with mid-line of Bollinger Band. Price is backed to a corner, and await for signals from the Treasury market. That being said, we remain a bullish stance on the precious metal since stimulus checks are in the rareview mirror, focus has returned to Fed’s dovish view and upcoming Treasury auction, which should eke out Gold. In fact, we are seeing bounce-offs from the frequently visited $1727 soft support, any decisive upward drift could encourage bulls to pile in. At this point, investors should be prudent to wait for a clear breakout from either side.

Resistance: 1765, 1839, 1872

Support: 1727, 1691, 1680


Economic Data

Currency

Data

Time (TP)

Forecast

GBP

CPI (YoY) (Feb)

15:00

0.8%

EUR

German Manufacturing PMI (Mar)

16:30

60.8

GBP

Composite PMI (Mar)

17:30

GBP

Manufacturing PMI (Mar)

17:30

54.9

GBP

Services PMI (Mar)

17:30

USD

Core Durable Goods Orders (MoM) (Feb)

20:30

0.6%

USD

Fed Chair Powell Testifies

22:00

USD

Crude Oil Inventories

22:30

-0.272 M

VT Markets The adjustment of UK/EU DST

Dear Client,

Due to the UK/EU Daylight Saving, the adjusted trading hours (of certain products), which will be excuted on 28th March, are shown as below.

Please refer to the following table for details:

If you use an Expert Advisor (EA) / automated trading robot which requires the GMT offset to be manually entered, please ensure that you adjust the GMT offset to GMT+3 Hours to reflect this change before market open on the next Monday.

If you have any questions, our team will be happy to answer your questions.

Please mail to info@vtmarkets.com or contact the service online.

Daily Market Analysis

Market Focus

Nasdaq 100 climbed as high as 2% as the US Treasury yields slid, providing a tailwind for equity markets. Markets also focused on the Federal Reserve’s SLR decision. The Fed is letting expire at the end of March a temporary change to its SLR requirement for banks. The worst scenario is that some of banks have to issue preferred to make room for the increase in deposit, potentially resulting in major selloffs.

Turkish Lira plunged as much as 15% against the US dollar after the Turkish President Erdogan abruptly fired the head of the central bank, putting the Lira for its worst single day decline in nearly three years. Ncai Agbal, who was appointed in November, was the country’s third central bank governor got removed in less than two years. And the reason for the removal was an advocate of lower rates. Agbal’s removal results in a 200 basis- point interest rate hike by the central bank. With the Lira’s freefall, it adds to Turkey’s inflation problem and also risks worsening currency mismatches. Moreover, the rise in external borrowing costs are going to make it harder for Turkish borrower to roll over their external debts.


Market Wrap

图表

描述已自动生成


Main Pairs Movement

The Aussie climbed to its highest in nearly two weeks following a drop in the jobless rate. The Aussie rose as much as 0.4% today as it was bought by leveraged funds buying for the second time in a day in the wake of a better- than- expected jobless report. Jobless data dropped to 5.8% from an expected 6.3% whilst full- time employment added 89.1k jobs.

The yellow metal, gold turned negative amid concern that the US Treasury yields might rise further even though the yields dropped nearly 1.7% today. Investors took close attention to the heavy slate of auctions with bonds getting pummeled recently amid an optimistic outlook for growth and inflation. As a result, potential gains in gold might not be enough to spur investors to close out bets.

EURUSD reversed its direction and turned in positive, up around 0.28% on the day at 1.1935. Weaker US Treasury yields today continue to drive the US dollar’s performance. On the other hand, the ECB has pointed out that it is ready to adjust all of its instruments to ensure that inflation moves toward a sustained manner.


Technical Analysis:

EURUSD (Daily Chart)

EURUSD has risen above 1.19 level as the US Treasury yields have dropped today, but still trapped in the descending channel on the daily chart. The pair has limited the bullish potential in the near- term as it needs to climb beyond around 1.2124 to give bulls a chance to happen. By rising up above 1.2124, where the yearly ascending trend and short- term descending trend cross, the pair would trade above the 50 and 100 SMAs, giving it a chance to reverse from bearish to bullish. In the near- term, EURUSD is under downside pressure as the RSI indicator has not reached the oversold condition, giving rooms to further south.

Resistance: 1.1945, 1.2349

Support: 1.1695, 1.1492, 1.1290


GBPUSD (Four- Hour Chart)

Cable turns positive as the US Treasury yields trade lower today, resulting in a weaker US dollar. Cable has been setting higher lows since it hit a low of 1.3779 in the beginning of March. On the four- hour chart, the pair has rebounded back to the ascending trend, heading to the next resistance level at 1.3887(Fib. Retracement 23.6%.) Bulls are trying to comeback as the MACD lines are getting narrowed even though cable is currently trading under the 50 SMA; meanwhile, the RSI is still neutral, giving Cable rooms to move further.

Resistance: 1.3887, 1.3954, 1.4008

Support: 1.3779


XAUUSD (Daily Chart)

Gold continues to move up and down between the key resistance hurdle at 1746.91. In a bigger picture, gold is still trapped in the descending channel while trading below the 50 Simple Moving Average. However, in the near- term, the direction of gold is likely to be determined whether the resistance level can be broken. Gold has hovered around the area for a while,thus expecting to see a breakthrough as bullish momentums are very strong at this point. At the same time, the MACD indicator also lends support to the bulls while the RSI is still neutral, giving gold a chance to move forward.

Resistance: 1746.91, 1790.23, 1825.24

Support: 1676.89


Economic Data

Currency

Data

Time (TP)

Forecast

GBP

Average Earnings Index +Bonus (Jan)

15:00

4.9%

GBP

Claimant Count Change (Feb)

15:00

N/A

BRL

BCB Copom Meeting Minutes

19:00

N/A

GBP

BoE Gov Bailey Speaks

19:50

N/A

USD

Fed Chair Powell Testifies

22:00

N/A

USD

New Home Sales (Feb)

22:00

875 K

VT Markets The Adjustment Of Weekly Dividend Notification

Dear Client,

Warmly reminds you that the component stocks in the stock index spot generate dividends. When dividends are distributed, VT Markets will make dividends and deductions for the clients who hold the trading products after the close of the day before the ex-dividend date.

Indices dividends will not be paid/charged as an inclusion along with the swap component. It will be executed separately through a balance statement directly to your trading account, the comment for which will be in the following format “Div & Product Name & Net Volume ” .

Please note the specific adjustments as follows:

If you’d like more information, please don’t hesitate to contact info@vtmarkets.com.

Daily Market Analysis

Market Focus

US equity market was mixed as investors weighed the risk of inflation with economic growth accelerating. The Dow Jones Industrial Index is down on a second consecutive day, dropped 0.77% on Friday. Meanwhile, the S&P 500 index pared its weekly losses, with communication stocks led the gain and financial and real estate shares fell behind. US 10-year treasury yield rose 0.55%.

The Federal Reserve will relax its Supplementary Leverage Ratio on banks to pre-pandemic level. In response to market panic back in last March, the Fed had let banks to exclude Treasuries and deposits in SLR calculation. However, this relief will lapse March 31 as planned, the Fed said in a Friday statement.

The first high-level talks between China and US since President Biden took office quickly descended into recrimination. The largest two economies criticized each other over human rights, trade, and international alliances. In response to Biden’s toughness, China accused “US wasn’t qualified to speak to China from a position of strength.” Despite wide expectation of divergence in the first meeting, investors are growing concerns over the development in these fiery talks.

Here is Bloomberg’s key takeaways from BoJ monetary policy:

 Will be flexible in keeping up its long quest to revive inflation that include a wider-than-previously-thought movement range for bond yields.
 The band around its 10-year yield target was around 0.25% either side of zero.
 Unveiled bank lending incentives and a plan to revise its three-tier reserve system if it lowered its target rates.
 Economists described the move as a balancing act that allows the BoJ greater scope to buy few assets but also shore up the effectiveness and sustainability of its measures.


Market Wrap

图表

描述已自动生成


Main Pairs Movement

Euro was on the back foot against the US greenback as US bond yield advanced to 1.74%. As the mutated coronavirus has taken hold in Italy, Prime Minister Mario Draghi pushed most part of the country into another lock down, set to expire in early April. The latest restriction will significantly deepned the current economic contraction. Thus, the Euro bears are here to stay.

Cable was the worst performer among its G-7 peers, dipped 0.4% on Friday. The Sterling was weighed down by slowdown of its vacination campaign. Around 38% of UK’s population received the first dose of vaccine, but only 2.6% administered the second dose. Investors are concerned that slowing supply may derail exit from the current lockdown.

Aussie slipped 0.14% amid downbeat retail sales. Australian retail sales declined by 1.1% in February, missed expecation of 0.4% growth. However, the commodity linked is generally resilient to the rebounding dollar greenback, dipped only 0.23% on a weekly basis.

Gold continued to recover albeit higher bond yields, rallied 0.31%. We are witnessing a deceleration in sell-offs among the largest Gold ETFs. SPDR Gold ETF holding was essentially unchanged for the week of March 15th, whereas iShares Gold Trust holding only decreased 0.02 million ounces in the past two weeks. Perhaps, we could see some dip-buying as the non-yield metal is oversought recently.


Technical Analysis:

EURUSD (Daily & Monthly Chart)

Euro dollar is undergoing a double-top trading pattern on the daily chart. In order to complete this pattern, the bears need a solid breakthrough from neckline of 1.19. On the downside, price would fall onto nearest support of 1.1778, last seen in last November. Conversely, resurgence to 1.195 resistance could offer bulls the chance to pile in, and create momentum to reclaim 1.2. As we mentioned in previous analysis, recent selling bias is actually a bigger retracement on the monthly chart, thus it is completely conceivable for the first scenario to play out itself. MACD slightly favors a bearish trend.

Resistance: 1.1954, 1.209, 1.221

Support: 1.1778, 1.163


AUDNZD (Daily Chart)

AUDNZD is trapped within an ascending triangle, and price is clinging to the ceiling around 1.083. An asending triangle usually points to a bullish trend. Yesterday’s solid long body candlestick has indicated demand for the Aussie are overwhelming compare to Kiwi. In fact, this is bulls’ strongest contest to 1.083 resistance, and we expect sellers to surrender this level. Further in the north, the antipodean pair could eye for 1.093, possibly advance toward 1.1 hurdle. MACD on the daily chart also lends support to the bulls.

Resistance: 1.083, 1.093, 1.1

Support: 1.064, 1.057


XAUUSD (Daily Chart)

Gold is still constrained by a descending trendline, which is in line with our forecast. However, price seems to be sticky on the trendline, implying a deminishing pressure from this dynamic resistance. That being said, market may take a breather from recent exteme bearishness on precious metal thanks to Federal Reverse’s dovish tone on Wednesday, thus reviving risk-off tone. More observations are needed amid tentative market movement. If price manged to stand above the downward trendline, then it would look to contest 50% Fibonacci of $1765. Conversely, bearish bias would persist and accelerate if bulls fail to retake the driver seat.

Resistance: 1765, 1839

Support: 1691, 1670, 1600


Economic Data

Currency

Data

Time (TP)

Forecast

USD

Existing Home Sales (Feb)

10:00

6.49M

Daily Market Analysis

Market Focus

In the US market, Nasdaq fell as the US Treasury yields hit another highest level in more than a year amid the concern of letting inflation accelerate after the FOMC. The 10- year US Treasury hiked to as high as 1.75% for the first time since January 2020 even though the Fed has announced that currently there is no plan to rise interest rates anytime soon until 2023. In the meantime, the 30- year yield has breached 2.5% for the first time since August 2019. Jerome Powell appears to be willing to keep pumping support into the economy and let it run hotter on a fast-paced growth and inflation.

Japan’s central bank planned to carry out monetary policy adjustments designed to increase its flexibility for financial institutions. Bank of Japan considered to be looking at measures that widen the fund rates move in slightly larger range of 0.25%. With this consideration, it not only can maintain low interest rates, but also give financial institution a chance to increase revenue.

The Bank of England decided to keep interest rates unchanged on the future monetary policy. As a response, the UK bond yields moved higher on expectations of rising inflation. Moreover, BOE reassured that a tightening monetary policy won’t happen until a clear evidence of an economy recovery.


Market Wrap

图片包含 日程表

描述已自动生成


Main Pairs Movement

Gold declined as the US Treasury yields reached to highest in more than a year. In response to the climbs in the yields, most metals fell. As Jerome Powell mentioned, inflation is likely to be transient, and will not mark progress toward the Fed’s long- term goals. With this, the Fed has no intention to push back against the surge in Treasury yields. In the meantime, holdings in ETF have gradually fallen in every session since February for the longest decline on record. With the combination of the selloff from ETFs and the surge in Treasury yields, gold is heading to a bearish trend.

Crude oil lost around 7% today, settling at $60 a barrle amid the concern over short- term demand and as a strong US dollar weakened commodities priced in the currency. The selloff was the biggest since September.


Technical Analysis:

XAUUSD (Daily Chart)

After riding with the FOMC news, contesting the resistance at 1746.91(Fibonacci 23.6% retracement,) gold turns to bearish trend as it fails to break through. At the same time, the bullish- to- bearish momentum is confirmed as the MACD indicator narrows down, and the RSI continues to stay in neutral, implying that there is still more room for the pair to the downside. The next target for gold is expected to sit around the support level at 1676.89(Fibonacci 0% retracement.) if gold successfully breaks the strong support level at 1676.89, then it will open up an accelerating downside pressure.

Resistance: 1746.91, 1790.23, 1825.24

Support: 1676.89


EURUSD (Daily Chart)

EURUSD drops toward 1.1900 as US dollar index recovers with the US bond yield continues to surge, currently trading around 1.1925. On the daily chart, EURUSD continues to trade within the descending channel; at the same time, it is located below the 50- and 100- SMA, indicating a bearish mode. However, the RSI indicator stays in a neutral situation, suggesting that there is room for the pair to climb or drop. However, after turning into a positive mode from the descending trend, the pair has hovered around the resistance for a while, implying that the pair might not have enough boost to go up. If the pair can successfully climb above the resistance at 1.1945, then it will open a chance to contest the next resisance at 1.2349, where turns the pair from bearish to bullish in the near- term and long- term. To the downside, if the pair fails to test 1.1945, then it will potentially head toward 1.1695, which confirms a bearish trend.

Resistance: 1.2349

Support: 1.1945, 1.1695, 1.1492


BTCUSD (Daily Chart)

Bitcoin once again explodes to all time high this week as bitcoin is moving towards the mainstream where major companies, including Square, Paypal, Tesla, and some China giants, are confident in the future. From a technical aspect, bitcoin has overcome the downside pressure from the beginning of the week, and now has turned back to a bullish trend with the psychological support level at 58000. As of now, bitcoin is expected to keep up its bullish momentum as the RSI of 63 has not yet reached the overbought condition while the pair is trading within the ascending channel and above the 50 SMA. The next price target is expected to be the next resistance of 61742.41(Fibonacci 100% retracement.)); if bitcoin can successfully break the level, it will open up a chance to hit another record- high.

Resistance: 61742.41

Support: 58000, 49564.44, 42030.61


Economic Data

Currency

Data

Time (TP)

Forecast

AUD

Retail Sales (MoM)

08:30

N/A

JPY

BoJ Press Conference

10:30

N/A

RUB

Interest Rate Decision (Mar)

18:30

4.25%

RUB

Interest Rate Decision

18:30

N/A

CAD

Core Retail Sales (MoM) (Jan)

20:30

-2.6%

VT Markets Notification of Server Upgrade

Dear Client,

As part of our commitment to providing the best reliability and service to our customers, we are planning an upgrade in our server on Mar 20th 2021.

As a result, we will be conduct maintenance according to the schedule below.
Start date and time: 2021-03-20 11:00 GMT+2(Server time)
End date and time: 2021-03-20 14:00 GMT+2(Server time)

The impact can only make customers be unable to log in to the MT4 /MT5 software temporarily, and that won’t affect any order which has been opened.

After the upgrade, clients can login to MT4/ MT5 software using the server which is shown in the account activation mail.

No action is required by our customers. Your services will come back online at the end of the maintenance.

Thank you for your patience and understanding with regard to this important initiative.

If you have any questions, our team will be happy to answer your questions. Please mail to info@vtmarkets.com or contact the service online.

Daily Market Analysis

Market Focus

US stocks market was mixed on Tuesday while 10-year yield edged slightly higher. Apple Inc. and Microsoft Corp. lifted the tech-heavy Nasdaq 100 index. Meanwhile, the S&P 500 index closed marginally lower, with energy and industrials stocks leading the decline.

President Joe Biden looks to impose higher taxation rate on corporation and wealthy Americans, with relieve eyed for middle-class households. Biden’s proposal will mostly affect families earning more than $400,000 a year and could layout path for his long-standing economic and infrastructure plans. However, the road to higher taxation will be bumpy since any tax changes will have to move through Congress, and Biden has almost no power to push through his plan via an executive order.

European Union look to resume vaccination campaign as the block’s drug regulator signaled AstraZeneca’s Covid shot was safe. Shortly after, Italy and France hinted that they would resume using AstraZeneca vaccine. Despite the setbacks, European Commission will unveil its strategy to gradually lift coronavirus lockdowns on Wednesday.

Bloomberg’s key takeaways from China’s economic data releases:

 Official figure showed growth rates of more than 30% for industrial production, retail sales and fixed asset investment.
 Economists warned that recovery remains imbalanced, and the foundation for the economic recovery is not yet solid.
 Jobless rate was 5.5% at the end of February, up from 5.2% in December.


Market Wrap

图表

描述已自动生成


Main Pairs Movement

Euro dollar dipped 0.17% albeit upbeat investors confidence data. Germany published the ZEW Economic Sentiment for March on Tuesday, the figure came on top of forecast of 74, printed 76.6. Speculators now awaits the Fed announcement to look for clue on how the central bank will deal with its current account deficit and whether they will push agenda to hike interest rates.

Aussie, Kiwi, and Cable plunged prior to EU session, but pared most of their loss later in the day. Safe-haven pairs such as USDJPY and USDCHF dropped 0.14% and 0.42% respectively. However, low-yielding currencies should remain subdued given the global rise in yields triggered by US led reflation trade.


Technical Analysis:

XAUUSD (Daily Chart)

Gold is gradually losing its bouncing strengths as $1740 kept a solid lid on any upward moves. Price is close to kissing its descending trendline that started in January, but price has been rejected by $1740 hurdle three times. This in turn diminishes the likelihood of price actually touches the dynamic resistance line. Sellers are patiently waiting for bond yields to edger higher to kick off another around of bearish run, and price would breach below support band of $1691 and $1673 this time. Further on the south, bears ultimately eyes for $1600 handle. MACD on the daily chart is printing a bullish picture.

Resistance: 1765, 1839

Support: 1691, 1673, 1600


GBPJPY (Weekly Chart)

GBPJPY is extending its gains to the tenth consecutive week, approaching the highest price of 152.83 since April 2018. Strong fundamentals for the Sterling combined with receding demand for safe-haven currency have helped this pair to forge such incredible surge. Meanwhile, the continuous appreciation has driven RSI deeply into the overbought zone, currently printing 77. We expect price to contest 152.83 resistance level prior to profit takings, which would prompt a correction toward the purple trendline. However, the prospect of this pair remains to be bullish within a risk-on enviroment in 2021.

Resistance: 152.83

Support: 149.43, 145.9, 141.17


EURUSD (Daily & Monthly Chart)

Euro is under pressure amid recovering US dollar, and is on a third losing streak. Despite price managed to overcome horizontal resistance of 1.1954, but it failed to reclaim key 1.2 psychological level. The false breakout marked a retracement of the current bearish trend, which looks to resume toward 1.1778.

On the monthly chart, the euro-dollar is correcting toward 23.6% Fibonacci level of 1.167, which is in confluence with the daily picture. However, we expect a robust rebound at this stern support line. In the longer term, the bulls look to challenge previous high of 1.25.

Resistance: 1.1954, 1.2215

Support: 1.1778, 1.163


Economic Data

Currency

Data

Time (TP)

Forecast

EUR

CPI (YoY) (Feb)

18:00

0.9%

USD

Building Permits (Feb)

20:30

1.750M

CAD

Core CPI (MoM) (Feb)

20:30

USD

Crude Oil Inventories

22:30

2.964M

USD

FOMC Economic Projections

2:00 (March 18)

USD

FOMC Statement

2:00 (March 18)

USD

Fed Interest Rate Decision

2:00 (March 18)

USD

FOMC Press Conference

2:00 (March 18)

VT Markets Notification of trading adjustment in holiday

Dear Client,

Please note change of the following some products due to The Public Holiday in South Africa

If you have any questions, our team will be happy to answer your questions. Please mail to info@vtmarkets.com or contact the service online.

Back To Top
server

Hello there 👋

How can I help you?

Chat with our team instantly

Live Chat

Start a live conversation through...

  • Telegram
    hold On hold
  • Coming Soon...

Hello there 👋

How can I help you?

telegram

Scan the QR code with your smartphone to start a chat with us, or click here.

Don’t have the Telegram App or Desktop installed? Use Web Telegram instead.

QR code