Daily Market Analysis

Market Focus

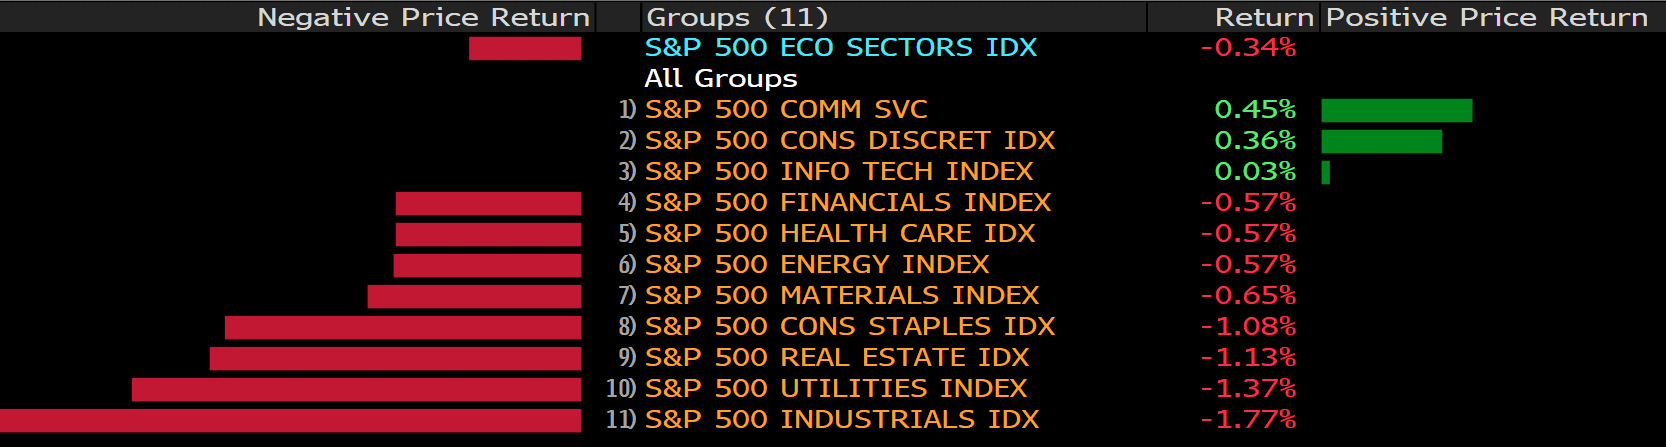
The S&P 500 and Dow Jones Industrial Average declined, while gains in heavyweight tech stocks including Netflix Inc., Amazon.com Inc. and Apple Inc. pushed the Nasdaq 100 higher even as about seven out of every 10 stocks in that gauge dropped. European markets slipped as investors speculated that euro-zone policy makers may get ready to roll back stimulus. The greenback strengthened for a second day amid rising bond yields and softer commodity prices. Bitcoin plunged as El Salvador became the first country to adopt it as legal tender Tuesday.


一張含有 文字 的圖片

自動產生的描述


The largest cryptocurrency fell as low as $43,050 in New York Tuesday, before paring losses. Bukele said his country had taken advantage of the crash to “buy the dip”, adding 150 coins to take its total holding to 550, worth about $26 million.

El Salvador’s plan represents the biggest test for Bitcoin in its 12-year history. Both enthusiasts and detractors of cryptocurrencies are monitoring the experiment to see if a significant number of people want to transact with Bitcoin when it circulates alongside the U.S. dollar, and whether it brings any benefits to the violent, impoverished Central American nation.

If the experiment is a success, other countries may follow El Salvador’s lead. Its adoption will get an initial boost from the government’s Bitcoin wallet Chivo, which comes pre-loaded with $30 worth of the currency for users who register with a Salvadoran national ID number.

Businesses will be required to accept Bitcoin in exchange for goods and services and the government will accept it for tax payments. The plan is the brainchild of El Salvador’s 40-year-old president, who says it will draw more people into the financial system and make it cheaper to send remittances

“This is brave new world stuff,” said Garrick Hileman, head of research for the London and Miami-based Blockchain.com. “We are in unchartered waters with this launch, but I’m glad to see this experiment happen overall, and I think we’ll learn a lot from it.”


Main Pairs Movement:

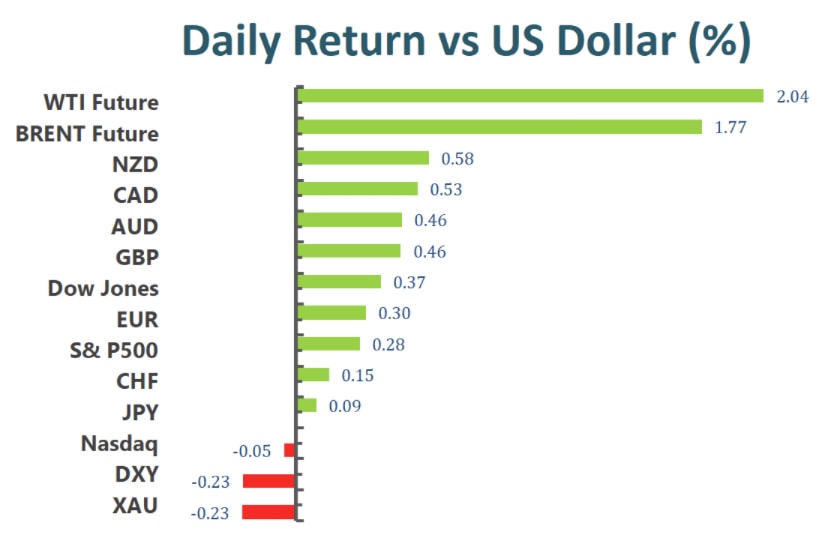
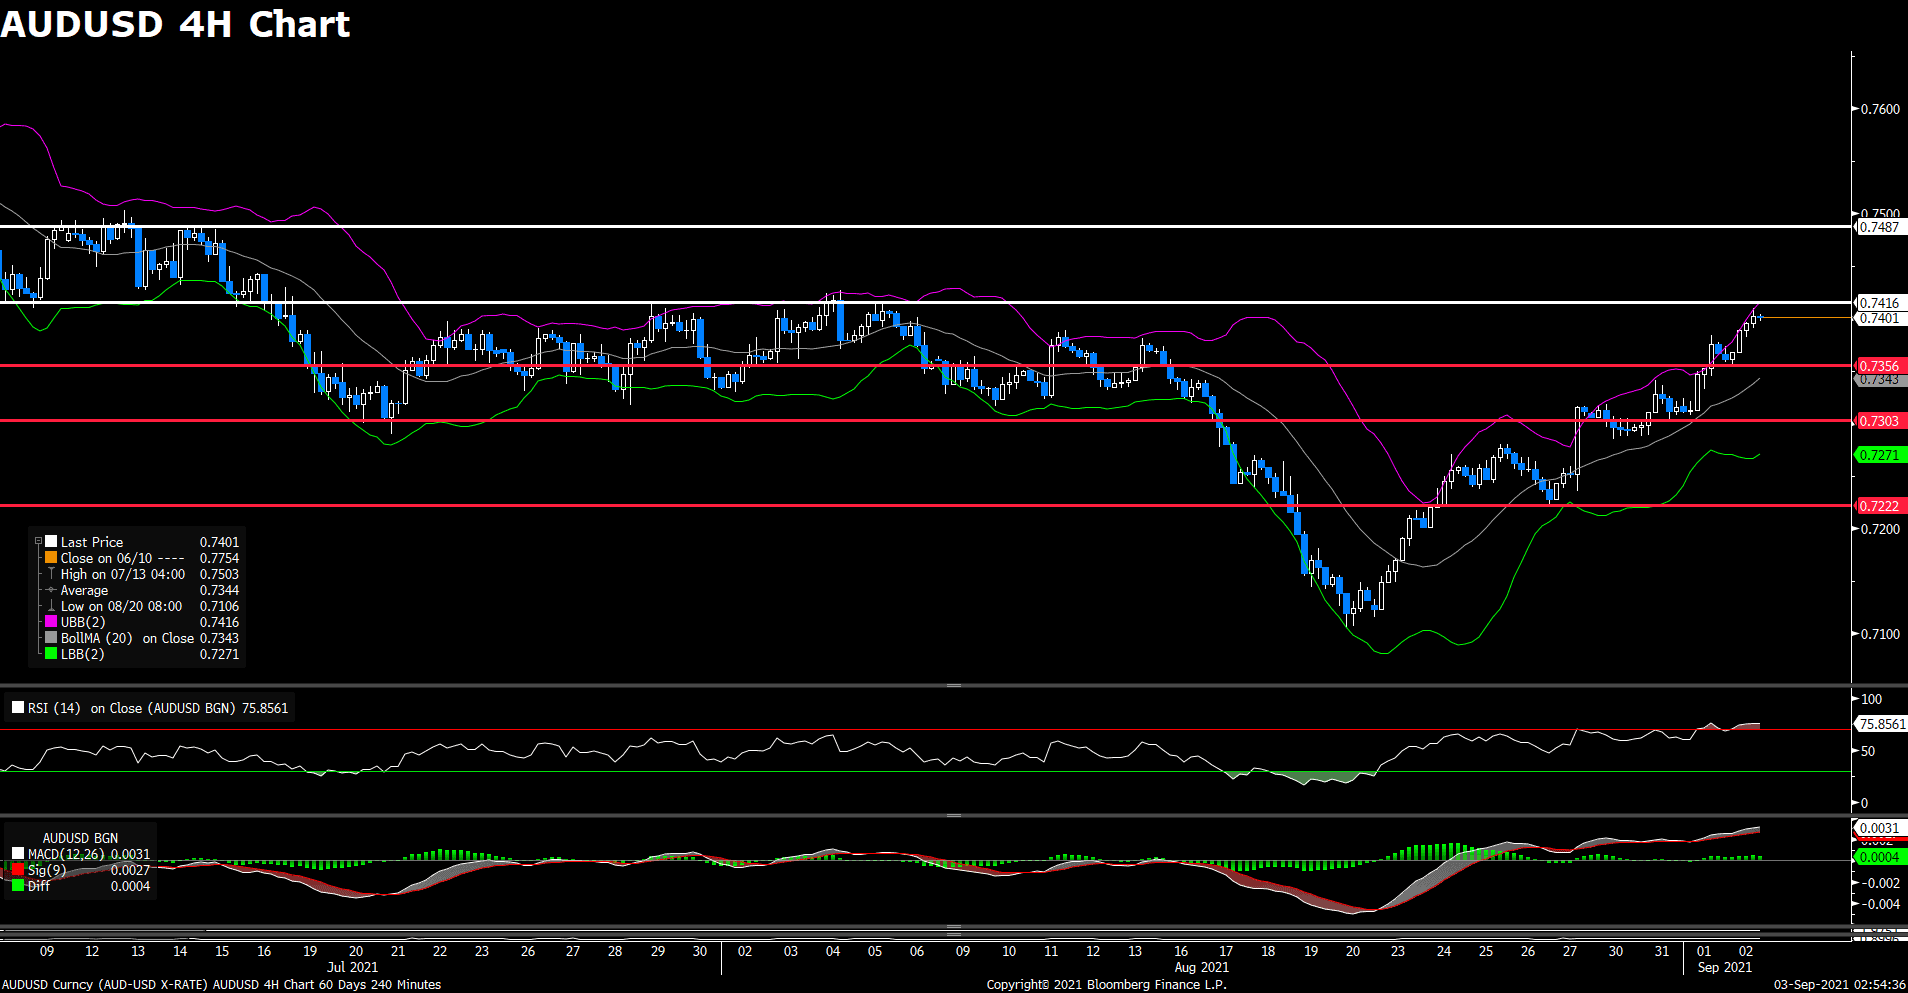
The US dollar traded higher after surge in delta-variant infections weigh on risky currencies, the dollar index climbing 0.37% on Tuesday. According to Reuters’ data, there were more than 20,800 people died from the coronavirus in the United States in the last two weeks, that is a 67% increase from prior two weeks. Situations in Australia and New Zealand are not so encouraging as both governments look to extend lockdowns further in the second half of 2022.

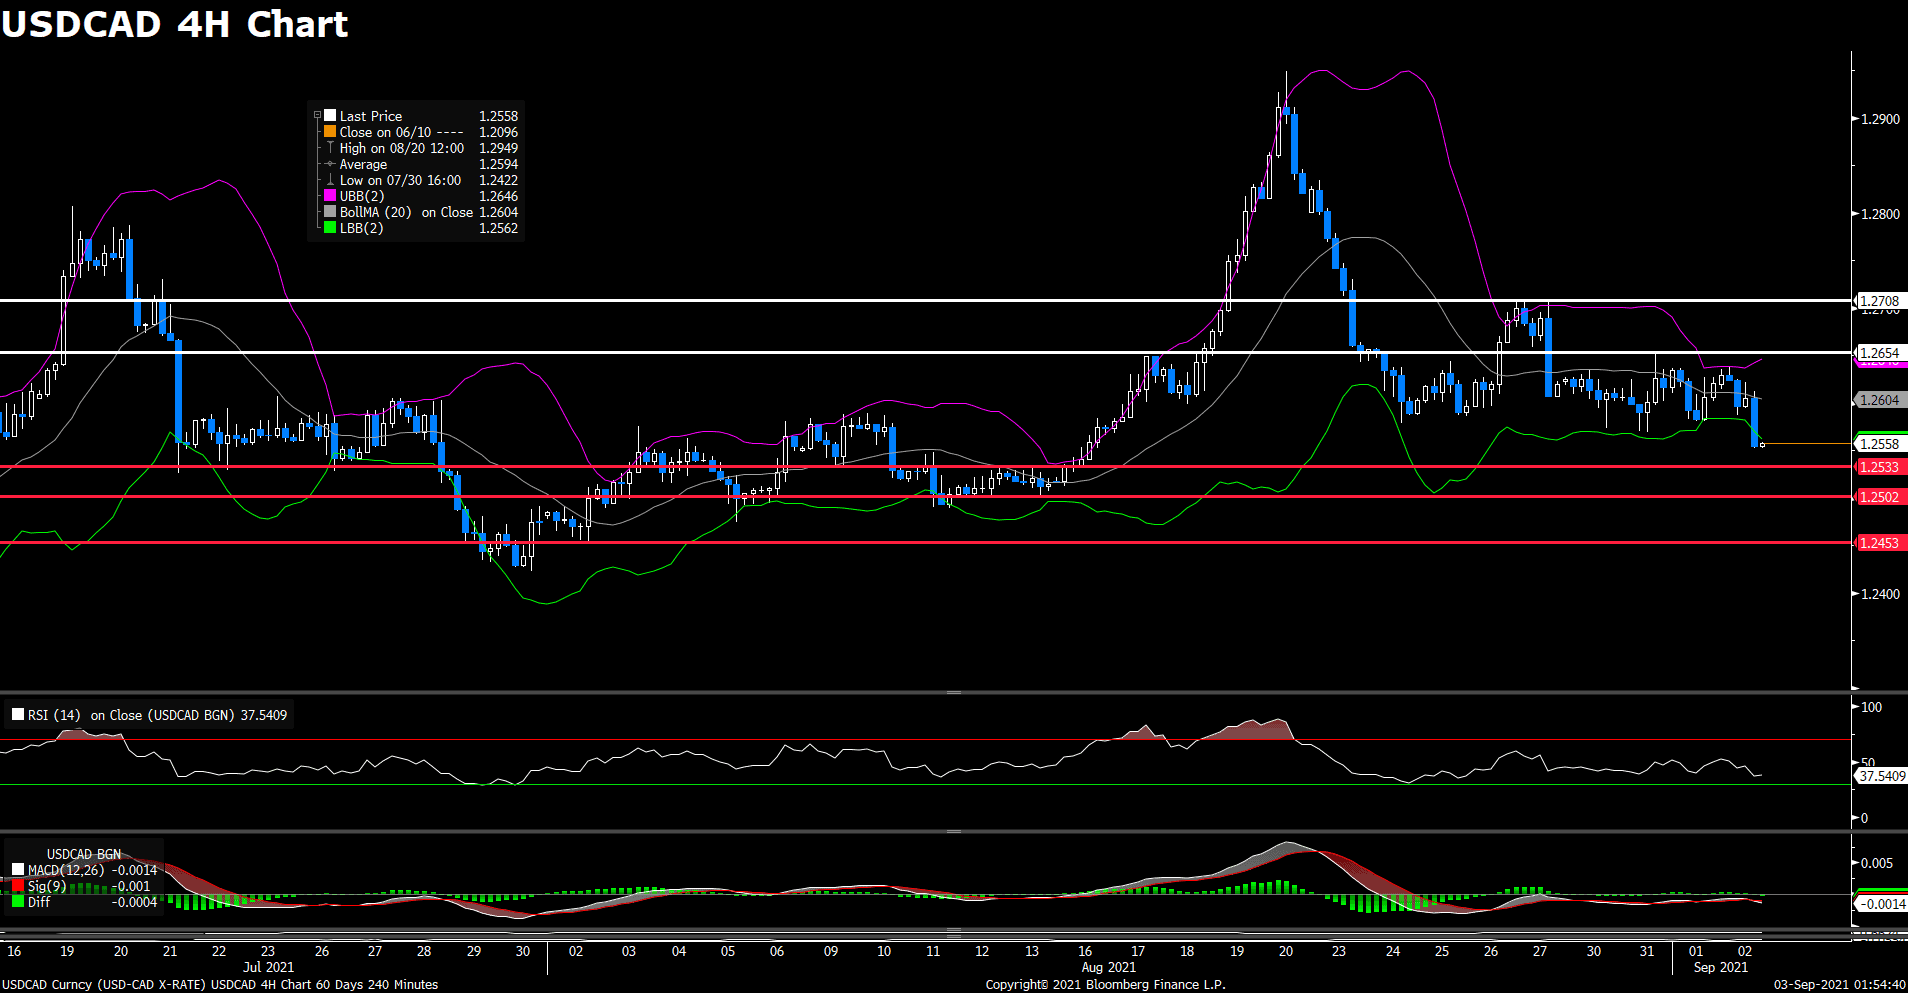
USDCAD surged 0.9% amid weaker oil prices. The Bank of Canada will announce its interest rate decision on Wednesday. Though Governor Tiff Macklem hinted their intention to lift interest rate in the second half of this year, but investors doubt that they will act in September. That said, BoC is likely to path their way toward a rate hike during tomorrow’s meeting.

Euro was the most resilient currency against the dollar greenback during Tuesday’s session albeit dropped 0.25%. The shared currency was underpinned by market optimism surrounding ECB’s meeting on Thursday. Analysts expect ECB to undergo a debate to cut its current PEPP weekly purchase of 80 billion euros to 60 billion euros. Given ECB’s past unpleasant experience at failing to achieve 2% inflation target, July’s overshoot of 2.2% Harmonized Index of Consumer Index marked a milestone for policy makers. And with the PEPP comes to an end on March 22, 2022, central bankers need to the afterlife of a ultra-loose monetary policy.


Technical Analysis:

EURUSD (Daily Chart)

Euro dollar was restrained from advancing beyond 1.189, retreated mildly on Tuesday. It successfully capalized on decent upside gains after conquering a dynamic resistance at SMA20. However, the stubborn road block at 32.8% Fibonacci of 1.189 continues to ward off bulls’ attempt to break above.

We expect the single currency to trade marginally lower against the dollar prior to ECB’s critical policy announcement on Thursday. With market participants look to hear a less dovish tone from the ECB, a lower price could provide some leeway for upward surge.

On the downside, nearest support line sits around 1.18, followed by 1.166. Up in the north, bulls could contest 1.198 and 1.1207 if they could take out 1.189.

Resistance: 1.189,1.196, 1.2

Support: 1.18, 1.166


NZDCHF (Daily Chart)

NZDCHF remains bullish despite snapping a ten-winning streak. This pair broke above a seven-months downward tunnel with robust buying bias. Though some may think current price is overstreched, and some sort of pullback should unfold soon. But we believe bulls could at least challenge resistance at 38.3% Fibonacci of 0.6567 before it could stage a retreat toward 0.65 or 0.644. The RSI indicates price is on the cusp of stepping into overbought zone, which provides incentive for buyers to continue to drive price higher, and as soon as price is overheated, they could exit current longs.

The fact that NZDCHF had a convincing breakthrough on SMA20 on the weekly chart has signaled a bullish reversal. All in all, we see further upside gains in NZDCHF in a longer investment horizon. A modest retreat could be very healthy to sustain such bullish trend.

Resistance: 0.6567, 0.6645, 0.677

Support: 0.65, 0.644, 0.6353


XAUUSD (Daily Chart)

Gold plunged to two weeks’ low at $1795 after failing to surpass a stern resistance at $1835.

Current retreat could be seen as a validation of $1795 support, which acted as a neckline for previous double-top pattern. This horizontal support could also collaborate with dynanmic SMA20 to eke out Gold price. That said, the odds are favouring buyers, and we expect another contest of $1835 to take place soon.

However, it is still unclear whether it could gather enough momentum for a solid upward breakout in the near term. We would not be surprised if the yellow metal enters consolidation mode for the rest of September given the lack of price movers in the market. Investors already knew the Federal Reserve will not taper until November or December.

Resistance: 1860, 1910, 1950

Support: 1797, 1768, 1728


Economic Data


Currency

Data

Time (GMT + 8)

Forecast

JPY

GDP (QoQ) (Q2)

7:50

0.4%

USD

JOLTs Job Openings (Jul)

22:00

10.000M

CAD

BoC Interest Rate Decision

22:00

0.25%

CAD

Ivey PMI (Aug)

22:00


GBP

Inflation Report Hearings 

23:00


CAD

BOC Press Conference

Tentative


Daily Market Analysis

Market Focus

Global stocks rose for a seventh day and U.S. equity-index futures rallied as investors bet slower hiring in the world’s largest economy may delay a tapering of Federal Reserve stimulus. Aluminum hit a decade high amid political unrest in Guinea.

MSCI Inc.’s gauge of world stocks gained for a fourth day even as U.S. markets were closed for Labor Day. In Europe, the Stoxx Europe 600 Index rose the most in six weeks, led by technology shares. Contracts on the S&P 500 Index climbed 0.2%. Aluminum supplier Norsk Hydro ASA jumped to a 13-year high in Oslo. Gold bounced between losses and a gain of 1.9%.

The latest U.S. jobs report threw traders’ calculations awry after they braced for an announcement of tapering at the Fed’s September meeting. The world’s largest economy added only 235,000 jobs in August — the smallest gain in seven months — boosting chances of a delay in that announcement.

“Expectations of a delay in Fed tapering as well as a new administration in Japan is supporting equity markets and we expect this to continue,” said Sebastien Galy, senior macro strategist at Nordea Investment Funds. “Buy-on-dip is as robust as ever, taking negative news such as U.S. nonfarm payrolls as good news which is typical of an advanced carry trade.”

Aluminum hit the highest in over a decade as political unrest in Guinea fueled concerns over supply of the raw material needed to make the metal. A unit of the military seized power and suspended the constitution, raising the possibility of disruption to bauxite shipment from the key global supplier.


Main Pairs Movement:

After slumping to a three-week low last Friday, the US dollar rebounded back on the first day of new trading week. The strong selling pressure on US dollar last Friday was caused by disappointing Nonfarm Payrolls data, as the report missed the market expectation of 750,000 by a wide margin. The DXY index is at 92.222 as of writing, rising 0.11% on a daily basis. Trading conditions remain thin due to the Labor Day holiday in the US. But concerns about slowing global growth supported the safe-haven currency, therefore, lifted the greenback up to post a moderate comeback.

EUR/USD and GBP/USD both declined on Monday amid stronger US dollar across the board, trading at 1.1868 and 1.3834, respectively. EUR/USD was trading lower on Monday, once falling under 1.1860 level and posted a 0.08% loss on the day as of writing. The European Central Bank will release its interest rate decision on Thursday.

USD/JPY advanced today, as the pair gained positive traction first, then steadily hovering around 109.8 level during American session. The pair is trading at 109.84 and posted a 0.014% gain on the day as of writing.

Gold slipped on Monday, as the raising demand of US dollar weighed on the metal throughout the day. Gold’s movement seems to be a correction of last Friday’s upsurge. The precious metal is now trading at 1822.94, losing 0.17% on a daily basis. WTI Crude Oil, in a similar way, dropped more than 0.4% on Monday.


Technical Analysis:

GBPUSD (4-hour Chart)

The GBP/USD pair declined on the first day of a new trading week, dropping below 1.3820 level at one time. The pair was surrounded by selling pressure and failed to bounce back during American trading hours. The cable was last seen trading at 1.3828, losing 0.25% on the day as of writing. The bearish movement witnessed in GBP/USD is result from the raising demand of US dollar. Meanwhile, looming Brexit concerns between the UK and the European Union over the Northern Ireland protocol also weighed on the British Pound. For technical aspect, RSI indicator 55 figures as of writing, suggesting tepid bull-movement ahead. But the MACD indicator shows a negative histogram and a death cross, which indicates a bearish signal.

In conclusion, we think market will be bearish as long as the 1.3892 resistance line holds. As for the Bollinger Bands, price is falling from the upper band and crossing above the moving average, as a result, the lower band becomes the loss target.

Resistance: 1.3892, 1.3958

Support: 1.3767, 1.3731, 1.3680, 1.3602


USDCAD (4- Hour Chart)

The USD/CAD pair was trading higher on Monday, then failed to climb higher during European session. The pair is trading at 1.2530 at the time of writing, posting a 0.05% gain on a daily basis. Following last two week’s slip, USD/CAD rebounds slightly amid stronger US dollar and the selling pressure witnessed in crude oil prices. For technical aspect, RSI indicator 39 figures as of writing, suggesting bear-movement ahead. For the Bollinger Bands, the price is now sitting between the lower band and the moving average, which also indicates a bear market.

In conclusion, we think market will be bearish as the pair is heading to retest the 1.2494 support, a break below that level will open the door for additional near-term losses. And the next support is at 1.2453. On top of that, the Bank of Canada will announce its interest rate decision on Wednesday, as the market expect BoC to raise rates in the second half of 2022 when inflation consistently hit 2%.

Resistance: 1.2559, 1.2638, 1.2708

Support: 1.2494, 1.2453, 1.2422


AUDUSD (4- Hour Chart)

The AUD/USD pair retreated on Monday and tooked a hit in early trade during Asian trading hours. It has been hovering around 0.7435 since then. The raising demand of US dollar and concerns about Delta cases are both putting pressure on AUD/USD. Victoria and New South Wales remain under lockdowns as Covid cases continue to rise. At the time of writing, the pair is trading at 0.7433, losing 0.22% on the day. For technical aspect, RSI indicator 66 figures as of writing, suggesting that the market is near the overbought zone, investors should note for possible selling signals. The MACD also falls below the signal line, which means the pair is likely to experience downward momentum.

In conclusion, we think market will be bearish as long as the 0.7478 resistance line holds. For Bollinger Bands, the pair is now falling from the upper band after touching it, which indicates a bear market. Furthermore, Reserve Bank of Australia will release its interest rate decision on Tuesday, the focus will be whether the RBA delays its tapering plans due to Covid-19 epidemic.

Resistance: 0.7478, 0.7534

Support: 0.7395, 0.7356, 0.7285


Economic Data

Currency

Data

Time (GMT + 8)

Forecast

AUD

RBA Interest Rate Decision

(Sep)

12:30

0.10%

AUD

RBA Rate Statement

12:30


EUR

German ZEW

Economic Sentiment

(Sep)

17:00

30.0


VT Markets The Adjustment Of Weekly Dividend Notification

Dear Client,

Warmly reminds you that the component stocks in the stock index spot generate dividends. When dividends are distributed, VT Markets will make dividends and deductions for the clients who hold the trading products after the close of the day before the ex-dividend date.

Indices dividends will not be paid/charged as an inclusion along with the swap component. It will be executed separately through a balance statement directly to your trading account, the comment for which will be in the following format “Div & Product Name & Net Volume ” .

Please note the specific adjustments as follows:

Note: The above data is for reference only, the actual execution data may be changed, please refer to the MT4 software for details.

If you’d like more information, please don’t hesitate to contact trading@vtmarkets.com.

Daily Market Analysis

Market Focus

Disappointment over the U.S. August payroll report is all but certain to push Federal Reserve policy makers to delay considering a move to scale back asset purchases at their Sept. 21-22 meeting.

The addition of 235,000 jobs last month, falling well short of forecasts and the smallest jobs gain in seven months, suggests U.S. central bankers will need to see additional gains before starting to slow bond buying, economists said Friday following the Labor Department release.

Officials wants to see “substantial further progress” in jobs and inflation, and the hiring slowdown — blamed on a flare-up in Covid-19 cases — means moves in November or December are now more likely.

Stocks barely budged after Bloomberg News reported that Democratic lawmakers are considering slapping an excise tax on stock repurchases or treating them as taxable dividends as a way to offset some spending proposals.

On the face of it, that could see corporations slow the flood of cash into buybacks — some $370 billion already this year — that some argue props up share prices. But a possible proposal by one party, even the one with control of both legislative bodies, is a very long way from becoming law.

And if it did become enacted, the chances that the tax would have a meaningful impact on stocks remains low, money managers argued. With government spending and Federal Reserve largesse juicing the economy, dip-buyers have yet to let the S&P 500 Index decline by much more than 4% this year before swooping in.

The S&P 500 was little changed near an all-time high in trading volume 20% below the 30-day average, with many investors starting early on the three-day weekend.


Main Pairs Movement:

Non-US currencies flourished against the US dollar amid a devastating jobs report on Friday. August’s Non-Farm Payrolls figure printed 235,000, far missing anticipated 750,000. The concerning data indicated recovery in the labor market remains stalled. Spiking delta variant infections could contribute to the slowdown.

Today’s ugly NFP figure may foreshadow September’s number, which the Federal Reserve is desperately praying for. Given the importance between school season and parents’ availability, September’s NFP will critically determines the fate of Fed’s tapering program. It has to deliver a perfect report, similar to the one in July, in order to start unwinding its asset purchases.

Gold gained 1% to close the day around $1830. Judging from the performance in the US labor market, Gold should be well placed in an upward trajectory. However, big Gold ETF’s holding is somewhat contrary to current trend. The SPDR Gold ETF reduces holdings in the yellow metal by 103,000 ounces for the week of August 30th, the lowest volume recorded since last April. This suggests current incline in price may be temporary or pure speculative, and position could reverse quickly.


Technical Analysis:

XAUUSD (Daily Chart)

Gold climbed to one-month high of $1830 amid disappointing jobs data in the United States. The precious metal has made a remarkable comeback from a mini flash crash on August 9th, surged nearly 9% from the lowest point in the past six-months. Price is battling with a stubborn resitsance at $1830 handle. However, the sustained pressure is likely to ease this time around.

The big miss in NFP report provided strong incentives for central bank policy makers to further delays the timing of tapering asset purchases, which in turn deepens market concerns of short term inflation outrunning Fed’s policy. For the time being, price will rest around $1830 to close the week. But given the pessimism surrounding today’s NFP report, we believe plenty of institutional investors will at least increase the hedge positions in Gold, therefore lifting price. In the north, Gold will look to break $1830, and advance to 23.6% Fibonacci resistance of $1860. The high of $1910 may be a bit overstrenched in the near term, but could definitely be a target for further Fed’s dovish tone.

Resistance: 1860, 1910, 1950

Support: 1797, 1768, 1728


GBPUSD (Weekly Chart)

Cable pulled off a remarkable run since last March’s big plunge, but has been trapped in consolidation zone between 1.39 and 1.36 recently. This pair gained 0.93% during this week thanks to weaker dollar demand.

After spending two-months trading beneath the SMA20 on the weekly chart, it finally has another opportunity to contest this dynamic resistance. Furthermore, a decending trendline failed to cap price under, which could signal the beginning of a bullish reversal. We still need today’s strong momentum to carry over to next week in order to complete a trend reversal.

On the upside, buyers could be eyeing to take down 1.4 hurdle, which opens up doors to May’s high of 1.423. Downside risk will be cushioned by 1.374, followed by 1.36.

Resistance: 1.4, 1.423

Support: 1.374, 1.36


NZDCHF (Daily Chart)

NZDCHF is on the tenth winning streak, rose 4.5% in two weeks. This pair broke above a seven-months downward tunnel with robust buying bias. It is about to hit the upper bollinger band, which conincides with 38.3% Fibonacci of 0.6567. We expect it to briefly touch this level before any pullbacks could materialize. The RSI indicates price is on the cusp of stepping into overbought zone, and could help to cool off an overheated bull.

All in all, we see further upside gains in NZDCHF in a longer investment horizon. A modest retreat could be very healthy to sustain such bullish trend. On the south, a good rebounding point would be 50% Fibonacci support of 0.65, followed by 0.644.

Resistance: 0.6567, 0.6645, 0.677

Support: 0.65, 0.644, 0.6353


Economic Data

Currency

Data

Time (GMT + 8)

Forecast

EUR

German Factory Orders (MoM) (Jul)

14:00

-1.0%

EUR

IHS Markit Construction PMI (Aug)

15:30

GBP

Construction PMI (Aug)

16:30

56.9

Daily Market Analysis

Market Focus

Stocks rose ahead of a key jobs report that will shape bets on the path of interest rates and the Federal Reserve’s massive bond-buying program. The S&P 500 closed at a fresh record, with energy and industrial shares among the biggest gainers. Technology underperformed. The U.S. probably added 725,000 jobs in August — a more moderate pace compared to each of the prior two months, but stronger than gains seen early this year. Atlanta Fed President Raphael Bostic said “we’re going to let the economy continue to run until we see signs of inflation,” before stepping in on rates.

Democrat senator Joe Manchin is demanding a “strategic pause” in action on President Joe Biden’s economic agenda, potentially imperiling the $3.5 trillion tax and spending package that Democratic leaders plan to push through Congress this fall.

“By placing a strategic pause on this budgetary proposal, by significantly reducing the size of any possible reconciliation bill to only what America can afford and needs to spend, we can and will build a better and stronger nation for all our families,” Manchin said in the op-ed.

Manchin’s resistance to the core of Biden’s economic plan caps a politically painful month for a White House that has grappled with a chaotic withdrawal from Afghanistan, a resurgent pandemic and a massive hurricane that cut a path of death and damage from Louisiana to New York.

In comments Wednesday at an event hosted by the West Virginia Chamber of Commerce, the moderate Democrat said his party should “hit the pause button.” Lawmakers, he said, have too many other pressing issues before them, including heightening national security concerns after the Taliban takeover of Afghanistan.

“Let’s sit back. Let’s see what happens. We have so much on our plate,” he said.


Main Pairs Movement:

The US dollar declined and gave a poor performance on Thursday, dropping to the lowest level since August 6 during American trading hours. The DXY index is at 92.226 as of writing, losing 0.29% on a daily basis. The greenback continues its bearish traction ever since Fed Chair Jerome Powell’s dovish speech last week. Market worries about that the rising US COVID-19 cases in recent weeks will stall the US economic recovery, therefore, postponed Fed’s bond tapering plan. Despite better-than-expected US economic data released today, as Initial Jobless Claims reduced to 340K, the reports failed to help the US dollar gather strength. Investor now wait for the critical US Nonfarm Payrolls this Friday, which reflects the recovery condition of US economy.

EUR/USD and GBP/USD both advanced on Thursday amid weaker US dollar across the board, trading at 1.1875 and 1.1833, respectively. EUR/USD recorded a fresh four-week high during American trading hours, climbing above the 1.1874 level and posting a 0.31% gain on the day as of writing.

USD/JPY edged lower today, hovering around 110 level most of the time. The pair is trading at 109.93 and posted a 0.04% loss on the day as of writing.

Gold slipped on Thursday, touching a two-day low during American session. The recent strong bullish momentum witnessed in the global equity markets continued to weigh on traditional safe-haven assets like gold. The precious metal is now trading at 1810.24, losing 0.17% on a daily basis. WTI Crude Oil, on the contrary, soared more than 2.1% on Thursday.


Technical Analysis:

GBPUSD (4-hour Chart)

The GBP/USD pair made a good showing on Thursday, as the pair gained bullish momentum and climbed above 1.3800 level during American trading hours. The cable was last seen trading at 1.3835, rising 0.48% on the day as of writing. The bullish movement witnessed in GBP/USD is result from the diminishing demand of US dollar, meanwhile the improving market mood pushs Wall Street’s main indexes higher. For technical aspect, RSI indicator 68 figures as of writing, suggesting that the market is bullish, and the buying pressure is relatively higher. As for the Bollinger Bands, the price moves out of the upper band, indicates that a strong upward trend continuation can be expected.

In conclusion, we think market will be bullish as the pair heads to test the 1.3850 resistance. A break above that level will open the door for additional near-term profits. And the next resistance is at 1.3878. On top of that, UK Services PMI will be released on Friday, which is a leading indicator of UK overall economic performance.

Resistance: 1.3850, 1.3878

Support: 1.3731, 1.3680, 1.3602


USDCAD (4- Hour Chart)

The USD/CAD pair tumbled on Thursday, touching the lowest level since August 16 during American session. The pair is trading at 1.2557 at the time of writing, posting a 0.49% loss on a daily basis. The surging oil prices and a weaker US dollar across the board both weighed on the USD/CAD pair, as it surrounded by heavy selling pressure. For technical aspect, RSI indicator 37 figures as of writing, suggesting bear-movement ahead. If we take a look at MACD indicator, a death cross should be taken as a selling signal.

In conclusion, we think market will be bearish as the pair failed to break the 1.2654 resistance, now heading to test the 1.2533 support. For the Bollinger Bands, the price is now at the outside of the lower band so a strong downward trend continuation can be expected. But if the price starts to move back inside the band, investors should pay attention to trend reversal. In addition to that, the risk flows keep pushing oil prices higher, therefore benefits the commodity-linked loonie.

Resistance: 1.2654, 1.2708

Support: 1.2533, 1.2502, 1.2453


AUDUSD (4- Hour Chart)

The AUD/USD pair was trading higher on Thursday and pushed higher during American session. AUD/USD gave a remarkable performance amid US dollar’s weakness and reached the highest level since August 5. The US economic data released today failed to support the greenback. At the time of writing, thr pair is trading at 0.7401, rising 0.50% on the day. For technical aspect, RSI indicator 75 figures as of writing, suggesting that the market is in overbought zone, which is an obvious selling signals for investors.

In conclusion, we think market will be bearish as long as the 0.7416 resistance line holds. For Bollinger Bands, the pair is now falling from the upper band after touching it, which indicates a bear market. Furthermore, Australia Retail Sales will be released on Friday, this is the foremost indicator of consumer spending.

Resistance: 0.7416, 0.7487

Support: 0.7356, 0.7303, 0.7222


Economic Data

Currency

Data

Time (GMT + 8)

Forecast

AUD

Retail Sales (MoM)

09:30

0.5%

GBP

Composite PMI (Aug)

16:30

55.3

GBP

Services PMI (Aug)

16:30

55.5

USD

Nonfarm Payrolls (Aug)

20:30

750K

USD

Unemployment Rate (Aug)

20:30

5.2%

USD

ISM Non-Manufacturing PMI (Aug)

22:00

61.5


VT Markets Sep futures rollover announcement

Dear Client,

New contracts will automatically rolled-over as follows:

Please note:

• The rollover will be automatic, and any existing open positions will remain open.

• Positions that are open on the expiration date will be adjusted via a rollover charge or credit to reflect the price difference between the expiring and new contracts.

• To avoid CFD rollovers, clients can choose to close any open CFD positions prior to the expiration date.

• Clients should ensure that take profits and stop losses are adjusted before this rollover occurs.

If you have any questions, our team will be happy to answer your questions.Please mail to trading@vtmarkets.com or contact the service online.

Daily Market Analysis

Market Focus

Megacap companies rallied to an all-time high as traders turned to defensive shares after the latest round of economic data suggested a slowdown in the labor-market recovery.

The NYSE FANG+ Index of pandemic darlings such as Apple Inc. and Amazon.com Inc. climbed about 1.5%. Tech, utilities and real-estate firms in the S&P 500 advanced, while energy and financial stocks fell. The benchmark gauge of American equities pared gains in afternoon trading, while still heading toward another record. The Dow Jones Industrial Average was little changed.

一張含有 文字 的圖片

自動產生的描述

U.S. companies added fewer jobs than expected in August, ADP Research Institute data showed. While manufacturing expanded at a stronger-than-estimated pace, supply-chain bottlenecks were accompanied by labor constraints. Those figures came before Friday’s payrolls data, with economists expecting a deceleration from the rapid gain in the prior month and a drop in the unemployment rate.

Meantime, Citigroup Inc.’s Tobias Levkovich is sticking to his bearish call. The bank’s chief U.S. equity strategist predicts the index will end the year at 4,000 before reaching 4,350 by June 2022. Both levels sit below its last close of 4,522.68. Underpinning his view are stretched valuations and a planned tax rise that will hurt corporate profits.

Chinese stocks listed in the U.S. are gaining for a third consecutive day as investor sentiment begins to recover after a selloff fueled by Beijing’s sweeping regulatory crackdown.


Main Pairs Movement:

The Dollar greenback weakened amid downbeat ADP report, with the dollar index down 0.14% on Wednesday. The ADP private payrolls increased by 374,000 in August, missing expectation of 613,000 by large margin. Though ISM Manufacturing PMI came on top of expectation, printed 59.9 compared to forecasted 58.6, but employment figures remain to be the main focus for both Federal Reserve and market watchers. A big miss on Friday NFP report could significantly hamper Fed’s mood to initial taper in October, while a mild deviation from expectation could set the stage for stronger dollar in the fourth quarter.

Aussie was the best performer among its G-7 peers, gained 0.7% on the day. The pair is extending its rally towards 0.74, and conquered multiple resistance line along the way. The second quarter GDP (QoQ) was 0.7%, beating anticipated 0.5%. This upbeat data added to Aussie strength against the US dollar on Wednesday. However, the recent leg higher is a corrective move and we expect upward momentum to recede during next week.

Oil prices slipped after Russian oil minister Alexander Novak said Russian companies are ready to boost production beyond current levels, which was set by OPEC+. The Brent Futures was down 0.49%.


Technical Analysis:

CHFJPY (Daily Chart)

一張含有 文字, 光, 電線, 夜晚 的圖片

自動產生的描述

CHFJPY is approaching the lower part of a big ascending tunnel, and threatened for a breakout to the downside. Prices have been choppy in the past few sessions as a smaller descending trendline is capping further upward movements.

There was a obvious double-top pattern highlighted in blue, and price is now coming back to retest the neckline. We’ve seen strong rejection on Monday, which engulfed the entirety of previous candle, and signals upcoming bearish moves.

To the downside, bears will have to settle a solid close beneath the ascending trendline in order to attract more sell volume. A horizontal support of 119.2 is not far from the pivotal point near 119.7. Further in the south, 50% Fibonacci of 118 handle could provide some support.

Resistance: 120.55, 122.8

Support: 119.2, 118, 116.9


EURUSD (Daily Chart)

Euro dollar has recovered most of losses in July. However this pair failed to overcome a downward trendline on Wednesday as selling bias remains robust for the sharerd currency.

Price traveled from the bottom of Bollinger Band all-the-way to the upper bound within few days, and there was not much frictions. We suspect the latest rally to be bears’ profit-taking, rather than a reversal. That being said, we could at least see move lower toward 23.6% Fibonacci of 1.18 in the next day or so.

Investors should be prudent to wait for Friday’s Non-Farm Payroll release to determine a much clear direction. On the upside, modest resistance sits around 1.19, next to 1.196. Conversely, bulls’ defense line would be around 1.18 and 1.166.

Resistance: 1.19, 1.196, 1.2

Support: 1.18, 1.166


XAUUSD (Daily Chart)

The picture for Gold was little changed as market participants are eyeing for Friday NFP report for fresh trading incentives. Price has overcame DMA20, and retraced to validate the breakout was solid. Yesterday’s attempt to break below $1800 was defended by 50% Fibonacci of $1804.

Looking at a broader picture, the precious metal previously underwent a double-top pattern. Price took a dive straight to $1690 after the neckline of the double-top was defeated. Normally, if price comes back to retest the neckline, it will meet abundant pressure around this level.

The fact that current trade pattern failed to fulfill this thesis suggests short positions have been overwhelmed by longs. Therefore, we do not expect to see a significant pullback in the near term. That being said, price looks to advance further into 61.8% Fibonacci resistance around $1830.

Resistance: 1830, 1863, 1917

Support: 1804, 1777, 1744


Economic Data

Currency

Data

Time (GMT + 8)

Forecast

AUD

GDP (QoQ) (Q2)

09:30

0.5%

CNY

Caixin Manufacturing PMI (Aug)

09:45

50.2

EUR

German Manufacturing PMI (Aug)

15:55

62.7

GBP

Manufacturing PMI (Aug)

16:30

60.1

USD

ADP Nonfarm Employment Change (Aug)

20:15

613K

USD

ISM Manufacturing PMI (Aug)

22:00

58.6

USD

Crude Oil Inventories

22:30

-3.088M

Daily Market Analysis

Market Focus

The stock-market euphoria abated in the last trading day of August as investors assessed whether lofty valuations could withstand the unwinding of pandemic-era stimulus. S&P 500 dropped from an all-time high, Nasdaq slid 0.04%, and Dow Jones declined 0.11%. Wells Fargo & Co. (NYSE: WFC) tumbled after news reported that the bank risks regulatory action over the pace of restitution. Traders also sifted through data showing a slide in U.S. consumer confidence and a surge in home prices.

Five years into scandals that have already cost Wells Fargo & Co. more than $5 billion in fines and legal settlements, regulators are privately signaling they’re still not satisfied with the bank’s progress in compensating victims and shoring up controls.

The Office of the Comptroller of the Currency and the Consumer Financial Protection Bureau have warned the firm they may bring new sanctions over the company’s pace in fulfilling those obligations, according to people with knowledge of the situation. The bank, which signed so-called consent orders with the agencies three years ago, has sought more time to get the work done, the people said. It isn’t clear when the watchdogs might proceed.

The bank’s stock erased earlier gains and slumped 5.6% in regular New York trading on Tuesday, its biggest drop since mid-June, after Bloomberg reported on regulators’ concerns.

Fresh sanctions would be especially notable if they fault progress under Wells Fargo’s new management team, which took over in late 2019 to clean up scandals that triggered lawmakers’ ire and prompted the Federal Reserve to cap the bank’s growth. Chief Executive Officer Charlie Scharf — who joined the firm after a string of predecessors stepped down — has called satisfying U.S. authorities his highest priority.


Main Pairs Movement:

Despite trying to bounce back during American session, the US dollar edged lower on Tuesday and once dropped to a three-week low. The DXY index is at 92.672 as of writing, losing 0.02% on a daily basis. The Conference Board’s Consumer Confidence showed a disappointing outcome as it declined to 113.8 in August, which is lower than market’s expectation of 124.0. Investor now wait for the US Nonfarm Payrolls this Friday, which reflects the recovery condition of US economy.

EUR/USD and AUD/USD both advanced on Tuesday amid weaker US dollar across the board, trading at 1.1806 and 0.7312, respectively. EUR/USD recorded a three-week high during European trading hours, climbing above the 1.1840 level for a time. But the pair then retreated modestly back, posting a 0.09% gain on the day. The Eurozone Core CPI YoY showed a remarkable reading of 1.6%, which provided bullish momentum for the EUR/USD pair.

USD/JPY also rose today, climbing above the 110 level during American session. The pair is trading at 110.03 and posted a 0.1% gain on the day as of writing.

Gold posted a decent gain on Tuesday, as it rebounded strongly from daily low during American session. The decline witnessed in European trading hours might be a correction of last week’s rally. The precious metal is now trading at 1814.51, rising 0.28% on a daily basis. WTI Crude Oil, on the contrary, slumped more than 0.84% on Tuesday.


Technical Analysis:

GBPUSD (4-hour Chart)

The GBP/USD pair was trading higher on Tuesday, rising above the 1.3800 level. However, the bullish momentum didn’t last long as the pair pulled back during American session. The cable is losing 0.07% on the day at the time of writing. The bearish movement witnessed in GBP/USD is result from the raising demand of US dollar, as the greenback rebounded in the second half of the day. For technical aspect, RSI indicator 50 figures as of writing, suggesting no obvious trend now. But for Bollinger Bands, the price is falling from the upper band and crossing below the moving average, which indicates a selling signal and the lower band becomes the loss target.

In conclusion, we think market will be bearish as the pair heads to test the 1.3734 support. A break below that level will open the door for additional near-term losses. And the next support is at 1.3680. On top of that, UK Manufacturing PMI will be released on Wednesday, a higher-than-expected data should be taken as positive for the British Pound.

Resistance: 1.3833, 1.3878, 1.3949

Support: 1.3734, 1.3680, 1.3602


USDCAD (4- Hour Chart)

The USD/CAD pair advanced on Tuesday, touching a fresh two-day high during American session. The pair then retreated modestly back as of writing, posting a 0.19% gain on a daily basis. USD/CAD was lifted up by both disappointing GDP report in Canada and strong selling pressure surrounding the crude oil. These two reasons further weighed on the Canadian dollar. For technical aspect, RSI indicator 46 figures as of writing, suggesting selling pressure is slightly higher. If we take a look at MACD indicator, a near-zero Diff points out that the trend may reverse in the near future.

In conclusion, we think market will be bearish as the pair failed to break the 1.2670 resistance. The price is now falling from the 20 SMA line in the Bollinger Bands, which also indicates a selling signal. In addition to that, the EIA will released US Crude Oil Inventories on Wednesday and the commodity-linked loonie is likely to be affected.

Resistance: 1.2670, 1.2708, 1.2834

Support: 1.2570, 1.2502


AUDUSD (4- Hour Chart)

The AUD/USD pair was trading higher on Tuesday and recorded a two-week high right before the European trading hours, but it pulled back to 0.7310 level during American session. The pair was benefited by weaker US dollar across the board, rising 0.27% on the day. For technical aspect, RSI indicator 61 figures as of writing, suggesting bull-movement ahead. For Bollinger Bands, the pair is now trading between upper band and moving average, which indicates a bull market.

In conclusion, we think market will be bullish as long as the 0.7303 support line holds. The pair is now trying to test the 0.7341 resistance while further profits can be expected if price break above that level. The market focus now shifts to Australia’s GDP report on Wednesday.

Resistance: 0.7341, 0.7381

Support: 0.7303, 0.7285, 0.7237


Economic Data

Currency

Data

Time (GMT + 8)

Forecast

AUD

GDP (QoQ) (Q2)

09:30

0.5%

CNY

Caixin Manufacturing PMI (Aug)

09:45

50.2

EUR

German Manufacturing PMI (Aug)

15:55

62.7

GBP

Manufacturing PMI (Aug)

16:30

60.1

USD

ADP Nonfarm Employment Change (Aug)

20:15

613K

USD

ISM Manufacturing PMI (Aug)

22:00

58.6

USD

Crude Oil Inventories

22:30

-3.088M

Daily Market Analysis

Market Focus

Stocks climbed, led by some of the world’s largest technology companies. Traders also assessed the impacts from Tropical Storm Ida, which sank insurers and energy firms, while pushing gasoline higher.

The S&P 500 notched its 12th all-time high in August, and the Nasdaq 100 rallied as Apple Inc.’s market value topped $2.5 trillion. Robinhood Markets Inc. and Charles Schwab Corp. slid as Securities and Exchange Commission’s Chairman Gary Gensler told Barron’s that a full ban of payment for order flow is “on the table.” Zoom Video Communications Inc. sank in late trading after giving a sales forecast that fell short of some analysts’ estimates.

As the earnings season draws to a close, the S&P 500 is on track for its seventh straight monthly advance — the longest winning streak since January 2018. Federal Reserve Chair Jerome Powell did just enough last week to preserve the view that his goals align with investors’: growth that is fast enough to boost hiring and corporate profits, but not inflation. U.S. pending home sales fell in July, while traders looked to Friday’s payrolls data for a guide as to whether there’s any slowdown.

A few days after Prime Minister Scott Morrison called for an independent international probe into the origins of the coronavirus, Chinese bots swarmed on to Australian government networks. It was April 2020.


Main Pairs Movement:

The dollar index traded in tight range on Monday amid UK’s Bank Holiday and a scarce economic calendar, gained as little as 0.03%. Momentum from Jackson Hole failed to carry over to Monday’s session, and raise question whether speculators are fully buying into the divorce between tapering and rate hikes. Powell explicitly stated the timing of rolling back Fed’s current asset purchases does not necessarily imply anything about lifting interest rates. Powell tried his best to cushion the downside risk in equity market with some dovish speech, but also mentioned the labor market is well on course of a recovery, therefore fueling a persistent bullish run in stocks market. For now, market’s primary focus remains to be the timing and amount of the long-eyed taper program.

The Swiss Franc was the weakest performer within the G-7 space, lost 0.63% and 0.56% against the US dollar and the Euro respectively. The independent move in the Franc series might suggest institutional investors might be positioning for SNB’s potential intervention to curb CHF’s strength. “We still think the fundamental outlook points to a weaker Franc ahead, but it will take some stabilization in the global growth outlook for this trend to resume”, commented by analysts at Goldman Sachs.


Technical Analysis:

GBPNZD (Daily Chart)

GBPNZD has been sitting conformtably inside the Bollinger Band for several months, indicating this currency pair was little affected by recent dollar driven headlines such as last week’s Jackson Hole Symposium. That does not mean there is little trading opportunity in this pair, in fact GBPNZD is reaching a pivotal point where a breakout from below could provide strong sell incentives. Price has gradually receded toward a support zone between 1.96 and 1.966, which sellers failed to penectrate since June. This support band also coincides with a decent ascending trendline, adding strengths to bulls’ defense. If bears could pull off a mirrical breakthrough from current levels, then they could look to capitalize further downside spaces. But we believe the heavy defense line will hold-off, and price looks to rebound from here.

Resistance: 1.981, 2.0,

Support: 1.96, 1.939, 1.92


AUDUSD (Daily Chart)

Aussie continues its descending trend as price was capped under DMA20 since June. It is also meeting horizontal resistance at 23.6% Fibonaaci of 0.732, measured from 0.738 to August’s low of 0.7107. The recent V-shaped recovery acts more like correction rather than a bullish reversal after RSI stepped into oversold region. Selling bias should still be robust given the uncertainties surrounding the Delta-variant, risk appetite could stage a significant pullback if infections persist to be higher.

The fact that Aussie is not carrying over its gains from last Friday’s dollar unfriendly speech suggests the surge was a one-time off move. We believe AUDUSD will edge lower in the near term, at least prior to Friday’s Non-Farm Payroll release.

Resistance: 0.732, 0.743, 0.76

Support: 0.723, 0.711, 0.7


XAUUSD (Daily Chart)

Gold pared some of its gains from last Friday’s surge, which was powered by Powell’s somewhat dovish tone. Price has overcame DMA20, and retraced to validate the breakout was solid, then followed by some bullish moves.

Looking at a broader picture, the precious metal previously underwent a double-top pattern. Price took a dive straight to $1690 after the neckline of the double-top was defeated. Normally, if price comes back to retest the neckline, it will meet abundant pressure around this level. The fact that current trade pattern failed to fulfill this thesis suggests short positions have been overwhelmed by longs. Therefore, we do not expect to see a significant pullback in the near term. That being said, price looks to advance further into 61.8% Fibonacci resistance around $1830.

Resistance: 1830, 1863, 1917

Support: 1804, 1777, 1744


Economic Data

Currency

Data

Time (GMT + 8)

Forecast

CNY

Manufacturing PMI (Aug)

09:00

50.2

EUR

German Unemployment Change (Aug)

15:55

-40K

EUR

CPI (YoY) (Aug)

17:00

2.7%

CAD

GDP (MoM) (Jun)

20:30

0.7%

USD

CB Consumer Confidence (Aug)

22:00

124.0

VT Markets Notification of trading adjustment in holiday

Dear Client,

Please note that adjustment on following products due to Labor Day ,Mid Autumn Festival and Heritage Day.

If you have any questions, our team will be happy to answer your questions. Please mail to trading@vtmarkets.com or contact the service online.

Back To Top
server

Hello there 👋

How can I help you?

Chat with our team instantly

Live Chat

Start a live conversation through...

  • Telegram
    hold On hold
  • Coming Soon...

Hello there 👋

How can I help you?

telegram

Scan the QR code with your smartphone to start a chat with us, or click here.

Don’t have the Telegram App or Desktop installed? Use Web Telegram instead.

QR code