Daily Market Analysis
Market Focus
U.S. equities notched their biggest weekly decline since mid-June in volatile trading as investors assessed the latest read on the economy after more strategists weighed in with cautious comments on the market.
The S&P 500 fell 0.8%, pushing its loss for the holiday shortened week to 1.7%. Apple Inc. was the biggest decliner in the Dow Jones Industrial Average on Friday, after a court ordered the iPhone maker to make a change to the way it generates money from its App Store. Gold posted its first weekly decline since early August after data on U.S. producer prices rekindled debate over when the Federal Reserve will pull back on stimulus.
Markets have been volatile as the continued spread of Covid-19 has undermined the economic recovery and lifted supply-shock inflation, even as central banks reaffirm an accommodative stance. In the U.S., equities have been whipsawed amid mixed economic data and a lack of clarity on the Fed’s timeline for reducing its asset purchases. On Friday, data showed the producer price index for final demand, a key measure of inflation, increased more than expected last month.
Strategists from almost all the top Wall Street banks have come out this week with a nervous message about the U.S. stock market. The common themes in their analysis include valuations at historical extremes, a near non-stop rally for seven months, an economy that looks soft and the imminent tapering of Fed stimulus.
Apple dropped 3.3%, the most since earl May. A federal judge said Friday that the company must let app developers steer consumers to outside payment methods.
In Europe, the Stoxx 600 fell 0.3%, with telecommunications and utilities underperforming, while miners and technology led the gainers. The European equities benchmark posted a second weekly loss, the first time that’s happened since the end of April, as investors reduced their risk on concern that central bank stimulus measures might get pulled back quickly.


Main Pairs Movement:
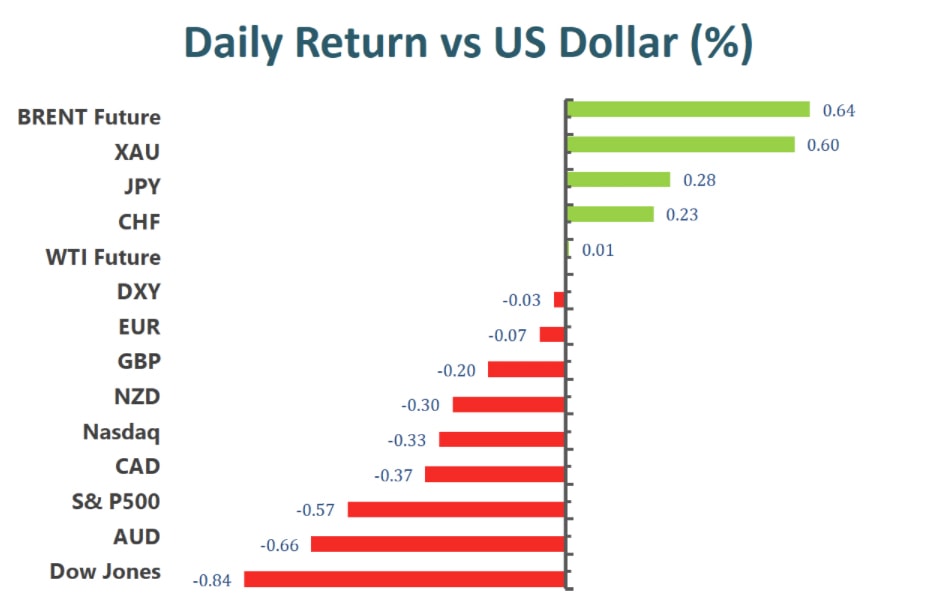
Most commodity currencies gained against the dollar after a call between U.S. President Joe Biden and Chinese leader Xi Jinping boosted risk sentiment, despite U.S. stocks fluctuating on growth concerns.
Traders on Friday were also focused on trade tensions with China. The Biden administration is weighing a new investigation into Chinese subsidies after the U.S. president urged China’s Xi Jinping to cooperate on a phone call.
The Canadian dollar touched a session high after the country’s employment report showed job growth beating estimates, rising 90.2K versus the 68.2K forecast; USD/CAD is edging lower to 1.2658, after dropping as much as 0.6%.
EUR/USD edges lower to 1.1816; pair rose as much as 0.2% to 1.1851 earlier end to active week of hedging. Swiss franc and Japanese yen weakened against the dollar Friday; USD/JPY advances 0.2% to 109.93. The pound shrugged off data showing the U.K.’s economic rebound ground to a halt in July, with focus on a hawkish tilt from the Bank of England; GBP/USD gains less than 0.1% to 1.3844
Technical Analysis:
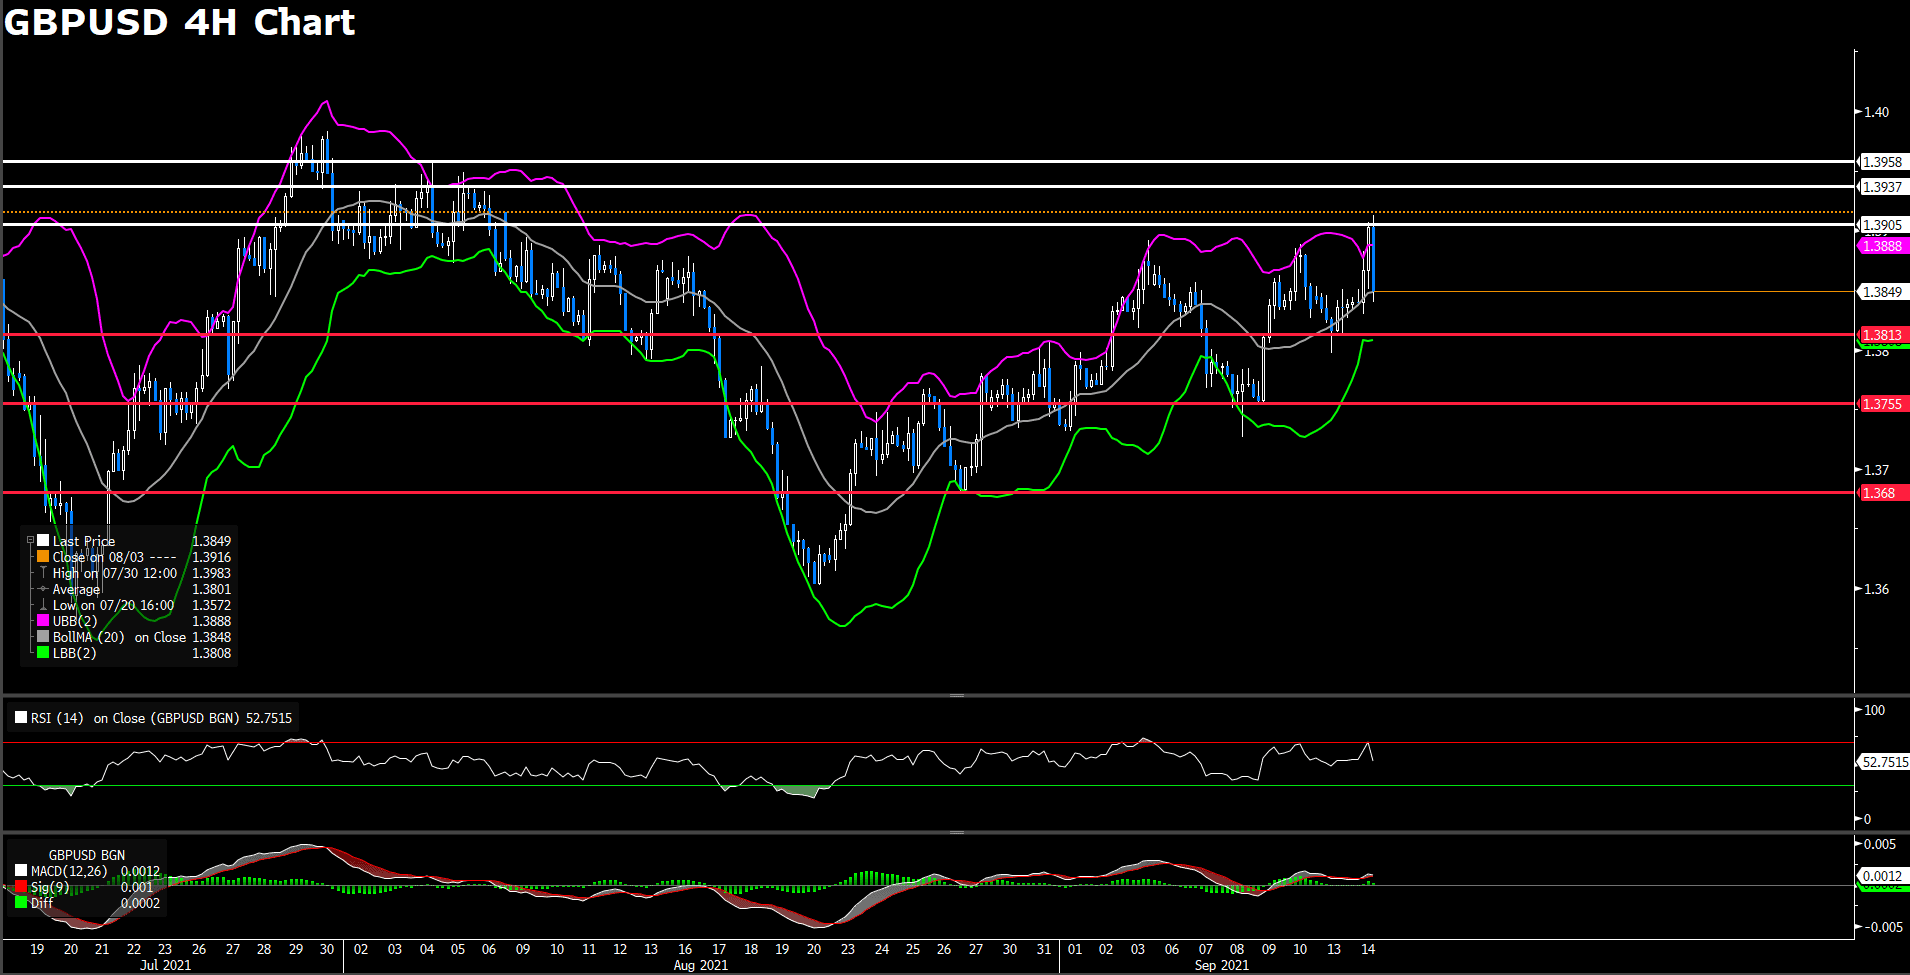
GBPUSD (4-hour Chart)

The GBP/USD pair advanced on Friday, reaching a fresh weekly high around 1.3888 level. But the pair failed to preserve its bullish traction afterwards, retreating back during American trading hours. The cable was last seen trading at 1.3851, rising 0.11% on the day as of writing. The Bank of England Governor Andrew Bailey’s hawkish comments on Wednesday provided some bullish momentum for GBP/USD, he said that half of the MPC members believe the basic conditions for a rate hike had been met.
For technical aspect, RSI indicator 58 figures as of writing, suggesting bull-movement ahead. The MACD also rises above the signal line, which means the pair is likely to experience upward momentum. In conclusion, we think market will be bullish. As for the Bollinger Bands, the price is now sitting between the upper band and the moving average, which also indicates a bull market.
Resistance: 1.3892, 1.3949, 1.3983
Support: 1.3751, 1.3680, 1.3602
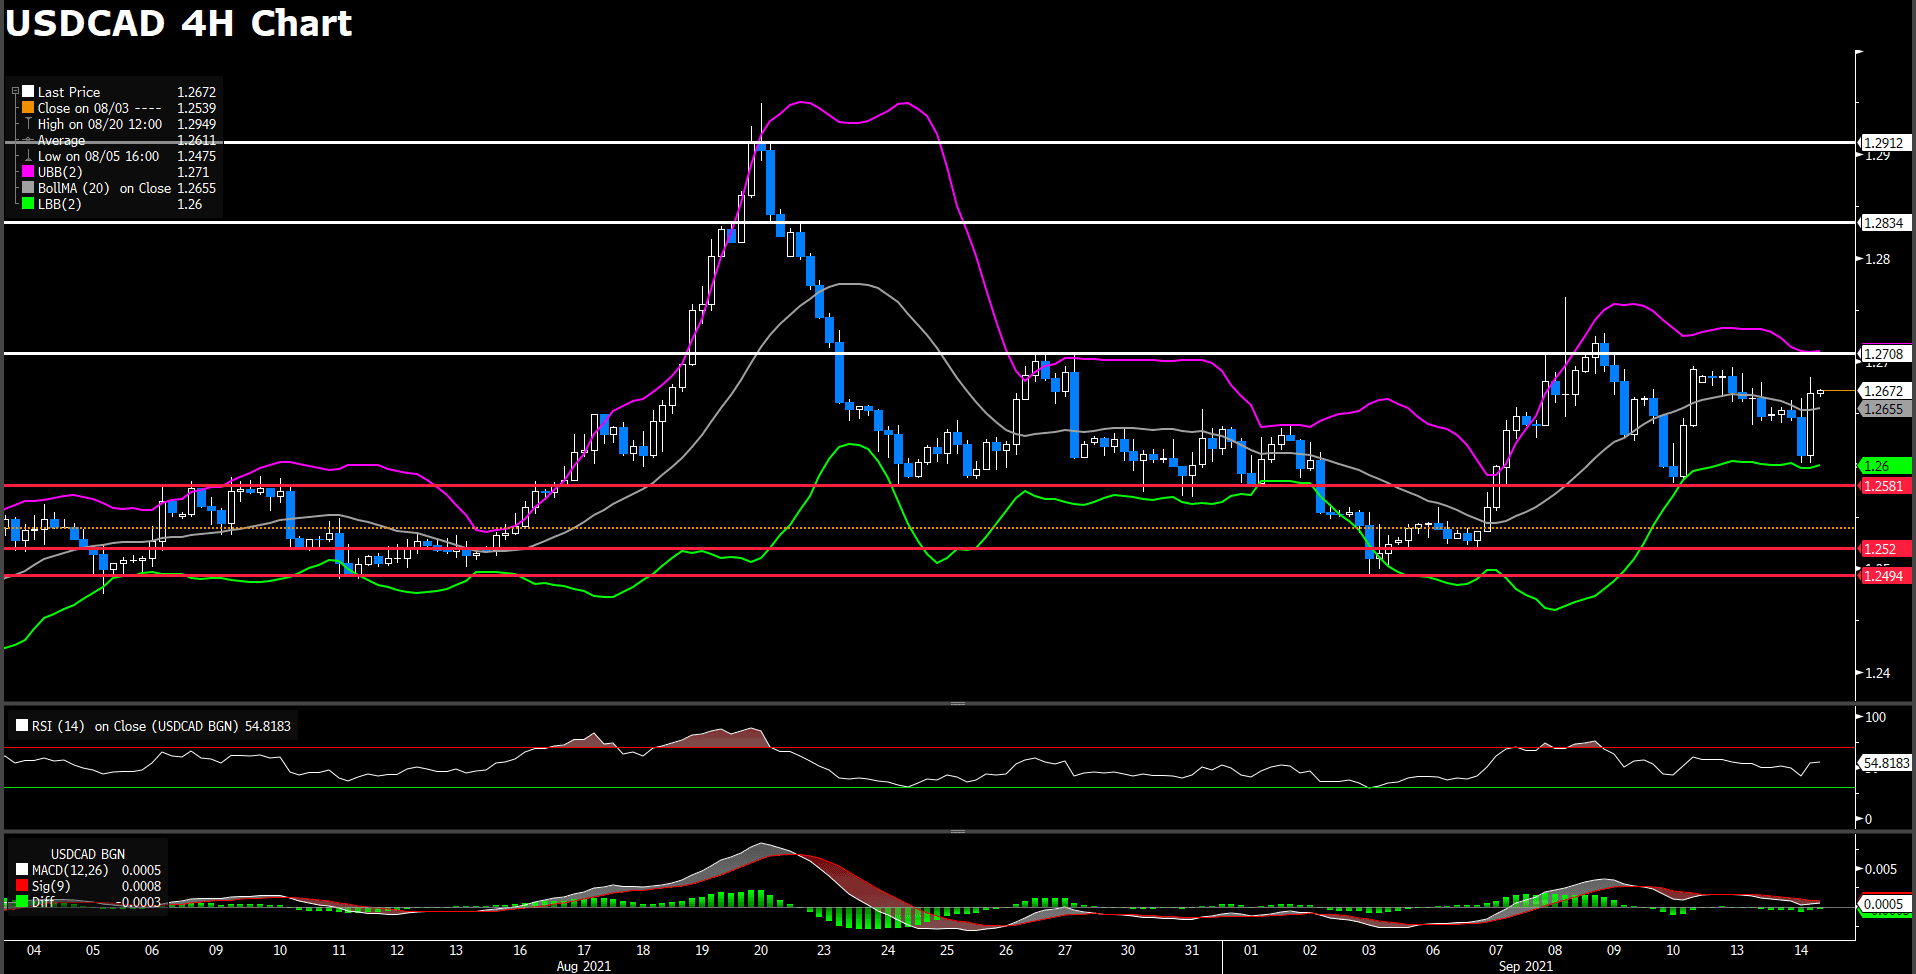
USDCAD (4- Hour Chart)

The USD/CAD pair was surrounded by heavy selling pressure during European trading hours, touching a three-day low on Friday. Fortunately, the pair have rebounded back to 1.264 level after American session began, offsetting half of its losses for the day. The pair is trading at 1.2643 at the time of writing, posting a 0.16% loss on a daily basis. The larger-than-anticipated drop in the unemployment rate in Canada, which down to 7.1% in August, giving a boost for the Canadian dollar. On top of that, crude oil prices surged 2.4% for the day, which also set the bullish tone for the commodity-linked loonie.
For technical aspect, RSI indicator 51 figures as of writing, suggesting that there is no obvious trend now. But the Bollinger Bands shows that the price rises from the lower band and it’s moving toward the SMA line, which indicates a bull market. In conclusion, we think market will be bullish as the pair heads to test the 1.2673 resistance, a break above that level will open the door for additional near-term profits. The next resistance sits at 1.2728.
Resistance: 1.2673, 1.2728
Support: 1.2583, 1.2552, 1.2520
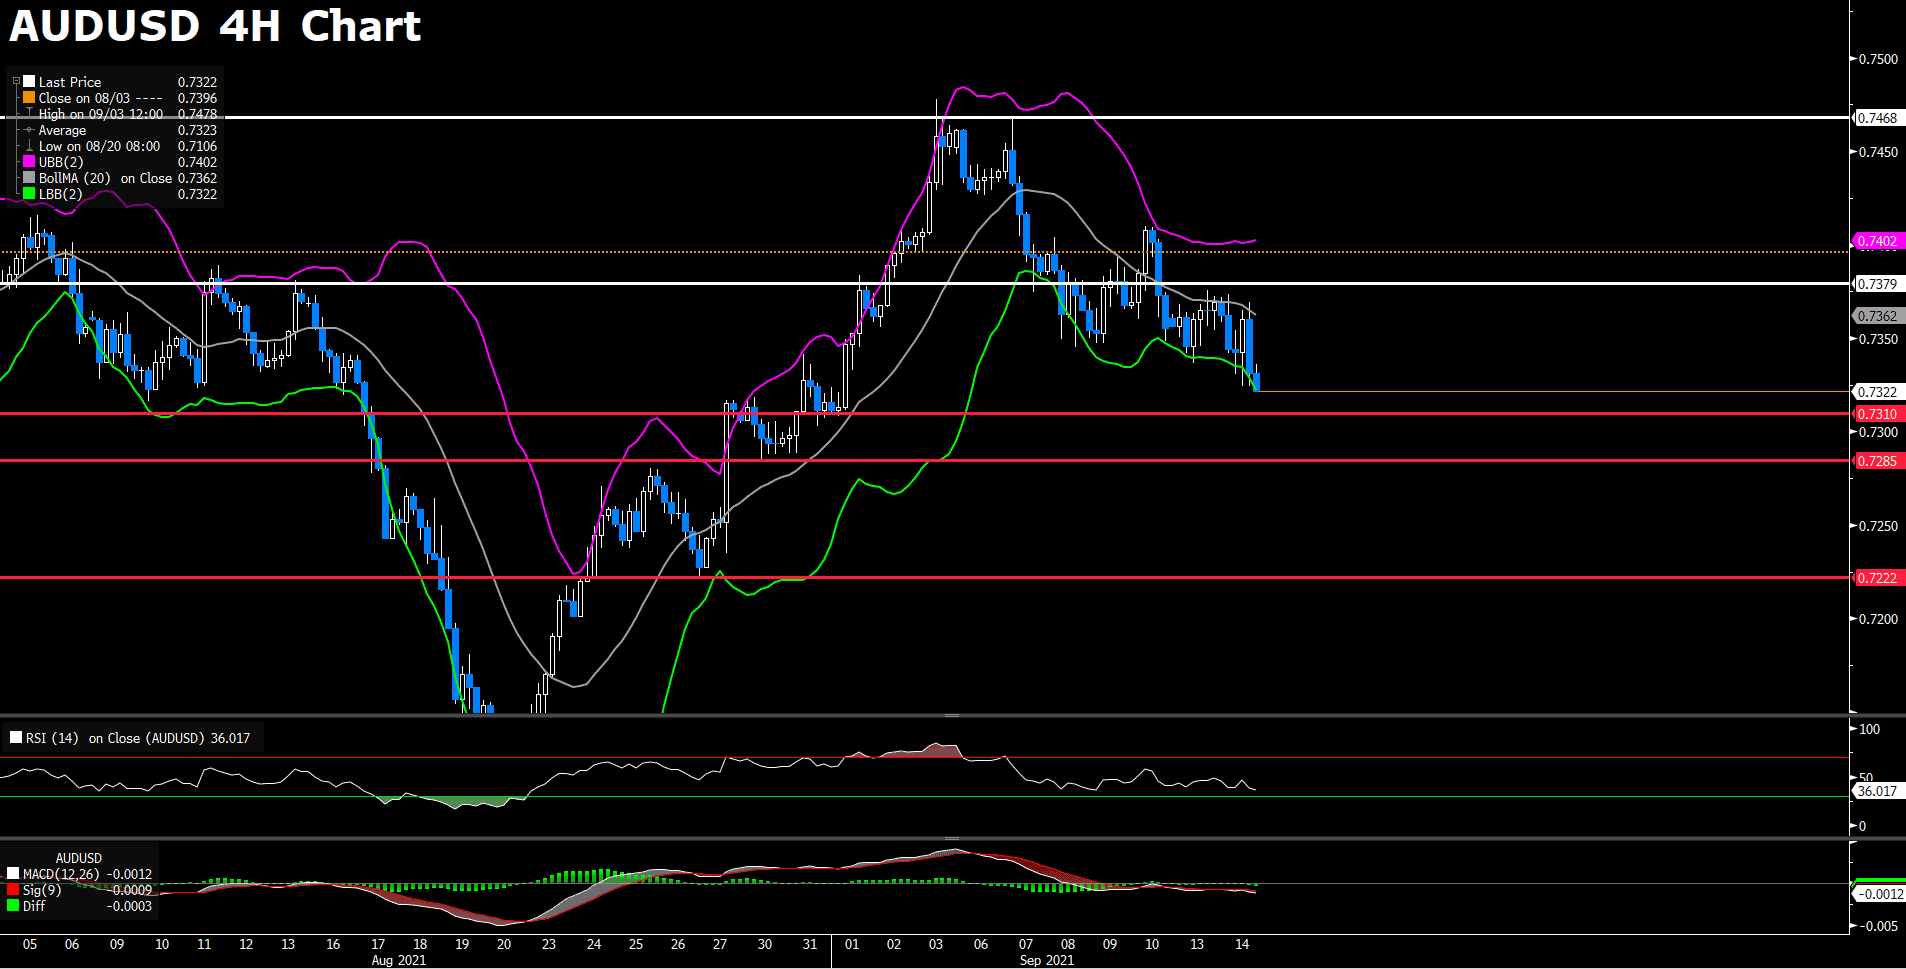
AUDUSD (4- Hour Chart)

The AUD/USD pair gave a remarkable performance in the first half of the day, rising above 0.7405 level. But it’s a whole different story once the American session begins. The pair lost its bullish momentum and dropped sharply, eliminating most of its profits for the day. A rebound witnessed in US dollar weighed on the AUD/USD, as the market mood turns cautious ahead of the weekend. Therefore, the demand of the safe-haven dollar is increasing. At the time of writing, the pair is trading at 0.7365, rising merely 0.01% for the day.
For technical aspect, RSI indicator 43 figures as of writing, suggesting tepid bear-movement ahead. For Bollinger Bands, price is falling from the upper band and crossing below the moving average, as a result, the lower band becomes the loss target. In conclusion, we think market will be bearish as the pair is now heading to test the 0.7345 support.
Resistance: 0.7427, 0.7455
Support: 0.7345, 0.7285, 0.7222, 0.7106
Economic Data
|
Currency
|
Data
|
Time (GMT + 8)
|
Forecast
|
|
OIL
|
OPEC Monthly Report
|
19:00
|
|
|
|
|
|
|
|
|
|
|
|
|
|
|
|
|
|
|
|
|
|
|
|
|
|
|
|
|
|
|
|
|
|
|
|
|
|
|
|
|
|
|
|
|
|
|
|
|
|