VT Markets Adjustment of Trading Hours in Australia DST

Dear Client,

Please note change of the following products after Daylight Savings Time in Australia begins in October 4th, 2021.

The details as shown in the table below.

If you’d like more information, please don’t hesitate to contact trading@vtmarkets.com.

Daily Market Analysis

Market Focus

US stock advanced on Friday amid turmoil in global stock market earlier in the week. Despite the hawkish tone from Fed after the meeting this week and the contagion risks from China Evergrande Group’s debt crisis, US stock finished in the positive territory for a third day. Investors believed that the US economy recovered in a steady pace and has met the central bank’s conditions for starting to reduce its bond purchases soon, as some of the Fed bank presidents supported starting bond tapering in November and concluding them over the first half of next year.

The benchmarks, S&P 500 and Dow Jones both advanced on Friday. The S&P 500 was up 0.2% on a daily basis, showing a late day rebound after fluctuating throughout most of the session. The energy, communicate service and financials sectors are the best performing among all groups, climbed 0.84%, 0.69% and 0.55%, respectively. The Nasdaq, on the contrary, posting a 0.1% loss for the day.

一張含有 文字 的圖片

自動產生的描述

Surprisingly, the S&P 500 and the Dow Jones ended the week with gains amid uncertainty surrounding the indebted real-estate giant Evergrande Group. But for investors, this can be a challenging weekend for holding weekend risk given the ongoing and still developing scenario around Evergrande.

In Asia, China said that crypto-related transactions will now be considered as illegal financial activity, therefore, bitcoin tumbled alongside with crypto-related shares. Investors now remain vigilant about the next step of China regulators.


Main Pairs Movement:

US dollar advanced on Friday, bouncing back from Thursday’s slide as it touched a daily high before the American session. But the greenback failed to preserve its bullish momentum after breaking the 93.4 level and closed at 93.277. The safe-haven dollar was benefited from the uncertainty over Chinese property developer Evergrande Group and bounced back from its biggest one-day percentage drop in about a month on Thursday. Investors worried about a default by China Evergrande Group as the company missed a Thursday deadline for paying $83.5 million. To sum up, US dollar strengthened on Friday amid hawkish Fed and the Evergrande risks, rising 0.19% on a daily basis.

EUR/USD and GBP/USD both declined on Friday amid stronger US dollar across the board, losing 0.15% and 0.33% for the day, respectively. EUR/USD dropped to a daily low during European trading hour but recovered modestly after declining to 1.1700 area. The risk-averse market environment weighed on the pair as the greenback to continue to outperform its rivals during the day.

Gold rose on Friday, rebounding slightly from Thursday’s slump. But the prospects for an earlier rate hike move by the Fed and the Bank of England kept a lid on any meaningful gains for gold. The precious metal posted a 0.45% gain on a daily basis. WTI Crude Oil, in the same way, climbing more than 1% on Friday.


Technical Analysis:

GBPUSD (Daily Chart)

Tradingview

GBPUSD acelerated its slump, trading under 1.3700. The tumble trimmed almost half of its post BOE gains as the market concerns about the shifting tone of the Fed from dovish to hawkish. From the technical perspective, the intraday bias remains downside as the currency pair continues trading below the descending trendline; at the same time, previous bounce- up seems to be temporary from the double top trading pattern. As a result, the pair loses its bullish strength today. Moreover, according to the RSI, it has not yet reached the oversold territory, which indicates that the bearish move continues to keep up its momentum. The fall will accelerate if the pair falls below 1.3605. On the contrary, GBPUSD needs to trade above 1.3835 to reverse from bearish to bullish.

Resistance: 1.3726, 1.3835, 1.3905

Support: 1.3604, 1.3441


Gold (Daily Chart)

Tradingview

Gold tumbled, failing to recover above $1,750 region, after the Fed and BoE turned hawkish this week. Resurgent US dollar demand exerted additional pressure on the precious metal, gold. From the technical aspect, any subsequent decline is likely to find its immedicate support at 1740.85; the decline might find it hard to extend losses below the support level as the RSI has reached the oversold territory, minimizing the selling pressure. If gold ends up falling below the support level and ascending trendline, then it will acelerate the downside toward its next support at $1,683.34. On the flip side, $1,786 looks to act as an immediate hurdle, above the level will give bulls an opportunity to challenge the 200- SMA.

Resistance: $1,786, $1,817.71

Support: $1,740.85, $1,683.34


USDJPY (4- Hour Chart)

Tradingview

USDJPY gained traction for the third consecutive day as the US dollar obtained strength from the Fed’s hawkish tone. As the time of writing, USDJPY has reached multi- week tops, trading around 110.73 region. From the technical aspect, the intraday bias looks to be bullish as the pair trades along the ascending trendline. At the moment, the pair is contesting its immediate resistance at 110.704; if the pair successfully breach the resistance, then it will acelerate the upside momentum toward the recent peak at 111.576. However, the pair is going to confront a firm obstacle as the RSI has over- reached the overbought condition, almost at the 80th threshold. That being said, the bullish momentum has a high possibility to be held. The pair might consolidate in the price range of 110.698 and 110.155 until the RSI gets cool- down.

Resistance: 110.698, 111.576

Support: 110.155, 109.716


Economic Data

Currency

Data

Time (GMT + 8)

Forecast

EUR

ECB President Lagarde Speaks

19:45

N/A

USD

Core Durable Goods Orders (MoM) (Aug)

20:30

N/A

Daily Market Analysis

Market Focus

US stock advanced on Thursday amid risk-on market sentiment, as investors embraced the Federal Reserve’s bullish economic outlook. After the two-day FOMC meeting, Fed has turned more hawkish and is expected to reduce bond purchases in November at the earliest. Generally, a hawkish Fed should be bearish for equity market. But surprisingly, the hawkish tone from Fed is welcomed by investors as it was seen as a confirmation of substantial progress in economy recovery. Additionally, gold declined and oil rose.

The benchmarks, S&P 500, Dow Jones and Nasdaq both rose on Thursday as they rode the waves of positive risk sentiment. S&P 500 was up 1.2% on a daily basis, the index registered its biggest two-day gain since July. Nine out of eleven sectors posted a gain as the energy and financials sectors are the best performing among all groups, rose 3.41% and 2.50%, respectively. Real estate .and utilities were the only major groups to end lower on the day. The Dow Jones gained the most of 1.5%.

一張含有 文字 的圖片

自動產生的描述

On top of that, the Bank of England moved closer to raising interest rates after officials said developments appear to have strengthened the case for modest tightening. Therefore, the British pound rallied on Thursday.

In Asia, Financial regulators in Beijing instructed China Evergrande Group to avoid a near-term dollar bond default. China also said to have told the company to focus on completing unfinished properties and repaying individual investors. For now, there is no indication that regulators offered financial support to Evergrande Group for the bond payment yet, and concerns of an Evergrande failure continues.


Main Pairs Movement:

The 2-day long Fed meeting concluded with signals from the FOMC that tapering should start relatively soon and a revised rate hike schedule, which could begin by, as early as, 2022. Besides the FOMC minutes, markets were also moved by a report that Chinese authorities signaled reluctance to bail out Evergrande, despite the Chinese Government’s continued effort to inject more cash into the financial system; furthermore, the Chinese regulators have instructed Evergrande to avoid near-term default on bonds. The combination of the two events boosted investor sentiment and a risk-on investing scene, as most U.S. indices continues to rise for the second day in a row.

Cable rose against the dollar, as the Greenback weakened due to investors redirecting funds into a “risk on” equity market environment. The Pound was also fueled by the increasingly hawkish stance of the BoE. The redirecting on funds and “risk on” sentiment hurt gold, as the precious metal tumbled throughout the trading day.


Technical Analysis:

GBPUSD (4-hour Chart)

Cable traded lower during the European trading session, but the pair would rebound, significantly, once the Asia and American trading session began. Broad Greenback weakness and risk-on sentiment in equity markets have propelled Cable to its 3 day high. The BoE’s increasingly hawkish tone also added to the Pound’s strength against the Dollar. As of writing, Cable has broken through our previously estimated resistance level of 1.3687 and the pair is trading at 1.3747.

From the technical aspect, Cable successfully defended the 1.36 support level and quickly broke through the 1.3687 resistance level. Near term resistance for Cable will sit at around the 1.378 price level. RSI for the pair sits at 61.5, indicating modest over buying in the market. As of writing, Cable is trading above the 50, 100, and 200 day SMA.

Resistance: 1.3687, 1.381, 1.3851

Support: 1.3627, 1.3603


USDCAD (4- Hour Chart)

USD/CAD reversed course for the day as the Dollar loses steam, and brought the pair below our previously estimated support level of 1.2752. During the earlier part of the trading session, USD/CAD was able to repair some losses from the previous trading day, but the pair quickly lost ground once the American trading session began. The Canadian July retail sales declined, although actual figures fared better than analyst estimates.

From the technical aspect, USD/CAD broke through the 1.2752 support level and is currently trending towards the nearest support level of 1.2635. RSI for the pair is at 35.47, indicating modest over selling. As of writing, the pair is trading at the lower bound of the bollinger bands, and the pair is trading below its 50, 100, and 200 day SMA.

Resistance: 1.2834, 1.2912

Support: 1.2752, 1.2635, 1.2586


XAUUSD (4- Hour Chart)

XAU/USD tumbled as equity markets heated up; furthermore, a weaker Dollar did not help the pair, as investors adopt the “risk-on” sentiment. Increasingly hawkish tone from the Fed and BoE did little to help gold as U.S. bond yields soared and flows redirected away from the non-yielding precious metal. Cash injection by the People’s Bank of China further eased equity investors’ concerns.

From the technical aspect, XAU/USD has found some support at the 1748 price level, but, if investors continue to move away from the safe haven asset, XAU/USD could trend down towards its next immediate support level of 1725. RSI for the pair sits at 36, as of writing, indicating modest over selling. The pair is trading below its 50, 100, and 200 day SMA.

Resistance: 1778.52, 1804.06, 1830.72

Support: 1748.82, 1725.47


Economic Data

Currency

Data

Time (GMT + 8)

Forecast

JPY

National CPI (MoM)

07:30

JPY

Services PMI (Sep)

08:30

EUR

ECB’s Elderson Speaks

19:50

USD

Fed Chair Jerome Powell Speaks

22:00

USD

New Home Sales (MoM) (Aug)

22:00

714K

VT Markets The Adjustment Of Weekly Dividend Notification

Dear Client,

Warmly reminds you that the component stocks in the stock index spot generate dividends. When dividends are distributed, VT Markets will make dividends and deductions for the clients who hold the trading products after the close of the day before the ex-dividend date.

Indices dividends will not be paid/charged as an inclusion along with the swap component. It will be executed separately through a balance statement directly to your trading account, the comment for which will be in the following format “Div & Product Name & Net Volume ” .

Please note the specific adjustments as follows:

Note: The above data is for reference only, the actual execution data may be changed, please refer to the MT4 software for details.

If you’d like more information, please don’t hesitate to contact trading@vtmarkets.com.

Daily Market Analysis

Market Focus

US stocks advanced on Wednesday, even though Federal Reserve officials signaled that bond tapering would probably start in November at the earliest. During a press conference, Fed Chair Jerome Powell also said that mid-2022 could be the end of tapering, which means if Fed announces tapering in November, it will create an eight-month taper process. Stock markets ignored Fed’s tapering hints amid mixed details. On top of that, Gold and oil both rose, as the decline in crude oil inventories was more than expected.

The benchmarks, S&P 500, Dow Jones and Nasdaq both rose on Wednesday. S&P 500 was up 1% on a daily basis, the index rebounded from a two-month low and recorded the biggest climb since July. Wednesday was also the first time for S&P 500 to finish in positive territory in five trading sessions. Nine out of eleven sectors posted a gain as the energy and financials sectors are the best performing among all groups, rose 3.16% and 1.58%, respectively. The Nasdaq gained the most of 1.02%.

一張含有 文字 的圖片

自動產生的描述

The Federal Reserve kept interest rate unchanged at 0.25%, same with market’s expectations. But the policymakers are divided over the rate hike, now expecting a start from either 2022 or 2023 versus the previous support for 2023. For investors now, the timeline of bond tapering and any shifts in expectations for rate hike are crucial information.

In Asia, stock markets declined on Wednesday amid concerns about Evergrande group’s debt crisis. But China avoided a major selloff after the country’s central bank boosted its injection of short-term cash into the financial system. In Japan, BOJ left its interest rate policy unchanged, Japanese yen dropped.


Main Pairs Movement:

Despite lingering effects from China’s Evergrande credit issue, markets advanced on Wednesday’s trading as investors turn their attention to the Fed’s bond tapering timetable and interest rate projections. As of writing, all major U.S. indices have gained from yesterday’s slump. The two-day meeting of the FOMC yielded a marginally more hawkish tone of the Fed and a potential start date for scaling back pandemic era monetary measurements. The minutes of the meeting also indicated a potential rate hike projected to start, as early as, 2022 as long as the Fed’s employment and inflation goals continue to be met.

The U.S. dollar index slipped at the release of the FOMC minutes, thus benefiting most currency pairs against the dollar; however, when Fed Chair Jerome Powell gave his speech, market sentiment changed quickly, and the dollar soared, hurting currencies against the dollar.


Technical Analysis:

GBPUSD (4-hour Chart)

Cable began trading lower at the start of the European session, but the pair will find support at around the 1.362 price level. Cable quickly rebounded from the session’s low once the American trading session began, and the pair saw a quick boost once the FOMC minutes were release. The dollar weakened against the backdrop of the Fed’s, newly found, hawkish tone, despite the Fed’s commitment to keep near term bond purchsing measures unchanged.

From the technical aspect, Cable traded below our estimated support level of 1.3641 for the first half of the trading day, but the American trading session brought the pair back to positive territory. The near term resistance level of 1.3687 remains unbroken;however, Fed Chair Jerome Powell’s speech, scheduled for later today, might compromise that resistance level if the Greenback continues to weaken against the pound. RSI for the pair indicated a neutral 42, as of writing. Cable is, currently, trading above the 50, 100, and 200 day SMA.

Resistance: 1.3687, 1.381, 1.3851

Support: 1.3627, 1.3603


USDCAD (4- Hour Chart)

An upbeat market sentiment has strengthened the loonie against the dollar. Ahead of the FOMC minutes release, USD/CAD was, once again, rejected from the resistance level of 1.2834; however, once the minutes were released, the dollar weakened and brought the pair below our previously estimated support level of 1.2752.

From the technical aspect, USD/CAD continues to see downward pressure near the 1.28 price level. The 1.2752 support level did not hold for the pair as the dollar continues to weaken on the back of the FOMC’s announcements. As of writing, RSI for the pair sits at 52, indicating neutral buying; furthermore, the pair is trading above the 50, 100, and 200 day SMA.

Resistance: 1.2834, 1.2912

Support: 1.2752, 1.2635, 1.2586


AUDUSD (Daily Chart)

AUD/USD continues to be range bound between 0.722 and 0.728. The FOMC minutes release brough a short spike to AUD/USD, but the spike was not sustainable and the pair is again traindg lower, as of writing. The Auddis dollar continues to be depressed due to poor employment figures and the strong economic ties between China and Australia. The increasingly hawkish tone of the Fed also provides a negative outlook for the pair.

From the technical aspect, AUD/USD successfully defended the 0.7222 support level in the early part of the trading session; however, this support level will be tested again as the dollar begins to gain strength after FED chair Jerome Powell’s speech. As of writing, RSI for AUD/USD sits at 42, and the pair is trading below the 50, 100, and 200 day SMA.

Resistance: 0.728, 0.7332, 0.7375

Support: 0.7222, 0.7117


Economic Data

Currency

Data

Time (GMT + 8)

Forecast

USD

FOMC Economic Projections

02:00

USD

FOMC Statement

02:00

USD

Fed Interest Rate Decision

02:00

0.25%

BRL

Interest Rate Decision

05:00

6.25%

SGD

CPI (Aug)

13:00

2.4%

EUR

Manufacturing PMI

16:00

60.3

GBP

Composite PMI

16:30

GBP

BoE MPC Meeting Minutes

19:00

USD

Initial Jobless Claims

20:30

320K

CAD

Core Retail Sales (MoM)

20:30

-1.5%

Daily Market Analysis

Market Focus

US stocks declined near the end of trading on Tuesday, edging lower for the day. Investors are now evaluating the risks from China’s strict regulations on the real-estate sector and this week’s Federal Reserve meeting. Markets await Wednesday’s update from the Fed as well as details about how the China government will respond the Evergrande crisis.

The benchmarks, S&P 500 and Dow Jones both dropped on Tuesday. The S&P 500 was down 0.1% on a daily basis, continuing its bearish traction for a fourth day. The index was opened higher but had a high volatility the whole day. The industrial, communicate service and utilities sectors are the worst performing among all groups, dropped 0.7%, 0.33% and 0.24%, respectively. The Nasdaq, on the contrary, posting a 0.1% gain for the day.

Investors are watching from the sidelines for the two-day Fed meeting that stared Tuesday, the potential timeline for bond tapering and any shifts in expectations for raising interest rates will both be pivotal for global stock market.

In Asia, Evergrande tumbles further after S&P Global Ratings says default is likely. Despite concerns about broader contagion still remain, things are looking up as Wall Street believes that China has it under control. Investors expect China will save its biggest real-estate firm, either directly or indirectly, from being like a Lehman saga. Evergrande Chairman and the International Monetary Fund’s (IMF) Chief Economist Gita Gopinath also sound optimistic in his latest speech and supported the brighter concerns.


Main Pairs Movement:

China’s Evergrande declined further on Tuesday’s trading, but the broad equity and currency markets bounced back on fresh dollar strength and investors are now turning their attention to Wednesday’s FOMC press conference and the Fed’s interest rate decisions. Despite spending returning to pre-pandemic level, the U.S. still posted fewer job gains, less than expected inflation in August, and some economic fatigue brought on by the resurgence of the Delta variant; thus, analysts are predicting that the September FOMC meeting would not result in a tapering commitment, rather analysts are expecting the Fed to remain dovish and the FOMC would keep quantitative easing measures intact for the near term.

Most USD based currencies declined for a second straight trading session as the Greenback gained fresh strength. Cable rebounded slightly at the beginning of today’s trading, but would decline once the North American trading session began. USD/CAD slipped during the European session, but recovered swiftly as the American trading session began. AUD/USD was also able to repair some of the losses from the previous trading day, but would lose ground as the American trading session began.


Technical Analysis:

GBPUSD (4-hour Chart)

Cable found support at around 1.3641 at the start of the trading day, and the pair continued to repair loss ground from yesterday’s trading. However, as the American trading session began and U.S. equity markets rallied, Cable once again traded lower as the dollar gained strength throughtout the American trading session.

From the technical aspect, Cable met resistance at the 1.3687 price level and was unsuccesful at breaking through it before the pair began trading lower. As of writing, Cable is trading at the lower bound of the bollinger bands, while RSI for the pair sits at 32.21, indicating some over selling in the market. Cable is trading below the 50, 100, and 200 day SMA.

Resistance: 1.3687, 1.381, 1.3851

Support: 1.3641, 1.3603


USDCAD (4- Hour Chart)

USD/CAD was unable to keep yesterday’s gain, instead, the pair slipped, as much as, 0.8% for the most part of Tuesday’s trading sessions, before finding support at around the 1.275 price level. Prime Minister Justin Trudeau successfully defended his, historical, third term, despite not winning a majority in the parliament and the popular vote. During his campaign, Prime Minister Trudeau has pledged to raise taxes on financial institutions and to impose stricter emission rules for the oil and gas sector.

From the technical aspect, USD/CAD continues to be rejected from the 1.2834 resistance level, but the pair has found higher levles of support at the 12752 price level. As of writing, USD/CAD is trading at the upper half of the bollinger bands and RSI for the pair indicates 60.11, suggesting mild over buying in the market. USD/CAD is trading above the 50, 100, and 200 day SMA.

Resistance: 1.2834, 1.2912

Support: 1.2752, 1.2635, 1.2586


AUDUSD (Daily Chart)

AUD/USD gained during the European session, the pair climbed to a session high of 0.7283 before the American trading session began. As the Greenback gained strenth, AUD/USD entered negative territory and is trading lower towards our estimated support level of 0.7222. The RBA Minutes, released today, failed to boost demand for the Aussie dollar. The Minutes showed the RBA’s continued dovish stance and no reversal in the RBA’s bond purhcasing program in light of weaker job postings in August.

From the technical aspect, AUD/USD has met new resistance at the 0.728 price level. As of writing, AUD/USD is trading at 0.7233, above our estimated support of 0.7222. The pair is trading at the lower bound of the bollinger bands, while RSI for the pair indicates 39.77, indicating mild under buying in the market. AUD/USD is trading below the 50, 100, and 200 day SMA.

Resistance: 0.728, 0.7332, 0.7375

Support: 0.7222, 0.7117


Economic Data

Currency

Data

Time (GMT + 8)

Forecast

CNY

PBoC Loan Prime Rate

09:30

JPY

BoJ Monetary Policy Statement

10:00

ZAR

Core CPI (MoM) (Aug)

16:00

0.2%

USD

Crude Oil Inventories

22:30

-2.4M

VT Markets The notification of new product launched

Dear Client,

To provide our clients with a wealth of trading options, VT Markets will launch new products on Sep 27, 2021.

With this launch, clients will have a total of 71 (51 + 20 new) US Shares CFDs to offer a more diversified portfolio in the hot US equity market.

The details as shown in the table below.

The above data is for reference only, please refer to the MT4/MT5 software for specific data.

Please note that a commission of 6.00 USD (Basic Currency) per side is charged for trading US Shares CFD products with VT Markets.

Please check our official page to get more detail about US shares CFD:
https://www.vtmarkets.com/trading/markets/us-cfd-shares

If you’d like more information, please don’t hesitate to contact trading@vtmarkets.com.

Daily Market Analysis

Market Focus

US stock declined on Monday, which was also the biggest fall in about four months. Concerns about China’s real-estate sector and a possible Fed bond tapering caused a plummet in global stock market. However, the S&P 500 index pared some losses in the last hour of trading, as traders started to buy the dip again. The bearish movement witnessed in S&P 500 was an opportunity to buy stocks amid improved global economic recovery.

The benchmarks, S&P 500, Dow Jones and Nasdaq both dropped on Monday. S&P 500 was down 1.7% on a daily basis, the index finished in the negative territory for a third day and erased its gains from earlier in the week. The energy, cons discret and financials sectors are the worst performing among all groups, dropped 3.04%, 2.37% and 2.22%, respectively. The Nasdaq fell to its lowest level in about a month.

US dollar and Treasuries both gained before Wednesday’s Fed meeting, as investors expect Fed to give more hints about the timetable of tapering. Strong US Retail Sales data also supported prospects of early Fed tapering, which would eventually be seen to take away the punch bowl for Wall Street.

In Asia, Hong Kong stocks slumped as investors tracked the risk of contagion from the debt crisis at China Evergrande Group. Evergrande executives are working to remedy its business prospects but a messy meltdown at worst or a managed collapse are feared. Therefore, a bailout by Beijing can be hoped as a best scenario for financial markets.


Main Pairs Movement:

Monday’s trading was marked by a broad market price correction and fears over the possible default of China’s property developer giant, Evergrande Group, which has one of the world’s largest debt burdens for any publicly traded real estate management or development company. Analysts have also pointed out that a price correction was due because of the long bull run that U.S. indices have enjoyed over much of 2021. The Hang Sheng Index dropped 3.3% to its lowest close since October.

All U.S. dollar based foreign exchange pairs fell as demand for the safe haven dollar increased amid concerns over China’s credit issue. Cable saw strong selling pressure at the beginning of Monday’s trading and is struggling to find support as trading continues through the day. USD/CAD rallied on the back of strong demand in the U.S. dollar. AUD/USD struggled, as well, on the dollar’s rally. Investors will be paying attention to the RBA minutes, which is scheduled to release on the 21st.


Technical Analysis:

GBPUSD (4-hour Chart)

Cable fell sharply on Monday as money flowed to the safe haven asset—the Greenback. After sliding around 0.2% on the previous trading day, Cable began today’s trading even lower. Losing north of 0.6% during the European trading session, GBPUSD was able to find some breathing room around the 1.3669 price level before the American trading session brought the pair to even lower territory. As of writing, Cable is trading at 1.3653, which is lower than our previously estimated support level of 1.3727.

From the technical aspect, Cable is trading at the lower bound of the bollinger bands and is currently trending towards the immediate support level of 1.3603. Cable has failed to defend the previously estimated support level of 1.368. Cable has fell below the 50, 100, and 200 day SMA. RSI for Cable sits at 31.90, suggesting some overselling in the market.

Resistance: 1.381, 1.3849, 1.3905

Support: 1.3603


USDCAD (4- Hour Chart)

During the American trading session, USD/CAD climbed to a one-month high of 1.2895. The pair has since settled back down to near the 1.28 price level, which is our previously estimated resistance level for USD/CAD. Rally for the pair was fueled by investors pouring money into the safe haven dollar as concerns over China has boiled over into the foreign exchange market. However, looking ahead into the week, there are significant events that could sway the pair in either direction. On the one hand, the election for the House of Commons is set to take place on Monday; on the other hand, the FED FOMC press conference is set to take place this Wednesday.

From the technical aspect, USD/CAD has broken through the 1.28 resistance level and came close to 1.29 during today’s trading. RSI for the pair sits at 72, as of writing, suggesting some over buying in the market. USD/CAD is trading above the 50, 100, and 200 day SMA and the pair is trading at the upper bound of the bollinger bands.

Resistance: 1.1806, 1.1894, 1.1965

Support: 1.1664


AUDUSD (Daily Chart)

AUD/USD suffered as investors rushed to the safe haven dollar as market sentiment sours. AUD/USD declined, as much as 0.7%, during the early hours of trading. The pair broke through our previously estimated support of 0.7285 and continued trading lower before finding support around our estimated level of support at around 0.7222. The RBA meeting, scheduled for Tuesday, will shed more light on the Australian central bank’s monetary policy direction. Having already scaled back its monthly bond buying measures, the RBA is expected to remain dovish. The credit issue in China could also have spilling over effects on the Aussie dollar, as China is one of the largest exporting country for Australia.

From the technical aspect, AUD/USD has fallen below the 0.7285 support level but has found support around 0.7222; however, if the pair continues to trade lower, the pair will not find support until around the 0.711 price level. RSI for the pair sits at 40.42, indicating a rather neutral buying sentiment. AUD/USD is trading below the 50, 100, and 200 day SMA.

Resistance: 0.7379, 0.7468

Support: 0.7222, 0.7117


Economic Data

Currency

Data

Time (GMT + 8)

Forecast

AUD

RBA Meeting Minutes

09:30

USD

Housing Starts (Aug)

20:30

1.555M

Daily Market Analysis

Market Focus

US stocks declined on Friday, touching the lowest levels in four weeks. Investors now are evaluating the resilience of the global recovery amid concerns about the delta virus and risks from China. On top of that, Friday is the day of quarterly expiration of options and futures, which can create volatility. Oil slipped, while gold advanced.

The benchmarks, S&P 500, Dow Jones and NASDAQ both dropped on Friday. S&P 500 was down 0.9% on a daily basis, the index edged lower for a second day and erased its gains from earlier in the week. The material, utilities and technology sectors are the worst performing among all groups, dropped 2.06%, 1.59% and 1.52%, respectively. The NASDAQ, in the same way, finished in positive territory for a third day. Global stock market struggled to maintain optimism in the face of a likely pending change in Fed’s taper plan, slower economic growth and high inflation.

From economic data’s angle, the University of Michigan’s preliminary sentiment index was released on Friday, showing that US consumer sentiment rose slightly but remained close to a decade low. High prices also result in deteriorated buying conditions. The Fed will probably hint at its meeting next week on the timeline of bond tapering and make a formal announcement in November.

In Asia, stock markets were mixed as the debt crisis at China Evergrande Group continued. Casino stocks extended their losses amid tightening regulations in Macau.


Main Pairs Movement:

US dollar advanced on Friday, touching the highest level since August 27. The Dollar Index started to gain bullish momentum in the beginning of American session and pushed higher after the U.S. Michigan Consumer Sentiment index released. Consumer confidence in the US improved modestly in September with the Index rising to 71 from 70.3 in August. This reading came in slightly weaker than the market expectation of 72.2. The DXY index rose 0.4% on a daily basis. Market focus now shifts to next week’s FOMC meeting, as investors expect Fed to give more hints about the timeline of bond tapering.

EUR/USD and GBP/USD both declined on Friday amid stronger US dollar across the board, losing 0.33% and 0.38% for the day, respectively. The EUR/USD pair continued its slide, dropping to a fresh monthly low during American trading hours. The Eurozone Core Consumer Price Index (YoY) rose by 1.6%, in line with expectations. Meanwhile, the Core CPI for August (MoM) also edged higher by 0.3%. As for the cable, Bank of England will announce their interest rate decision on September 23.

Gold advanced slightly on Friday. After climbing to a daily high during European session, gold lost its traction and dropped below $1,750 amid renewed USD strength. The precious metal posted a 0.05% gain on a daily basis. WTI Crude Oil, on the contrary, dropped more than 0.9% on Friday.


Technical Analysis:

GBPUSD (4-hour Chart)

GBPUSD trades under 1.3800 level, on the back foot after UK’s disappointed Retail Sales data, -0.9% in August. From the technical aspect, the intraday bias looks bearish as GBPUSD falls below the ascending trend line, indicating that the upside momentum has been overturned on the four- hour chart. The bearish move is expected to continue as the RSI has not reached the oversold territory, giving more rooms for the pair to extend further south. Bears might continue to head toward the next immediate support level at 1.3727.

Resistance: 1.3771, 1.3798, 1.3820

Support: 1.3727


EURUSD (4- Hour Chart)

EURUSD trades below 1.1800 level, remaining pressured after the US Consumer Sentiment missed estimates in September. From the technical perspective, EURUSD continues to trade negatively as the pair still trades within the descending channel. At the same time, technicals are pointing lower since the pair fails to climb above the 20 and the 50 SMAs. The RSI on the four- hour chart is above 30, thus outside oversold territory, whilst the MACD is negative, lending supports to bears; that being indicated, EURUSD is still on the downside. Nonetheless, the downside might face some obstacles as the pair has reached the lower bound of Bollinger Band, due for a pullback.

Resistance: 1.1806, 1.1894, 1.1965

Support: 1.1664


XAUUSD (Daily Chart)

From the technical aspect, the price of gold is currently in a descending triangle on the daily chart, with the bottom support line at 1756.90 and the resistance at around $1800. As mentioned earlier, the price of gold formed support near $1753 after a sharp drop on Thursday, and the RSI indicator was in the oversold area. Therefore, the next trend of gold should be able to take a breather with its small rebound. On the other hand, on the 1-hour chart, based on Fibonacci indicators, the short-term resistance is at the level of $1,765.58, and the next resistance is at the level of 1,778.62. All in all, the long term movement for the gold is downside.

Resistance: 1763.51, 1837.13, 1928.22

Support: 1689.89, 1598.80


Economic Data

Currency

Data

Time (GMT + 8)

Forecast

EUR

German PPI (MoM) (Aug)

14:00

0.8%

BRL

BCB Focus Market Readout

19:25

N/A

Daily Market Analysis

Market Focus

US stock declined on Thursday after swinging between gains and losses. Expiration of options and futures will be on Friday, which usually result in high volume and volatility. After seven months of gains, equity market has been choppier mid-way through September, but some market strategists believe that this is actually quite normal from a historical seasonal standpoint.

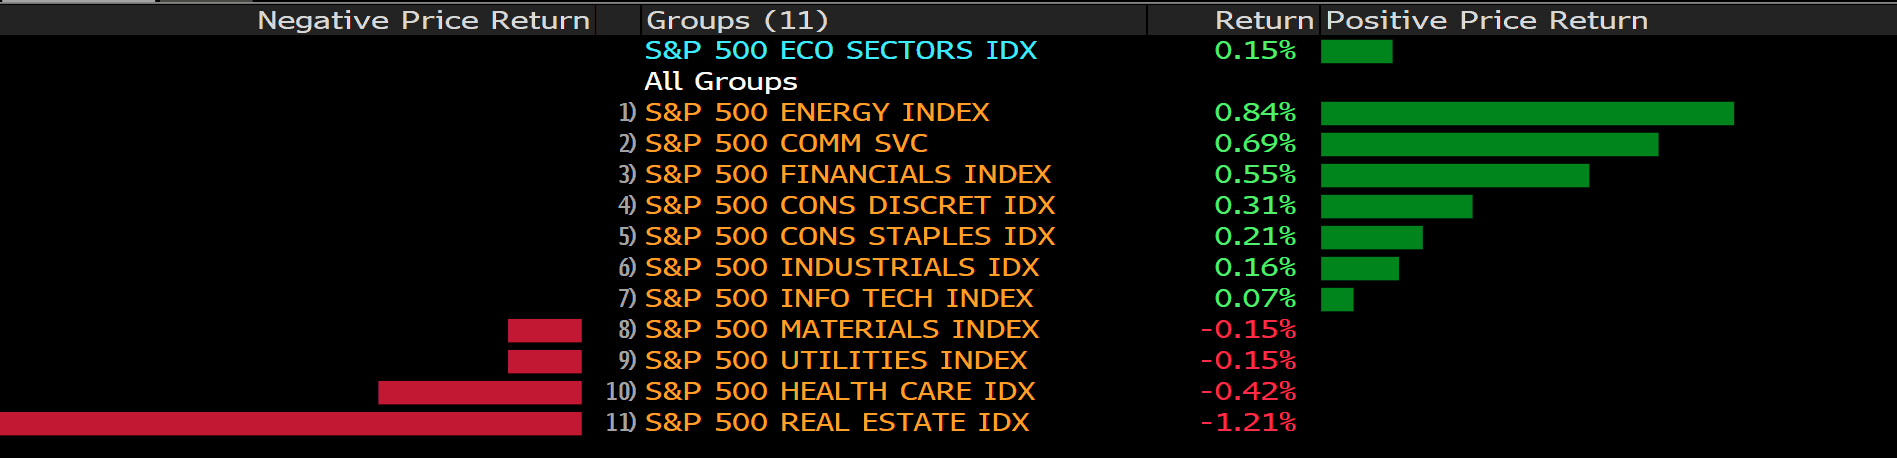
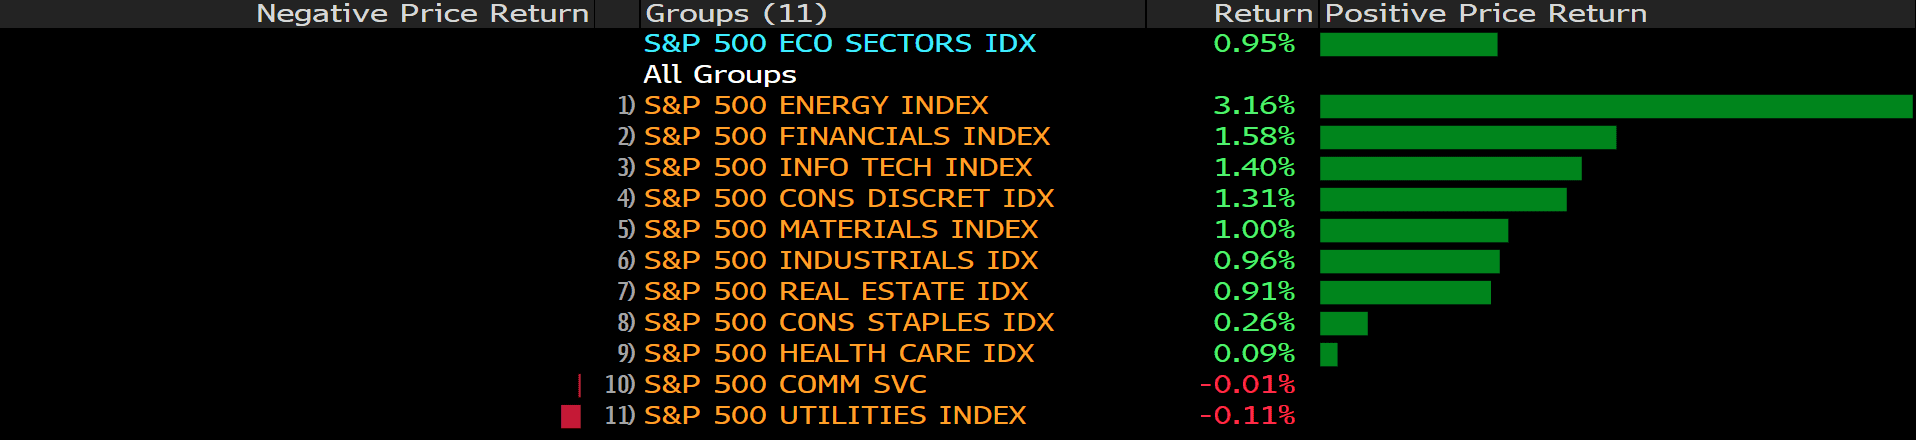
The benchmarks, S&P 500 and Dow Jones both dropped on Thursday. S&P 500 was down 0.2% on a daily basis, the index edged lower a day after it posted its biggest gain since August on Wednesday. The material and energy sectors are the worst performing among all groups, dropped 1.09% and 1.06%, respectively. The NASDAQ, on the contrary, finished in positive territory for a second day.

On top of that, US Core Retail Sales data was released on Thursday, retail sales rose 0.7% last month, boosted by back-to-school shopping and child tax credit payments. The data unexpectedly increased in August, easing some concerns about a sharp slowdown in economic growth. The news has bolstered investor expectations for next week’s policy meeting and how soon the US central bank will start to taper stimulus. However, the weekly jobless claims increased to 332K, higher than what market had expected. Therefore, market fluctuated as investors digested the impact of mixed economic data. Market focus now shifts to next week’s FOMC meeting.

In Asia, stock market was surrounded by selling pressure, as the debt crisis at China Evergrande Group keep fermenting. Furthermore, casino stocks in Macau extended their losses amid the government’s tightening regulations on casino firms.


Main Pairs Movement:

The U.S. core retail sales figures for August was due earlier today and the news quickly sent shockwaves across foreign exchange markets. August retail sales increase by 1.8%, month over month, excluding car sales. The robust August spending figures went against fears of the Delta variant hampering economic recovery and provides a much-needed boost of confidence in the course of the U.S. economy. Majority consumer spending, in August, shifted from the service industry to furniture, groceries, hardware, and online purchases.

Most currencies dropped against the dollar as demand for the Greenback soared. Cable trended lower and dropped through our previously estimated support level of 1.3801. USD/CAD gained as demand for the dollar soared, but the pair is still consolidating between 1.2589 and 1.268 with no clear down or up trend. AUD/USD, also, fell through our previously estimated support level of 0.731 as the dollar gained strength.


Technical Analysis:

GBPUSD (4-hour Chart)

Cable traded higher during the European trading session as the U.K. cabinet reshuffle passed smoothly; however, as the robust U.S. retail figures and American trading hours arrived, the dollar gained strength and started to drag Cable down. Cable tumbled, as much as, 0.53% at the beginning of the American trading session. The strong dollar brought Cable beneath our previously estimated support level of 1.3801 and the pair is trading at 1.378, as of writing. Speculators will be eyeing next week’s FOMC meeting as FED bond tapering is seemingly imminent.

For technical aspect, GBP/USD reversed yesterday’s upward trend amid a resurgent of dollar demand due to healthy August retail sales figures. Cable has broken through our previously estimated support level and is continuing to trend downwards, as of writing. Nearest support for the pair sit at 1.3755; however, the U.K retail sales figures for the month of August are due tomorrow and could provide some upward momentum for bulls and the pound if figures return better than estimated results. RSI is, currently, sitting at 37.74, suggesting some under buying in the market. Cable has broken ground below the 50, 100, and 200 day SMA; furthermore, the pair is edging close to the lower bound of the bollinger bands.

Resistance: 1.3905, 1.3937, 1.3958

Support: 1.3755, 1.368, 1.3604


USDCAD (4- Hour Chart)

USD/CAD trended downwards at the beginning of the trading day, but quickly recovered from the session low of around 1.26 and gained more than 0.5% once the American trading session began. Strong dollar demand has brought the pair to challenge our estimated resistance level of 1.2708 and help the pair regain all of the lost ground since Monday. Speculators, however, should still be mindful that the loonie is highly dependent on the global export and commodity prices, thus indications of international economic slow down could drag the loonie lower still and propel USD/CAD to higher levels. The Canadian federal election will take place next Monday, and polls are showing a slight favor to Justin Tredeau’s Liberal party.

For technical aspect, USD/CAD is still contained by our previous resistance estimates, but the pair is edging closer to the 1.27 price level. RSI is currently sitting at a marginally over-baught level of 55. USD/CAD has reached the upper bounds of the bollinger bands after today’s dollar rally, and the pair is currently trading above the 50, 100, and 200 day SMA.

Resistance: 1.2708, 1.2834, 1.2912

Support: 1.2589, 1.252, 1.2494


AUDUSD (4- Hour Chart)

The Audtralian Bereau of Statistics revealed that the unemployment rate fell to 4% in August, compared to 4.6% in July; however, the decline in the unemployment rate is attributed to the lowered participation rate in August. Despite a better unemployment rate in August, the lowered participation rate raised concerns and bearish sentiment for the Aussie dollar. AUD/USD began the day trending lower, and, once the U.S. retail sales figures were released, the pair trended even lower and broke through our previously estimated support level of 0.731; however, as of writing, AUD/USD has successfully defended the 0.7285 support level and the pair is beginning to stable around that price level.

For technical aspect, RSI indicates 55.38, suggesting neutral buying sentiment. AUD/USD successfully defended our previously estimated support level of 0.7285, but the pair dropped through the 0.731 support level. Currently, the pair trades at the lower bound of the Bolliner bands, and the pair is trading below the 50, 100, and 200 day SMA.

Resistance: 0.7379, 0.7468

Support: 0.7285, 0.7222, 0.7117


Economic Data

Currency

Data

Time (GMT + 8)

Forecast

USD

TIC Net Long-Term Transactions (Jul)

04:00

GBP

Core Retail Sales (MoM)

14:00

0.8%

GBP

Core Retail Sales (YoY)

14:00

2.5%

GBP

Retail Sales (MoM)

14:00

0.5%

GBP

Retail Sales (YoY)

14:00

2.7%

EUR

Core CPI (YoY) (Aug)

17:00

1.6%

EUR

CPI (MoM) (Aug)

17:00

0.4%

EUR

CPI (YoY) (Aug)

17:00

3.0%


USD

Michigan Consumer

Sentiment (Sep)

22:00

72


Back To Top
server

Hello there 👋

How can I help you?

Chat with our team instantly

Live Chat

Start a live conversation through...

  • Telegram
    hold On hold
  • Coming Soon...

Hello there 👋

How can I help you?

telegram

Scan the QR code with your smartphone to start a chat with us, or click here.

Don’t have the Telegram App or Desktop installed? Use Web Telegram instead.

QR code