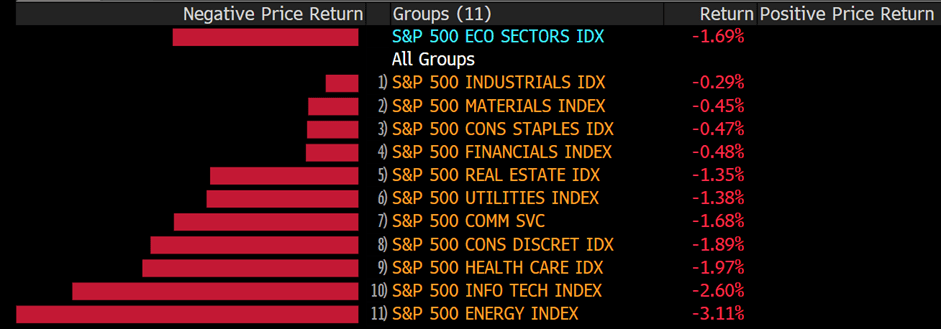
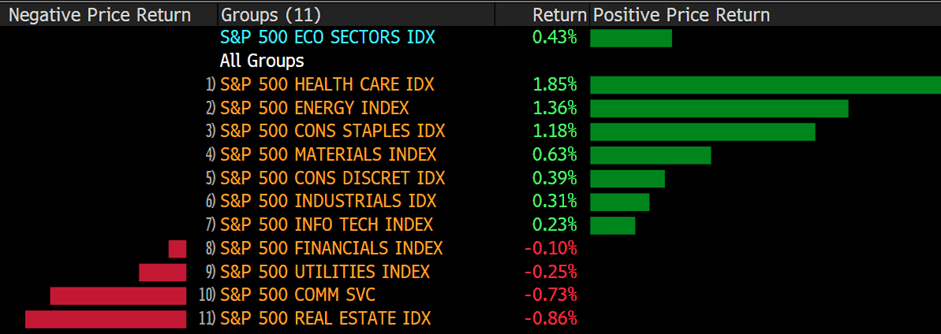
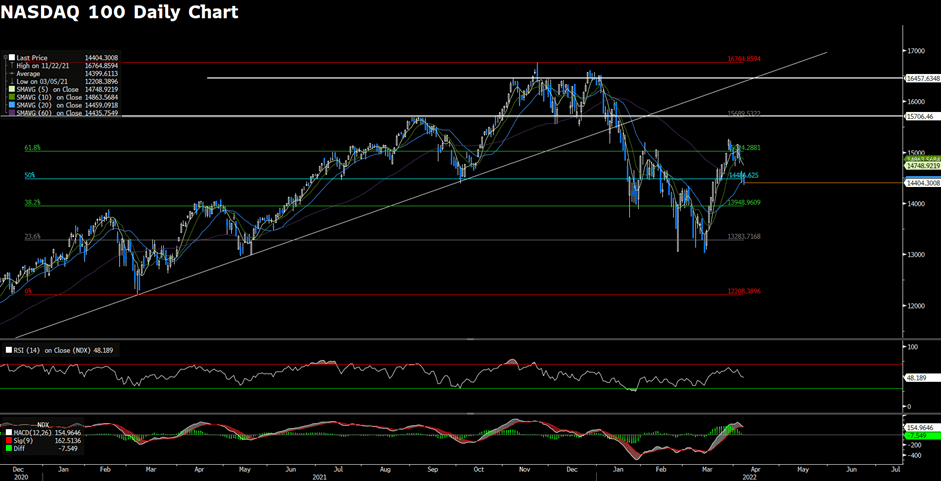
U.S. stocks fell Thursday to cap another losing week on Wall Street as investors digested a series of bank earnings and reeled from more red-hot CPI numbers. The S&P 500 and tech-heavy Nasdaq Composite each settled at four-week lows, recording declines of 1.2% and 2.2%, respectively. The Dow Jones Industrial Average fell 0.3 percent following a brief rise earlier in the morning. Meanwhile, Treasury yields climbed higher, with the 10-year benchmark marking its biggest one-week jump to hit 2.8%, the highest level since December 2018.

According to sources familiar with the subject, Twitter Inc.’s board of directors is considering adopting a measure that would shield the company against hostile acquisition offers in response to billionaire Elon Musk’s unsolicited offer to take the company private.
One of the options under consideration is adopting a poison pill, known as a shareholder rights plan, said the people, who asked not to be identified as discussing private deliberations. The poison pill could be announced as early as tomorrow by Twitter. Another possibility is to assert that the offer is excessively low, as one individual has stated.
Tesla Inc.’s CEO proposed $54.20 per share in cash for Twitter on Thursday, valuing the social media business at $43 billion. Musk, who stated that this was his “final and best” bid, had already amassed a stake in Twitter of more than 9% earlier this year. Twitter’s board of directors met Thursday to discuss Musk’s proposal and evaluate whether it was in the company’s and all of its shareholders’ best interests. The corporation did not respond to a request for comment on the offer or the board’s approach.
A poison pill defensive tactic permits current shareholders to purchase additional shares at a discount, therefore reducing the hostile party’s ownership interest. Poison pills are frequently used by corporations facing activist investors or hostile takeover attempts.

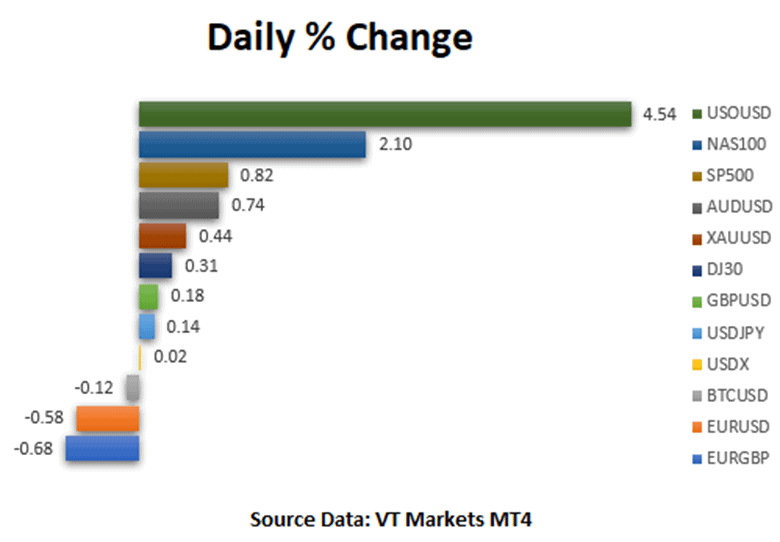
Main Pairs Movement
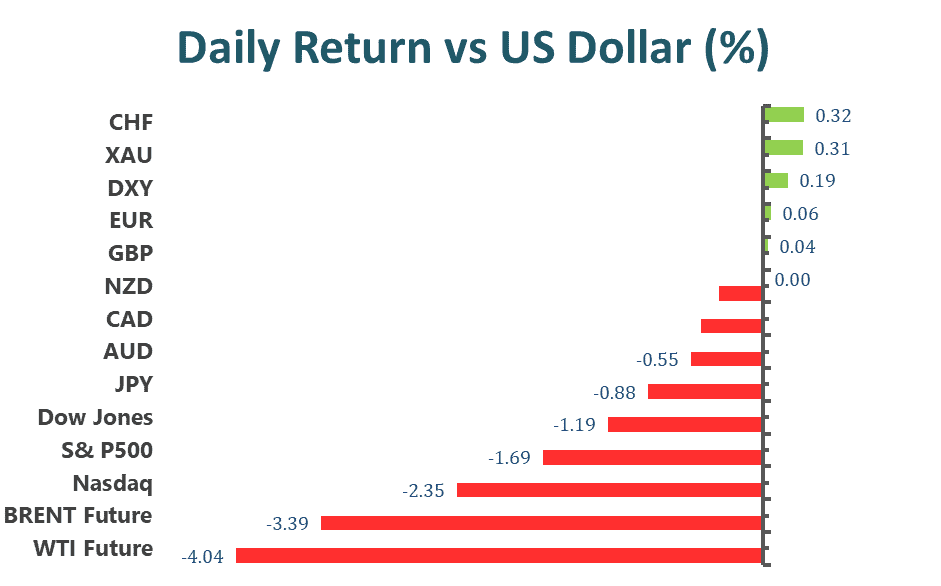
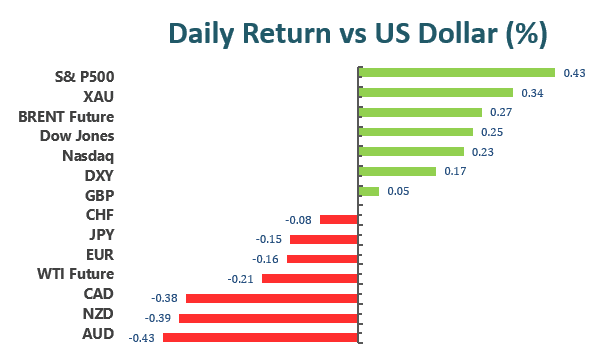
The dollar recovered some of its recent gains ahead of the close as speculative investors booked profits ahead of the Good Friday holiday when the majority of financial markets will be closed.
Following the European Central Bank’s dovish monetary policy announcement, the Euro pair fell to 1.0765, its lowest level in two years. The ECB held rates steady, as expected, and reiterated its intention to stop its bond-buying program in the third quarter of this year. April’s monthly net purchases will total €40 billion, May’s will total €30 billion, and June’s will total €20 billion.
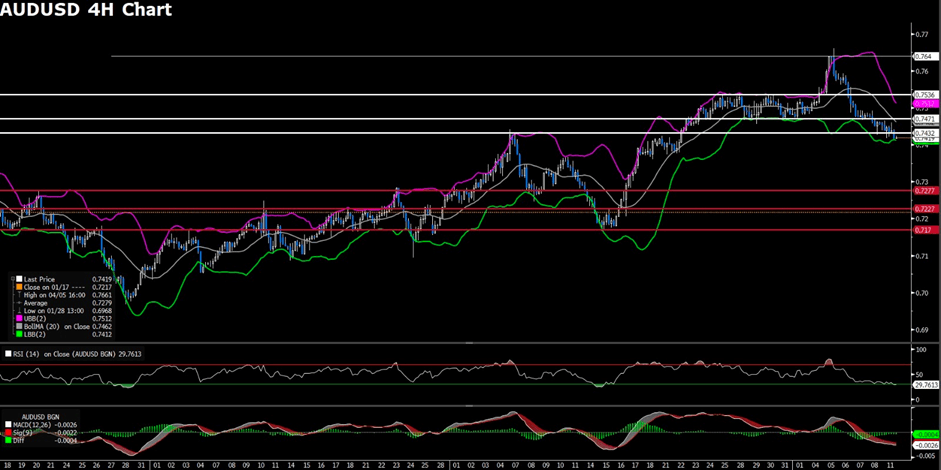
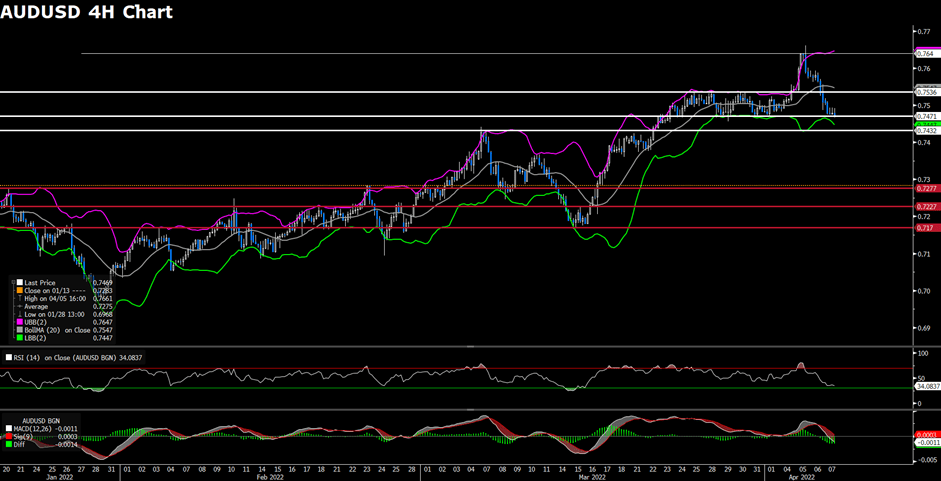
Cable ended the day near 1.3070, down for the day but well off intraday lows. On the other hand, commodity-linked currencies closed the day near their daily lows versus the dollar. The Australian dollar is trading around 0.7410, while the Canadian dollar is hovering around 1.2615. The USD/JPY pair ended the day at about 125.90.
Gold fell 0.22 percent on the day to $1,973.40 per troy ounce. On Thursday, when the Russian oil embargo took effect, crude oils ended in the green for the third consecutive session. Concerns about inflation propelled US government bond yields to multi-year highs. The 10-year Treasury note yield peaked at 2.835 percent and is now trading at 2.82 percent.
Technical Analysis
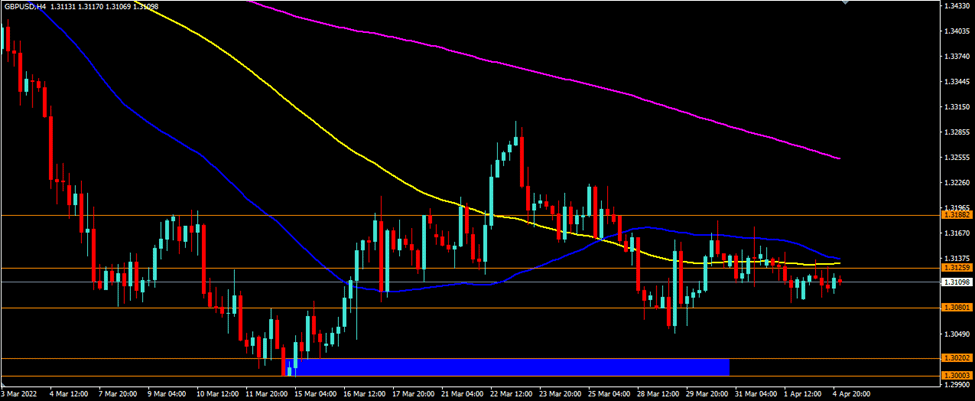
GBPUSD (4-Hour Chart)

GBPUSD falls hard toward 1.3000 on renewed US dollar strength, boosted by the ECB’s dovish speech and rising US bond yields. From the technical perspective, the outlook of GBPUSD turns to the downside as it falls back to the descending trendline and below the 20 Simple Moving Average. At the time of writing, the British pound attempts to defend its support level at 1.3064; failure to defend this level would re-confirm GBPUSD’s bearish momentum toward 1.2974. The RSI indicator on the four-hour chart stays slightly above the midline, implying that GBPUSD might still have rooms to move further south. On the flip side, GBPUSD needs to climb back above the resistance level at 1.3120 to reclaim a positive stance.
Resistance: 1.3120, 1.3165, 1.3211
Support: 1.3064, 1.2974
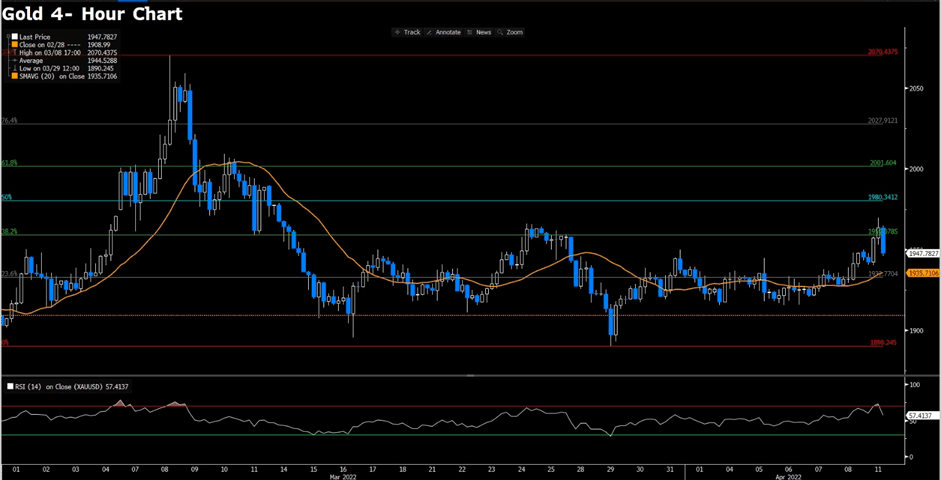
XAUUSD (4-Hour Chart)

Gold gives up some ground on Thursday amid the resurgence of the US dollar’s demand. From the technical aspect, the four-hour chart for gold shows that it continues to trade above the midline of the Bollinger band, suggesting that gold stays in the bullish mood. The RSI indicator has slightly turned lower, but it still hovers and develops within the positive levels, indicating prevalent buying interests. On the upside, if gold eventually can break through the resistance at $1975, it will re-confirm the upside momentum, accelerating toward the next hurdle at $2001.
Resistance: 2001
Support: 1975, 1950, 1916
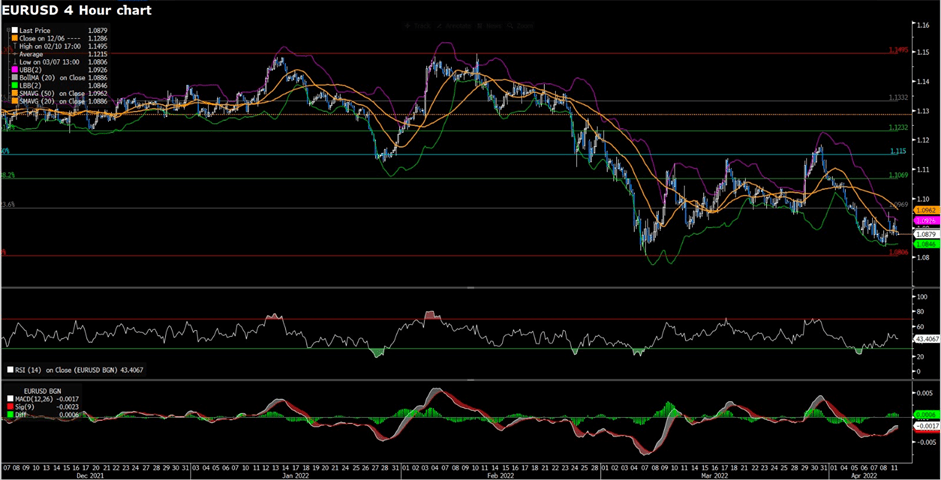
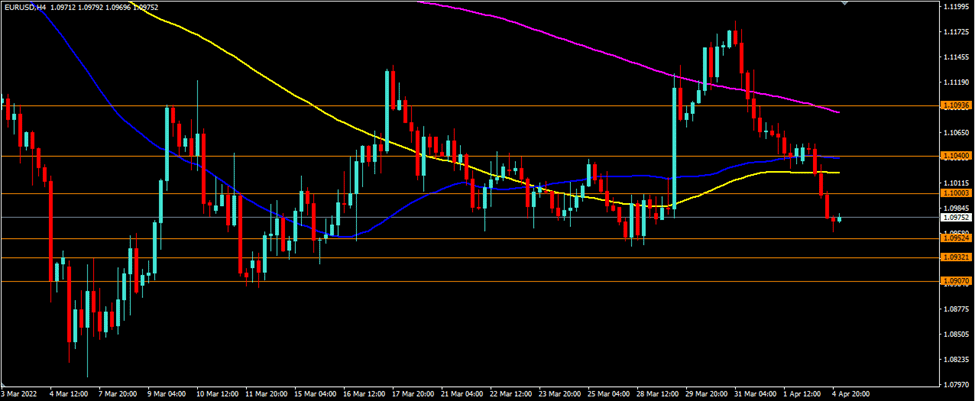
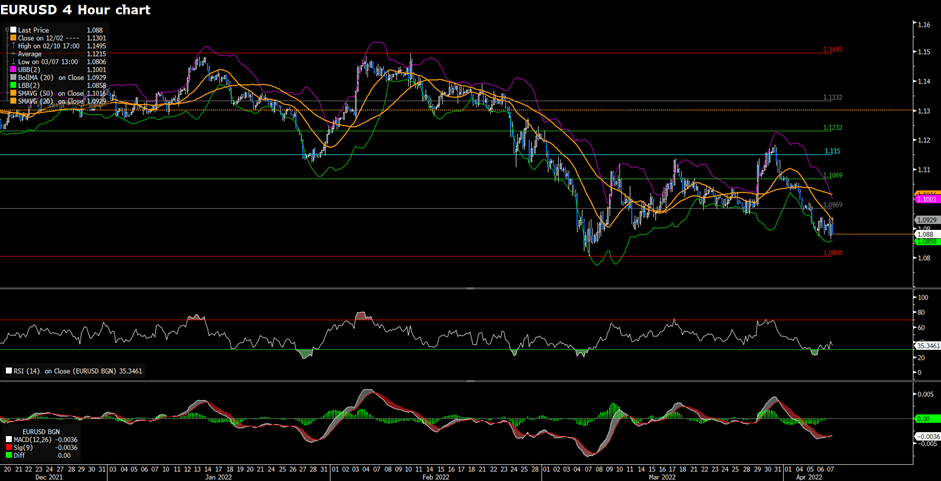
EURUSD (4-Hour Chart)

EURUSD slides to fresh two-year lows below 1.0800 as the ECB leaves its policy rates unchanged. From the technical perspective, the intraday bias remains bearish since EURUSD continues to trade within the descending trendline and below the 20 and 50 Simple Moving Averages. In the meantime, the RSI indicator remains below the midline, suggesting the absence of buying interests; the MACD continues to edge into the negative territory, lending supports to bears. At the moment, 1.0758 would be the support pivot for the pair, failure to defend the level would accelerate the bearish momentum.
Resistance: 1.0932, 1.1039, 1.1126
Support: 1.0758
Economic Data
| Currency | Data | Time (GMT + 8) | Forecast |
| All | Holiday: Good Friday | N/A | N/A |