Back

Forex market analysis: 21 May 2025

The New Zealand dollar is gaining strength as traders react to positive economic news at home and growing uncertainty abroad. A strong trade performance has boosted confidence in the local economy, while a softer US dollar is giving the Kiwi room to climb. As market expectations shift, attention now turns to upcoming policy signals and fiscal announcements that could influence the next move in NZD/USD.

NZD/USD climbs amid strong trade data and weaker US dollar

The New Zealand dollar advanced towards USD 0.594 on Wednesday, lifted by a retreat in the US dollar and renewed optimism following robust April trade figures.

The Kiwi rallied as much as 0.5% intraday, briefly testing resistance near 0.5948, supported by both technical strength and solid fundamentals.

April’s trade data significantly beat expectations, with New Zealand recording a surplus of NZD 1.43 billion—its strongest April performance in several years. This marked a sharp turnaround from a marginal deficit of NZD 0.01 billion in the same period last year.

Exports soared by 25% year-on-year, led by agricultural and forestry products, while imports rose by just 1.8%.

This stronger-than-expected trade balance has led traders to reassess their Reserve Bank of New Zealand (RBNZ) outlook. While a 25 basis point rate cut remains the base case for next week, expectations for deeper easing have eased.

The year-end terminal rate is now forecast at 2.83%, notably higher than previous estimates closer to 2.5%.

The Kiwi’s strength is also being underpinned by a broad-based US dollar decline, triggered by softening US economic data and growing concerns over fiscal sustainability after Moody’s downgrade.

Traders are increasingly doubtful that the Federal Reserve can maintain elevated rates in the face of rising domestic pressures.

Technical analysis: NZD/USD eyes key 0.5950 resistance

In short-term trading, NZD/USD broke out of its intraday consolidation, touching a new local high of 0.59493, just below the psychologically significant 0.5950 level.

The pair has been carving out a pattern of higher lows since rebounding from 0.58942, signalling bullish momentum.

NZD/USD climbs to 0.5949, eyes 0.5950 breakout as bullish momentum accelerates above 0.5900 support, as seen on the VT Markets app.

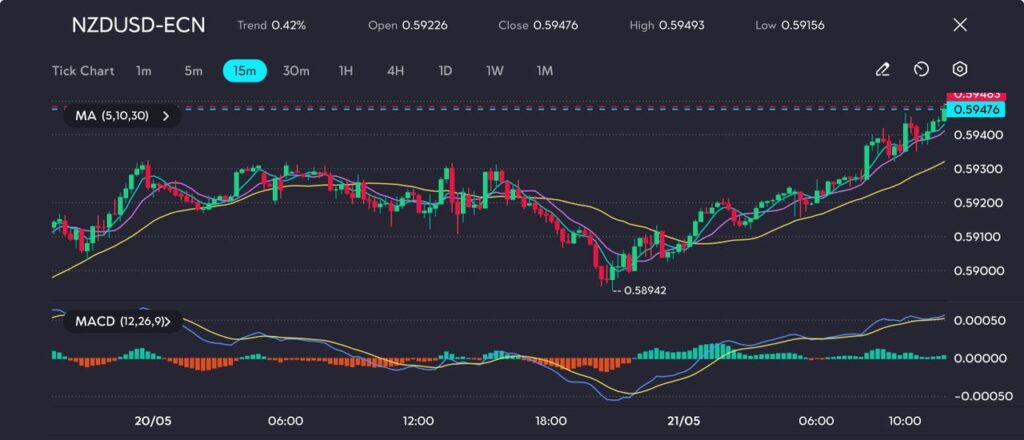
Price action remains above all three short-term moving averages (5, 10, and 30), with the 5-period MA pointing sharply upwards—a strong indicator of upward pressure.

The MACD histogram continues to expand in positive territory, while the signal line lags behind, suggesting further upside may be on the cards.

Should NZD/USD break and close above the 0.5950 threshold with volume, the next resistance zone lies around 0.5970–0.5980.

Immediate support is seen at 0.5925, with a more substantial floor near 0.5900 in case of a reversal.

NZD/USD forecast: Eyes on Thursday’s budget

Despite the recent bullish trend, the outlook remains cautious ahead of Thursday’s government budget announcement, which is expected to signal a more restrained fiscal policy.

Any aggressive tightening could curb domestic demand and reinforce a dovish stance from the RBNZ.

Until further clarity emerges, upside potential for the NZD/USD pair looks promising but remains susceptible to shifts in global risk sentiment or unexpected signals from the central bank.

Click here to open account and start trading.

In Malaysia, gold prices have increased today based on recently compiled market data

Gold prices in Malaysia increased on Wednesday. The price per gram was 453.77 Malaysian Ringgits, compared to 451.92 the previous day.

Prices for Gold per tola also rose to 5,292.64 MYR from 5,271.16 MYR a day earlier. Gold prices in Malaysia are converted from international prices using the USD/MYR exchange rate.

Gold as a Store of Value

Gold is seen as a store of value and a hedge against inflation and unstable currencies. Central banks, especially in emerging economies, are among the largest Gold buyers, holding significant reserves to support economic stability.

Gold shows an inverse relationship with the US Dollar and US Treasuries. When the Dollar weakens, Gold prices usually increase, whereas strong Dollar conditions keep prices stable.

Gold price fluctuations depend on factors like geopolitical instability and interest rates. Lower interest rates tend to increase Gold prices, while higher rates can suppress them.

What we’ve seen overnight in Malaysian gold pricing is a modest uptick, driven not just by the spot price movements globally, but also influenced by the exchange rate shifts between the US Dollar and the Ringgit. The per gram increase from 451.92 to 453.77 MYR may appear marginal at first glance, but when traced in tandem with the move in per tola pricing—climbing over 21 Ringgit—it underscores a definite directional lean in the market sentiment.

Influence of Exchange Rates and Interest Rates

To decode this properly, we need to understand why gold remains attractive right now. It continues to act as a hold of worth when things feel shaky elsewhere, especially with regard to currencies losing some of their footing and inflation sticking around longer than central banks might like. Notably, reserves held by monetary institutions—especially outside the core Western markets—aren’t merely decorative. Their steady accumulation reflects a quiet confidence in gold’s role when policy flexibility is tightening.

Rowing slightly deeper into the mechanics, it’s the inverse relationship with the US Dollar that often drives the ebb and flow. When the greenback edges down, gold tends to float higher, creating room for traders to position with that expectation. Also, don’t ignore the impact that US Treasuries have. When yields on those instruments start picking up, the appeal of a non-yielding asset like gold takes a hit. Yet the absence of aggressive upward movement in US rates lately has opened the door for further gold support.

Now, rates are where things grow more nuanced. Lower rates don’t just benefit equity markets—they serve as fuel for commodity assets like gold. There’s less pressure from bond alternatives when interest returns are muted, and that makes the yellow metal all the more attractive from a relative standpoint. When central banks are more dovish or turn hesitant, gold’s appeal grows, not shrinks.

Geopolitical uncertainty only thickens the mix. Whether it’s instability in energy corridors, movements in eurozone nations, or broadening conflicts elsewhere, gold reacts fast. It’s almost reflexive. When headlines start to shake broader market confidence, safe-haven buying tends to appear almost instantly, and that’s when we often see intraday volatility jump higher.

In the weeks ahead, we need to monitor the behaviour of global bond yields. A spike here could drag on current pricing, while any signs of easing—or even a pause from the Federal Reserve—would likely create tailwinds. Monitoring the USD/MYR rate is also necessary, if only to keep an adjusted view on how international gold values are realised locally. Even if global prices stay flat, an unfavourable move in forex could gnaw away recent gains.

Derivatives tied to gold will likely continue reflecting this short-term back-and-forth. Those positioning might want to stay nimble, given how quickly sentiment can flip if rates or geopolitics shift unexpectedly. Looking at futures or options activity, it’s worth noting where implied volatility is starting to cluster. It may offer forward clues.

We’re watching liquidity pockets widen somewhat, implying there’s room to manoeuvre, but that also means moves can be sharper in either direction. Keeping a hand near the hedge won’t hurt.

Create your live VT Markets account and start trading now.

As concerns about the economy arise, the US Dollar Index dips towards 99.50 after losses

The US Dollar Index (DXY), which measures the USD against six major currencies, decreased for the third consecutive session, trading around 99.70. This downward trend is due to concerns expressed by Federal Reserve officials about the US economic outlook and diminishing business confidence.

Fed members highlighted issues with current US trade policies and voiced warnings about potential disruptions. The Dollar’s depreciation was propelled further after Moody’s downgraded the US credit rating from Aaa to Aa1, mirroring previous downgrades by Fitch Ratings in 2023 and Standard & Poor’s in 2011.

Moody’s Debt and Deficit Predictions

Moody’s predicts that US federal debt will rise to around 134% of GDP by 2035, up from 98% in 2023. They also expect the budget deficit to grow to nearly 9% of GDP, driven by increasing debt servicing costs, expanding entitlement programmes, and decreasing tax revenues.

The US Dollar was weakest against the Swiss Franc among major currencies. A heat map further illustrates specific percentage changes, such as a 0.58% loss against the Franc. The analysis provides an insight into the performance of the USD against other currencies on the same day.

Broadly speaking, this sustained weakness in the Dollar points to a marked shift in how market participants are reassessing risk exposure along the yield curve. The comments from the Fed—somewhat unusually detailed for this stage in the policy cycle—suggest more than soft caution. What we’re hearing from policymakers is an internal doubt, sharpened by rising fiscal vulnerabilities. With Moody’s now the latest to adjust their assessment of US creditworthiness, it’s less about the ratings themselves and more about what they indicate: swelling deficits, a heavier debt load ahead, and the slow drip of investor unease.

Yields are reacting. So is volatility. When we examine this against the backdrop of currency responses, we see that traders aren’t simply pricing in slower growth—they’re responding to the implications of a poorer credit outlook and the structural fiscal slippage that underpins it. The pronounced move against the Swiss Franc, while reflective of the day’s flows, hints at something deeper—seeking lower-beta, lower-risk alternatives when conviction on US assets thins out.

The 0.58% drop relative to the Franc is a clean number, but take that alongside the broader pattern—three straight sessions in red for the DXY—and something begins to congeal. The direction of travel is almost secondary; it’s the persistence and consistency that tell us how conviction is coming together. When flows lean one way persistently, especially across currencies not traditionally sensitive to short-term policy timing, it’s often less about momentum and more about repositioning.

Market Response to Financial Indicators

For those of us positioned in derivatives, especially those exposed to volatility on the Dollar side, the pricing of convexity premiums will need to shift. Implied vols may remain compressed in the near term, but realised volatility could easily overshoot if bond markets begin to price in not just slower rate hikes, but an underlying political struggle to rein in deficits. This starts as a fiscal narrative but likely becomes a market structure story—liquidity conditions in Treasury markets could act as an accelerant.

Recent activity in short-term interest rate futures and FX options points to an undercurrent of caution, if not apprehension. It’s no surprise to see increased demand for downside tails across USD pairs. In this context, vol surface steepeners start looking tactically sound again, particularly for underhedged portfolios. We may soon reach a point where long skew begins to reflect more than residual rate hike fears—it could morph into a broader risk premium on stability itself.

Keeping watch on cross-asset correlation should remain a top priority. When traditional hedges start to show directional bias—like the Franc absorbing safe-haven flows—it’s a red flag that broader reallocation is underway. We may be seeing the early phases of such a shift.

Finally, the practical next steps: avoid tight stops near inflection points on USD pairs and reassess strike levels given the current distance from parity on multiple fronts. Positioning for higher gamma in either direction isn’t an overreaction; it’s a protective measure in case of another credit-related headline or an unexpected pivot from central bank officials. If institutional funds begin to test resistance again on USD baskets, the squeeze back could be intense—shorts may cover violently and with little warning.

Create your live VT Markets account and start trading now.

Mexico’s Economy Minister Ebrard announced reduced tariffs on auto exports to the US from 25% to 15%

Mexican Economy Minister Marcelo Ebrard stated that cars assembled in Mexico exported to the United States will be subject to an average tariff of 15%, rather than 25%. This tariff includes additional discounts that are also available to local US products.

USD/MXN is currently trading at 19.26, showing no significant movement. This reflects the ongoing economic conditions and the market’s reaction to the tariff adjustments.

Understanding Tariffs

Tariffs are customs duties imposed on certain imports to make local producers more competitive by providing a price edge. They are a form of protectionism, different from taxes paid at purchase, as tariffs are prepaid at ports of entry by importers.

Economists are divided on tariffs, with some viewing them as necessary to protect domestic industries, while others see them as potentially harmful, raising prices and sparking trade wars. Donald Trump, during his 2024 presidential campaign, outlined plans to implement tariffs to support the US economy, targeting nations like Mexico, China, and Canada, who accounted for 42% of US imports. Tariff revenues are intended to fund reductions in personal income taxes.

The discussion around the new average tariff rate of 15% on Mexican-assembled vehicles destined for the United States, as stated by Ebrard, suggests a measured policy stance rather than an abrupt protectionist shift. This moderation from the anticipated 25% level implies a willingness by US policymakers to preserve some level of trade fluidity with Mexico while incrementally supporting domestic producers. It also accommodates cross-border integrations that are already firmly in place across the automotive supply chain.

The local currency has yet to display a meaningful shift in response to this development—holding steady at 19.26 against the dollar. This tells us the measure was broadly anticipated or already priced in. Given the relatively muted reaction in USD/MXN, the market may be viewing the 15% rate—while not ideal—as manageable within the larger bilateral trade structure. It’s not pushing us toward risk-off territory, at least not immediately.

Tariffs, by definition, alter the cost-benefit calculations all up and down the chain. Importers in the US now need to work out if they will absorb the added cost or pass it downstream. Mexico-based manufacturers must assess whether margins can be preserved, perhaps through supply chain efficiencies or pricing adjustments on future contracts. For American firms sourcing from Mexico, substitution decisions may follow if the cost gap significantly narrows.

Implications and Strategies

Policy-wise, this kind of move often serves internal consumption: the idea that local industries deserve space to breathe, to scale up, and to fend off foreign pressure. But in doing so, there’s a real financial burden that begins earlier in the journey—at the port—before the product even lands on retail shelves. Those who operate in cross-border logistics and customs clearance will now need to model new cost scenarios and manage client expectations.

On the political side, Trump’s camp has indicated that this tariff framework is foundational to a broader trade realignment strategy, aiming to boost personal income tax cuts with a cushion from customs revenue. While conceptually neat, the thing is, tariff revenue isn’t unlimited or easily predictable. It depends on volumes that can quickly dwindle if demand shifts or external partners retaliate.

For us, that creates a two-fold implication. First, traders should reassess existing long positions on North American equity bundles that overweight US consumer durables or auto retail segments, particularly those tied to South Border sourcing. Even modest tariff changes may squeeze margins at the store level. Second, in derivatives where exposure is structurally more immediate—say, short-dated options or leverage-heavy FX forwards—there’s an urgency to track any follow-through movement in volume or open interest, especially in segments where spreads are tightest.

The rhetoric from Washington needs observing day to day, but not in isolation. It’s the reaction function of industry players, customs regulators, and the Mexican government that will most likely shift the trajectory of related instruments. If Mexican exporters are forced to reprice or reroute, that’s going to leave a footprint—not just in goods flow data, but in the hedging strategies of importers who suddenly face elevated basis risk.

Expect volatility to remain compressed as long as policy details are firm yet limited in ambition. But once the next phase of this trade adjustment kicks in—potentially with other nations responding, or further modifications to enforcement timelines—we’re likely to see options premiums widen as scenario diversity grows.

Not jumping the gun here is key. Timing matters. Too early a move could lock in mispriced risk. Too late, and the spread compounding begins to bite.

Create your live VT Markets account and start trading now.

A weaker US Dollar supports NZD/USD around 0.5935, while US-China tensions may limit gains

NZD/USD rose to around 0.5935 in the early Asian session, marking a 0.18% increase. New Zealand’s trade surplus for April climbed to NZ$1,426 million, significantly above the previous NZ$794 million. The US Dollar weakened due to concerns about the US economy, exacerbated by Moody’s downgrade of the US credit rating to Aa1.

Statistics New Zealand highlighted strong dairy and fruit exports contributing to the trade surplus. However, the annual trade deficit remains at NZ$4.81 billion. Tariff changes between the US and China include a reduction from 145% to 30% by the US and from 125% to 10% by China. Despite these adjustments, tensions over trade persist.

Trade And geopolitical influences

Further stress on the NZD could occur if US-China tensions worsen, as China is New Zealand’s main trading partner. The speech by the Federal Reserve’s Thomas I. Barkin and ongoing sentiment towards US fiscal health could also impact NZD/USD. The Reserve Bank of New Zealand’s monetary policy plays an essential role in shaping the currency’s performance, which can be influenced by macroeconomic data points such as economic growth and inflation.

In broader economic contexts, risk sentiment heavily impacts the New Zealand Dollar, often strengthening during optimistic, low-risk periods. Conversely, it tends to weaken amid market volatility or economic uncertainty.

Against a complex backdrop of trade realignments and fluctuating fiscal health indicators, the upward move to around 0.5935 for NZD/USD reflects more than just a temporary adjustment. It draws a line under a week of improved export data out of New Zealand while global macroeconomic concerns linger heavily. This 0.18% advance aligns with an April trade surplus exceeding expectations, largely thanks to increases in dairy and fruit shipments. These boosted fiscal inflows suggest exporters are capitalising well amid broader uncertainty.

Yet, the larger view remains clouded by an annual trade shortfall still in the billions—NZ$4.81 billion according to the most recent figures. This gap means the country is importing more than exporting over the longer period, which tends to hold back sustained currency strength. So while short-term export boosts help, they don’t erase structural imbalances.

Tariff readjustments between Washington and Beijing show a mutual willingness to reduce pressure, with the US and China notably slashing tariffs on certain imports. However, we think concerns about deeper strategic friction remain. These cuts—dropping U.S. tariffs from 145% to 30%, and China’s from 125% to 10%—may aid commerce at the margin, but they barely touch deeper causes of strain. If those tensions persist or worsen, demand for New Zealand’s goods could falter. As China remains the country’s biggest trade partner, there’s an asymmetrical risk built into the NZD, which traders will likely factor in when considering exposure.

Impact of US Credit Rating Downgrade

We also see broader weakness in the US Dollar, partly driven by Moody’s decision to trim the US credit rating to Aa1. This downgrade suggests eroding investor confidence in long-term US debt stability. The move supported non-dollar currencies like NZD momentarily, but it also introduces wider swings in sentiment-led movements. As the Federal Reserve’s Barkin hinted at in recent remarks, fiscal uncertainty in the US complicates forward-guidance strategies, especially with inflation targets hanging in balance.

Given the Reserve Bank of New Zealand’s stance, forward-looking macro data points—particularly around inflation and GDP output—now hold more weight. For those of us tracking shifts in rate expectations, slight changes here could push traders quickly in one direction. More hawkish forecasts might provide a secondary push to the NZD on yield divergence grounds, though without growth support, such flows could be short-lived.

We should keep in mind the sensitivity of the NZD to swings in broader risk appetite. When market volatility rises or geopolitical risks intensify, the currency often takes a hit, as we’ve seen historically during stress scenarios. It tends to benefit when traders rotate into higher-yielding or growth-sensitive positions. For now, however, we are watching risk-sensitive positioning very closely and taking any changes in sentiment seriously.

In terms of action, we think it’s worthwhile to monitor trade volumes and headlines out of Asia closely—especially anything affecting Chinese demand or Kiwi export pricing. Keep a close eye on Federal Reserve speeches and any updates on fiscal debates in Washington.

Now isn’t the time to let your positioning drift. Volatility, albeit modest for now, tends to gather pace quickly in these conditions, especially when monetary narrative and trade shifts cross paths. One statement, one data print, or one ratings decision can swing things back within hours, not days.

Create your live VT Markets account and start trading now.

Recent information indicates Israel might be readying an attack on Iran’s nuclear sites despite US diplomacy

The United States has obtained intelligence suggesting Israel may be preparing to strike Iranian nuclear sites. It remains unclear if Israeli leaders have made a definitive decision, and debates within the US administration continue on potential outcomes.

At the current moment, Gold is trading 0.06% higher, reaching $3,290. In financial terms, “risk-on” and “risk-off” describe market attitudes towards risk, affecting asset purchases.

Understanding Market Dynamics

In “risk-on” markets, stocks and commodities typically rise, except for Gold. Major commodity-exporting currencies see strength, benefiting from future economic growth.

During “risk-off” periods, Bonds, Gold, and safe-haven currencies like the Yen, Franc, and Dollar appreciate. The US Dollar remains a global reserve currency, favoured in crises.

The Australian, Canadian, and New Zealand Dollars, along with the Ruble and Rand, rise in “risk-on” environments. These currencies depend on commodities, which gain value with economic activity.

In “risk-off” phases, the US Dollar, Japanese Yen, and Swiss Franc usually strengthen. The Dollar’s reserve status, domestic holding of Japanese bonds, and Swiss banking laws offer safety.

Market Reactions and Strategies

Engaging in any market carries risks, including potential financial loss. Conduct thorough research before making investment decisions, considering potential uncertainties and risks.

The suggestion that Israel may be thinking about targeting Iranian nuclear infrastructure has injected a degree of uncertainty into global markets. While it is unknown whether a decision has been locked in, certain circles in Washington are said to be weighing the possible fallout, both geopolitical and economic. This is something we cannot afford to ignore. Markets do not respond calmly to threats involving military escalation, particularly if the Middle East is involved, given its direct and indirect influence on crude oil prices and overall sentiment.

Right now, Gold is only marginally above flat, sitting just over $3,290. That minor uptick might seem inconsequential on the surface, but it’s often how safe-haven assets behave when tensions are brewing but not yet boiling. If the cloud of military action thickens, we wouldn’t be surprised to see flows shift from equities and commodity-linked currencies toward safe havens.

Interpreting this from a sentiment standpoint, we’re hovering near the boundary between “risk-on” and “risk-off” conditions. The former traditionally fuels momentum in stocks, industrial metals, and growth-sensitive currencies. In contrast, the latter favours defensive trades—government bonds, Gold, and currencies that traders reach for when trying to avoid turbulence, particularly the US Dollar, Japanese Yen, and Swiss Franc.

One has to note that commodity-based currencies such as the Australian and Canadian Dollars tend to respond positively when traders position for expansion and increased demand. However, if geopolitical risk casts a long shadow, these assets could experience outflows. That pattern plays out again and again whenever concerns about supply disruptions or political instability emerge unexpectedly.

The US Dollar, by virtue of its dominance in global reserves and liquidity, becomes the epicentre of buying during unsettled periods. Meanwhile, the Yen benefits due to the large scale of domestic holdings of Japanese debt, which reduces the currency’s dependence on foreign capital. The Franc, on the other hand, continues to draw attention due to strict Swiss legal frameworks, often interpreted as a bulwark in times of international strain.

With these dynamics building, it’s essential for anyone dealing in derivatives to look a step ahead and start factoring in volatility before it arrives. Thin moves in underlying assets today might become pronounced dislocations tomorrow. Continue to monitor how traders react to any firm signals from Tel Aviv or Washington, but don’t wait for headlines to adjust exposure. We need to interpret risk not as a binary state, but as a motion—moving in degrees, not switches.

Lastly, it goes without saying that markets do not reward late reactions. Traders ought to be nimble, rely on forward-looking measures, and stress-test positions for exposure to both energy-sensitive sectors and G10 currency pairs particularly vulnerable to headlines tied to the Gulf or Israel. Events may surprise, but preparation should not.

Create your live VT Markets account and start trading now.

As the US Dollar declines, the Mexican Peso rises sharply, nearing 19.00 against USD

The Mexican Peso reached a new yearly high against the US Dollar, with USD/MXN trading at 19.28, a decrease of 0.18%. Mexico’s economic calendar was empty ahead of key data releases like April’s Retail Sales, Q1 GDP, and mid-month inflation figures.

In the US, the Federal Reserve officials were in focus alongside anticipation of a Tax bill vote, impacting the Dollar’s strength. The US Dollar Index fell by 0.31% to 100.07, reflecting broad weakness.

Economic Projections For Mexico

April Retail Sales in Mexico are projected to decline to 0.1% MoM, with annual improvement to 2.2%. GDP growth for Q1 2025 is expected to rise by 0.2% QoQ, with inflation projected to increase by 4.01% YoY. Banco de México recently suggested room for a rate cut after reducing rates to 8.50%.

Moody’s downgraded US government debt due to fiscal concerns, contributing to Dollar pressure. Concerns arise from inflation expectations, with Fed officials commenting on the impact of tariffs and trade tensions on price stability.

USD/MXN trends bearishly, aiming to test the 19.00 mark, with RSI indicating oversold conditions. Key supports lie at 18.50 and 18.00, while reclamation of 19.50 would challenge resistances at 19.53 and 19.90.

Banxico, Mexico’s central bank, preserves the Peso’s value through monetary policy, typically adjusting interest rates to manage inflation. Its policies are influenced by the US Fed, meeting eight times annually.

Traders And Market Dynamics

With the Peso continuing to strengthen against the Dollar, hitting a high for the year, traders have been presented with a short-term directional move that may begin to flatten or even reverse as the pair nears the psychological support at 19.00. The drop in USD/MXN below 19.30 isn’t just a figure on the screen — it reflects the confluence of local policy signals and broader Dollar weakness. The latest move from Banxico suggesting potential for another rate cut is a key element here, especially when seen against the backdrop of the Fed’s monetary tightening and growing fiscal worries.

The US Dollar has been under pressure, with the Dollar Index steadily retreating, largely thanks to uncertainty surrounding internal fiscal policy and softer Federal Reserve language. These two elements — less hawkish Fed tones and recent ratings concerns — have dampened the Greenback’s momentum. The downgrade, while symbolic in some respects, draws a definite line under the growing anxiety about the long-term sustainability of America’s fiscal decisions. That shift is now being priced in more overtly by both currency and rate traders. We can observe that across multiple G10 currencies, but nowhere more clearly, this week, than against the Peso.

Fed officials’ remarks about potential inflation spikes due to tariff threats are a rare acknowledgment — less politically filtered and more direct. If tariffs increase, cost-push inflation becomes likelier. That complicates rate decisions ahead, and traders have been pivoting accordingly. It has helped to stretch the divergence in central bank expectations vis-à-vis Mexico, where recent data has been softer but not weak enough to cinch in a series of rate cuts.

Keep in mind, April’s retail sales out of Mexico are forecast to rise only marginally on an annual basis, while GDP estimates point to a small pickup, consistent with a still-resilient but slowing economy. Layer that with inflation ticking above 4%, and the room for Banxico to ease aggressively becomes narrower — even as its last move already gave the market a signal it may lean dovish in coming meetings. That’s not a full shift in stance but more a calibrated move designed to stay responsive without flooding the market with liquidity, which could destabilise the Peso.

From a positioning viewpoint, USD/MXN remains in a downward channel with RSI suggesting the pair may be stretched on the short side. Technically, a breach towards 19.00 could trigger light profit-taking, though we should be prepared for opportunistic selling on any bounce toward 19.50. For those managing option exposure or delta-hedging along that corridor, this creates a narrow but defined range in which implied vol might drift slightly lower unless data surprises dramatically.

We’re watching 18.50 and 18.00 for next support levels — not because they are mechanically important, but because they haven’t been properly tested this year. If macro data from Mexico remains firm while US indicators soften, particularly in employment or inflation readings, those levels may come into focus swiftly. Conversely, any sharp reversal in Treasury yields or rehardened rhetoric from Powell and his colleagues could lift USD/MXN toward upper resistance nearer 19.90, especially if Mexican inflation underperforms expectations.

What’s also worth noting is the correlation between Peso resilience and interest rate differentials. That spread — between Mexican and US benchmark yields — has shrunk slightly, but remains wide enough that carry remains attractive. That doesn’t make long Peso positions invulnerable to shocks, especially if global risk sentiment turns, but it still supports a bias that selling USD rallies remains a more rewarding stance — at least in the current vol regime.

For the next few weeks, it will be vital to keep a close read on the measured signals from Banxico. We’ve seen this bank act defensively before when inflation edges up. Its meeting structure — eight per year — enforces a rhythm that traders can get ahead of by reading inflation, retail sales, and GDP as triage indicators. If one of them sharply deviates, expect recalibrations both in pricing of front-end rates and via Peso forwards, before spot catches up.

Ultimately, the market is treating the Peso with a level of steadiness that hasn’t always been the case — but that is conditional. Any notable US risk-off sentiment, possibly triggered by a further impasse on fiscal legislation or worsening inflation expectations, remains the clearest threat to unwind recent Peso gains. So, it’s best to stay nimble with clear technical levels set and respond dynamically to data releases rather than anchoring to any fixed stance.

Create your live VT Markets account and start trading now.

Driven by a US credit downgrade, gold rises, with bulls aiming for $3,300 target

Gold prices have risen for the second consecutive day, with XAU/USD at $3,289, climbing over 1.50%. This increase comes as the Dollar weakens due to uncertainties in US trade policies and fiscal stability following Moody’s downgrade of US debt.

The demand for gold grew as US equity markets declined, influenced by Moody’s downgrade of US government debt to AA1. Meanwhile, Federal Reserve officials maintain a cautious approach, with no indication of potential interest rate cuts despite the US economic slowdown.

Impact Of Global Tensions

Interest rates cuts by major central banks, including the PBoC and RBA, have also positively impacted Bullion. Geopolitical tensions and ongoing uncertainty in regions like Russia and Ukraine, alongside the Middle East, continue to bolster gold’s appeal.

Market participants are closely monitoring Fed speeches and economic data releases this week. Gold’s upward trend could breach the $3,300 level, with resistance at $3,350 and potentially $3,400. A drop below $3,250 might lead to support at $3,200 and possibly the 50-day SMA at $3,176.

The Federal Reserve’s role in economic stability involves managing interest rates to balance inflation and employment. Extreme scenarios may trigger Quantitative Easing or its opposite, Quantitative Tightening, influencing the Dollar’s value.

What we’re seeing now is a response by investors to multiple overlapping sources of pressure within U.S. fiscal policy and global political anxiety. The rise in gold—currently holding strong above the $3,280 line—is not just driven by the downgrading of U.S. debt by Moody’s, but more broadly by a growing discomfort with the direction of American economic credibility and policymaking clarity.

Market Reactions And Volatility

Moody’s, by cutting the U.S. credit rating to AA1, has added to an existing undercurrent of risk aversion. What followed was an immediate uptick in safe-haven assets, gold foremost among them, reinforced further by weaker showings in the equity market. With the S&P 500 losing ground, it appears sentiment is shifting away from growth assets, a move that has historically tipped scales in favour of commodities like gold.

Powell’s consistent message of restraint and patience—despite clear signs of slowing economic growth—only complicates things. The Fed remains focused on inflation metrics, but with employment softening and consumer activity cooling, we believe there’s rising discomfort among investors relying on rate cuts to inject stimulus. They’re simply not getting the signals they want from the central bank.

This disconnect is important for those of us trading in the derivatives space. It suggests the likelihood of increased volatility in rate-sensitive instruments. We’re preparing for sharp, reactionary moves around scheduled Fed speeches or any higher-than-expected CPI or employment data. It also makes short-term positioning around interest rate swaps or gold-linked contracts particularly delicate.

On the global front, decision-making in policy from the People’s Bank of China and the Reserve Bank of Australia has leaned towards support, with both institutions moving to ease. Their actions imply a broader acknowledgment from central banks that restrictive policies have perhaps stretched too long. For bullion, this has added a tailwind, making long exposure more attractive despite high prices.

Elsewhere, the steady rise in geopolitical friction—particularly from Eastern Europe and instability in key sections of the Middle East—adds complexity. These are the kinds of unresolved threats that tend to prevent downward corrections in gold prices. We’re treating these more as environmental constants now rather than short-term catalysts, and that informs our medium-term valuations.

In terms of levels, technicals are being respected quite neatly. Breaks above $3,300 seem highly plausible if momentum builds into the latter half of the week, especially with macro releases lined up. We’ve modelled resistance sitting around $3,350, and the possibility exists for a test at $3,400 if further dollar softness appears. On the downside, a break past $3,250 increases the probability of seeing reversion toward $3,200—beyond that, attention turns to the 50-day Simple Moving Average, currently circling $3,176.

Because gold’s pricing often moves inversely to the US dollar, we’re watching treasury yields for direction as closely as we are spot charts. Should another round of Treasury volatility materialise, or bond auctions underperform, demand for alternatives like gold could accelerate—particularly if that lines up with dovish tones in upcoming Fed commentary. That’s one reason implied volatility is slightly elevated heading into the weekend.

Market participants should be particularly alert to sudden changes in rate expectations. Any unexpected drop in headline inflation or uptick in unemployment could bend current probabilities sharply, and that recalibration would flow into both the FX and commodity spaces without much delay. With such turmoil already priced into sovereign credit risk, even modest surprises now have the potential to amplify directional trades.

Create your live VT Markets account and start trading now.

The United States reported a crude oil stock increase of 2.499 million, surpassing forecasts

The recent data on United States API weekly crude oil stock showed an increase of 2.499 million barrels. This figure exceeded the projected decrease of 1.85 million barrels, reported on 16th May.

AUD/USD made gains towards 0.6450 due to reduced US Dollar demand amid trade tensions with China. USD/JPY also fell below 144.00 as the US Dollar continued its decline influenced by expected Federal Reserve rate cuts.

Gold Prices On The Rise

Gold prices are on the rise, aiming to stay above $3,300 as geopolitical tensions and a weaker US Dollar bolster demand. The UK is expected to announce a rise in CPI inflation to 1.1% monthly, and 3.3% annually.

China’s economy experienced a slowdown in April, influenced by trade war uncertainties. Retail sales and fixed-asset investment did not meet forecasts; however, manufacturing was less affected than anticipated.

The recent American Petroleum Institute (API) data, which indicated a build of 2.499 million barrels in oil inventories, was unexpected. Markets had priced in a drawdown of around 1.85 million barrels. Naturally, this larger-than-anticipated stockpile hints at softer demand or a potential shift in supply dynamics. For those trading energy-linked contracts or related volatility products, it shifts the bias slightly towards bearish short-term sentiment, at least until the EIA figures offer confirmation. Awareness of backwardation or contango in the futures curve might be particularly useful over the next several sessions, especially with OPEC+ decisions looming.

On currency moves, AUD/USD’s climb towards the 0.6450 level was largely underpinned by lower interest in the US Dollar, driven by the widening tensions with China. A rally in the Aussie, especially tied to risk-on moods, often requires macroeconomic stability out of Asia — yet with Chinese activity figures weakening, this pairing could become more data-sensitive from both ends. It may be prudent to look closely at the next Employment and CPI prints out of Australia, as changes there could counteract broader USD weakness.

Currency Moves And Inflation

USD/JPY’s slip below 144.00 reflects deepening expectations of the Federal Reserve adopting a less aggressive stance. The Dollar’s broad retreat combined with a rate cut narrative is leaving little room for the Yen to weaken further without support from local policy makers. Traders closely watching yields will likely keep an eye on US 2-year Treasuries and implied volatility in FX options in this cross. If Bank of Japan officials hint at policy normalisation, even subtly, the pair may see sharper moves than usual in either direction.

Gold continues to benefit from the prevailing climate. With prices climbing and staying firm above the $3,300 level, safe haven flows are unmistakably being driven by both geopolitical risks and broad-based Dollar softness. In our experience, aggressive rallies during a weakening Dollar regime often face limited resistance if inflation expectations remain tethered. Watching real yields, especially in the 10-year inflation-protected securities, allows us to assess how attractive gold remains when adjusted for opportunity cost.

In the UK, inflation’s reacceleration to 1.1% month-on-month and 3.3% annually demands attention. These levels appear higher than earlier forecasts and may pressure the Bank of England into a cautious stance. Those managing risk exposure in sterling pairs or contracts linked to UK rates could consider recalibrating positions ahead of the next monetary policy report. Forward guidance may become more hawkish, especially if wage data turns sticky.

China’s mixed macro print last month, where retail sales and investment showed softness while manufacturing held up better than expected, sends a complicated message. There’s no denying that trade-related tensions are leaving their mark, especially on the domestic consumption side. For those tracking commodity-linked currencies or industrial metals, slower Chinese consumer activity may imply lagging demand, while relative stability in factory output still supports selective asset classes. Watching policy responses from Beijing becomes imperative, especially as past stimulus announcements have a track record of moving markets quickly.

We think these data points, taken together, reinforce the notion that while rate and macro adjustments are underway globally, the path is anything but smooth. Careful allocation, tighter stops, and shorter positioning windows may serve well in this environment.

Create your live VT Markets account and start trading now.

With Nike shares on the rise amidst a market decline, traders may consider making a purchase

Nike shares are on the rise, even as the market experiences a slight downturn. Recently, Nike’s stock surpassed its 50-day Simple Moving Average, marking the first occurrence since March. Presently, Nike’s stock is valued just under 1% higher at $62.62.

The market has paused following an uptrend since April. The Dow Jones Industrial Average, which includes Nike, has decreased by 0.57%. Concurrently, the S&P 500 and NASDAQ Composite have dropped around 20 basis points. On Tuesday, Nike announced the layoff of some tech employees and the outsourcing of certain workflows under CEO Elliott Hill.

Nike’s Opportunities and Challenges

Nike is expected to benefit from the acquisition of Foot Locker by Dick’s Sporting Goods. Nike, a leading brand at both retailers, stands to gain increased retail focus. The brand is also set to benefit from lower tariffs agreed upon by the US and China. Vietnam, where Nike produces most of its goods, may secure favourable trade terms as well.

Breaking the 50-day SMA has given Nike the momentum to test the top price channel trendline. This could potentially elevate the stock to around $74, a 20% increase. However, a market decline or unsuccessful tariff negotiations between Vietnam and the Trump administration might push the stock back to $52.50.

We’ve just seen a key technical move in Nike’s shares—Monday’s break above the 50-day Simple Moving Average was no small feat, especially given that it hadn’t happened since late March. That action suggests that buyers are stepping in again, indicating growing confidence. Trading only about 1% higher on the day may not seem like much on the surface, but the broader market’s weakness puts that gain in more context.

It’s worth noting that the Dow Jones, where Nike is listed, gave back just over half a percent during the same period. Both the S&P 500 and NASDAQ moved lower too, although their declines were more modest. Those drops shouldn’t be ignored, but they help highlight Nike’s relative strength.

Company Restructuring and Retail Dynamics

Now, the company made headlines recently with some internal restructuring. Specifically, it’s started to trim its workforce on the tech side and hand off certain operations to external parties. While layoffs often spook investors, CEO Hill seems to be refocusing spending, perhaps steering the ship more towards profitability than expansion.

There’s also an external shift in retail dynamics. The merger between Dick’s Sporting Goods and Foot Locker is an event that could alter customer traffic patterns. What matters here is that Nike products are already central to both retailers’ shelves. This could translate into more prominent product displays and stronger direct-to-consumer channels, both of which are helpful for margins.

And then there’s the issue of tariffs. A moderation in trade tensions between the United States and China—paired with potential agreements involving Vietnam—opens the door for cost efficiencies. Since a vast portion of Nike’s manufacturing base sits in Vietnam, there’s reason to expect production costs may stabilise or even fall if favourable terms are locked in.

Coming back to the technicals, having broken the 50-day moving average, the stock now sits between two key checkpoints. The next price ceiling stands around the upper boundary of the price channel. A clean move up there brings $74 into play. We’re talking about a 20% pop if momentum carries through. But technical moves don’t exist in vacuum. A broader downturn or missed opportunities regarding international trade deals could build resistance, pushing shares down as far as $52.50.

We are watching these levels carefully. It’s not just price—it’s the sequence of events around it. The market’s reaction to the restructuring steps, combined with how much follow-through energy drops into trade negotiations, will offer strong signals regarding direction. Whether we’re developing long exposure or hedging for potential retracements, what happens over the next few sessions will guide how we calibrate short-term positioning.

Create your live VT Markets account and start trading now.

Back To Top
server

Hello there 👋

How can I help you?

Chat with our team instantly

Live Chat

Start a live conversation through...

  • Telegram
    hold On hold
  • Coming Soon...

Hello there 👋

How can I help you?

telegram

Scan the QR code with your smartphone to start a chat with us, or click here.

Don’t have the Telegram App or Desktop installed? Use Web Telegram instead.

QR code