What Are Trading Signals and How Do They Work?
In the complex and fast-moving world of financial markets, knowing what trading signals are and how to use them effectively can be a game-changer. Trading signals act as essential guides that help traders identify potential entry and exit points, improving decision-making and enhancing trading results. This article will explore the nature of trading signals, their types, benefits, risks, and practical tips to customize and use them, especially with platforms like VT Markets.
What Are Trading Signals?
Trading signals are essentially alerts or recommendations generated by professional analysts, trading software, or automated algorithms that indicate potential opportunities to buy, sell, or hold a financial asset. These signals analyze a wide range of market information, including price movements, trading volume, technical indicators, and economic news, to identify patterns that suggest the market’s likely next move.
By condensing complex and vast amounts of data into straightforward guidance, trading signals help traders make timely and informed decisions, reducing guesswork. Whether you are a beginner just learning the ropes or an experienced trader seeking confirmation, these signals serve as valuable tools to navigate the market with greater confidence.
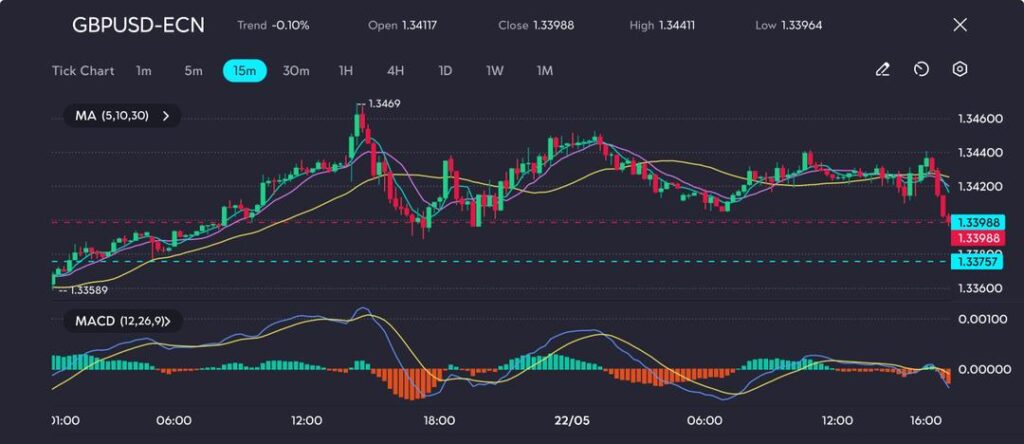
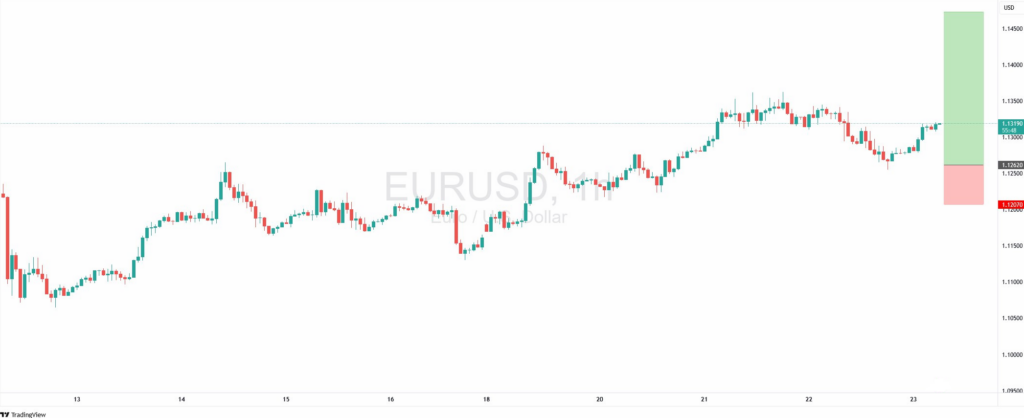
Example: A trading signal might alert you when a major currency pair like EUR/USD reaches a technical level indicating an upward trend, encouraging you to enter a buy position before the price rises further. Conversely, signals can warn of potential downturns, helping traders exit positions or place sell orders to manage risk.
Types of Trading Signals
Trading signals generally fall into two main categories:
Manual Trading Signals: These signals come from experienced traders or analysts who study market charts, economic reports, and news events to identify trade opportunities. They use their expertise and intuition to interpret complex market dynamics, considering factors like geopolitical developments or sudden shifts in sentiment that algorithms might overlook. Manual signals often include detailed explanations to help traders understand the rationale behind each recommendation.
Automated Trading Signals: Generated by advanced algorithms and AI systems, automated signals analyze large volumes of market data in real time, applying technical indicators such as moving averages, RSI, and MACD. These signals provide fast, consistent alerts based on programmed criteria, eliminating emotional bias and human error. Automated trading signals allow traders to react quickly to market movements and are especially helpful for those who prefer systematic or high-frequency trading strategies.
Some platforms offer hybrid solutions that combine manual expertise with algorithmic precision, offering traders the best of both worlds.
How Trading Signals Are Generated?
Understanding how trading signals are generated sheds light on their accuracy and reliability. Signals are based on the analysis of several market factors:
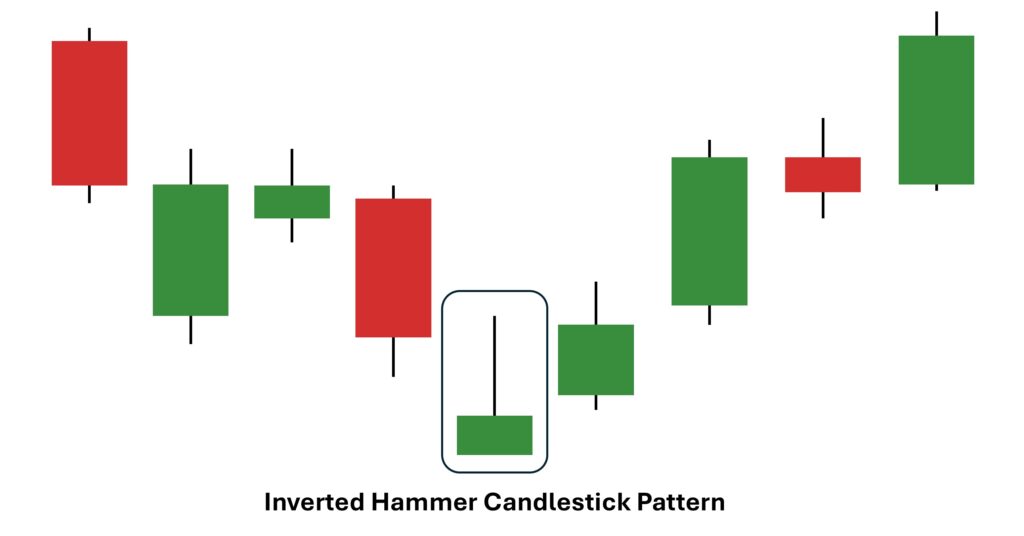
- Technical Indicators: Common technical analysis indicators include moving averages, Relative Strength Index (RSI), MACD (Moving Average Convergence Divergence), and candlestick patterns. These indicators detect trends, momentum, and potential reversals.
- Fundamental Analysis: Many trading signals integrate fundamental analysis, including key economic data releases, central bank decisions, geopolitical developments, and overall market sentiment to enhance their predictive accuracy.
- Price Action: The study of recent price movements and volumes helps predict short-term trends.
By processing these data points, trading platforms or analysts create signals that simplify complex market conditions into clear buy or sell alerts.
Discover the difference between fundamental and technical analysis.
Benefits of Using Trading Signals
While trading signals offer valuable advantages, traders should understand how to use them effectively to maximize their benefits. These tools can save time, improve decision-making, and support traders of all levels.
- Time Efficiency: Trading signals help traders avoid spending countless hours analyzing complex charts and tracking market news. Instead, they receive clear, concise alerts that highlight potential opportunities, allowing them to act quickly and focus on execution.
- Improved Accuracy: By relying on algorithm-driven signals, traders can reduce emotional biases such as fear or greed that often lead to poor decisions. These signals provide objective analysis based on data, increasing the chances of making accurate trades.
- Accessibility: Trading signals make the market more approachable for beginners by offering expert-level guidance. At the same time, seasoned traders use these signals as an additional layer of confirmation to refine their strategies.
- Versatility: Whether you prefer fast-paced day trading or longer-term swing trading, trading signals can be tailored to suit different styles and timeframes, making them flexible tools for a wide range of trading approaches.
For example, during volatile market events like central bank rate decisions, trading signals provide timely alerts that help traders seize profitable opportunities or avoid risks.
Limitations and Risks of Trading Signals
While trading signals can be powerful aids, they are not free from risks. Traders need to recognize potential pitfalls and take proactive measures to minimize them.
- Over-Reliance: Depending entirely on trading signals without applying your own analysis can lead to poor decision-making and increased risk. It’s important to use signals as tools rather than absolute answers.
- False Signals: Because markets can be affected by unpredictable factors, signals sometimes generate inaccurate or misleading recommendations, which may result in losses if not carefully evaluated.
- Limited Personalization: Signals often follow general criteria and may not fully match a trader’s unique risk appetite, style, or objectives, which can reduce their practical value.
- Execution Delays: Even well-timed signals lose effectiveness if there is a delay in receiving the alert or executing the trade, impacting potential gains.
Successful traders combine signals with their own strategies and strict risk management to maximize potential gains.
How to Choose Reliable Trading Signals
Selecting trustworthy signals is crucial. Consider the following criteria:
Transparency
Trustworthy providers openly share their signal generation methods and provide clear, verified performance records. This helps traders understand how signals are created and assess their reliability.
Reputation
Look for signal services with strong user feedback and a solid reputation within the trading community. Positive reviews and industry recognition often indicate consistent quality.
Compatibility
Ensure the signals fit your personal trading style and risk appetite. Signals optimized for scalping, for example, may not suit longer-term swing traders.
Trial Periods
Take advantage of demo accounts or free trial periods to test signals without risking real capital. This hands-on experience helps evaluate signal accuracy and usability.
Support and Education
Reliable providers offer accessible customer support and educational resources to help traders understand and effectively use their signals.
New to trading? Discover how to get started as a beginner.
Adapting Trading Signals to Your Trading Strategies
To get the most value from trading signals, traders should incorporate them into a comprehensive trading plan instead of relying on them alone. Important factors to consider include:
Aligning Signals with Trading Objectives
Choose signals that correspond with your preferred trading timeframe and objectives. For example, traders focused on long-term positions may find short-term scalping alerts irrelevant, while day traders may prioritize signals suited for rapid trades.
Incorporating Variety and Testing
Do not depend exclusively on one source of signals. Blend them with other analytical methods and diversify your trading tactics. Testing new signals on a demo account first helps verify their reliability before using real capital.
Risk Management
Regardless of signal accuracy, managing risk is essential. This involves placing appropriate stop-loss orders and adjusting trade sizes to maintain risk exposure within your comfort zone relative to your overall portfolio.
Regular Review and Adaptation
Consistently track the performance of your signals and market changes to fine-tune your approach. Maintaining a trading journal helps identify which signals work best and highlights areas for improvement.
In Summary
What are trading signals? Trading signals are insightful, data-based alerts that help traders navigate the complexities of financial markets. Ranging from expert-generated manual signals to sophisticated automated AI-driven alerts, they streamline decision-making and improve trading precision. Yet, recognizing their limitations and integrating them with personal judgment and risk controls remains essential for consistent success.
Getting Started with Trading Signals via VT Markets
VT Markets offers a robust trading environment that supports the integration of third-party trading signals, giving traders access to professional insights without providing in-house signals directly. Through compatible tools and plugins, clients can connect signal providers to their VT Markets trading account and act on alerts within a responsive, secure platform.
To get started:
- Open a VT Markets trading account, which can be completed in just a few minutes.
- Connect third-party signal services through supported platforms such as MetaTrader 4 and MetaTrader 5.
- Customize your signal settings to match your preferred trading instruments and strategies.
- Test signals using the VT Markets demo account to evaluate performance before applying them in live trading.
- Execute trades efficiently, combining third-party signals with your own analysis for better-informed decisions.
Start trading with VT Markets today and experience fast execution, transparent pricing, and seamless access to top third-party trading signals—all designed to put you in control.
Frequently Asked Questions (FAQs)
1. What are trading signals?
Trading signals are alerts generated by analysts or algorithms indicating potential buy, sell, or hold opportunities in the market.
2. How reliable are trading signals?
Their reliability varies depending on the provider and market conditions. It’s important to combine signals with your own analysis and risk management.
3. Do trading signals guarantee profits?
No. Trading signals are based on analysis but cannot predict market movements with certainty. Risk management is critical.
4. What types of assets can I get trading signals for?
Forex, stocks, precious metals, and indices typically have available trading signals.
5. Can beginners rely on trading signals?
Yes. Trading signals provide valuable guidance but should be used alongside education and risk management.
6. Should I rely solely on trading signals?
No. Trading signals should be used as tools to complement your strategy, not as the sole basis for decisions.


 | VT Markets")

 | VT Markets")

 | VT Markets")