What Is Futures Trading and How to Trade Them?
Futures trading has become a popular financial tool for many traders and institutions worldwide, including the UK. But what is futures trading exactly, and why should traders consider this dynamic market? This article will guide you through the essentials of futures trading, its benefits and risks, and how to trade futures contracts confidently, especially if you want to trade futures in the UK with a trusted broker like VT Markets.
What Is Futures Trading?
At its core, futures trading involves buying and selling standardized contracts that obligate the buyer or seller to purchase or sell an asset at a predetermined price on a specific date. These contracts can cover various of underlying assets such as commodities (oil, gold, wheat), financial instruments (stock indices, bonds), and even currencies.
Futures contracts provide traders with opportunities to speculate on price movements and hedge against risks. For example, an airline company may use oil futures to protect against fuel price spikes. This form of future trading allows for precise planning and risk management in uncertain markets.
Why Trade Futures?
There are several compelling reasons why traders engage in futures trading:
Wide Range of Markets
Futures trading offers access to a broad selection of markets, including commodities like oil, gold, and agricultural products, and financial instruments such as stock indices, currencies, and government bonds. This wide variety allows traders to explore opportunities across multiple sectors and economic themes, making futures a versatile tool for many trading strategies.
Leverage
One of the defining features of futures contracts is leverage. Traders only need to deposit a small percentage of the contract’s total value as margin. This means you can control a much larger position with less upfront capital, magnifying potential gains and risks. While leverage offers exciting profit potential, it also requires careful risk management.
Liquidity
Futures markets, particularly those active in the UK and globally, are known for their high liquidity. You can enter and exit trades quickly at transparent prices without significant price slippage. High liquidity also tends to reduce trading costs, making futures an attractive option for both short-term and long-term investors.
Diversification
Because futures contracts span a wide range of underlying assets, they provide an excellent way to diversify investment portfolios. By adding futures exposure to commodities, financial indices, or currencies, traders can reduce risk and improve overall portfolio performance.
Hedging
Futures contracts are widely used by businesses and investors to hedge against price volatility. For instance, an airline might buy oil futures to lock in fuel prices and protect itself from sudden price hikes. This hedging capability helps manage uncertainty and stabilize costs or revenues.
Go Long or Short Position
Futures trading allows traders to take either a long position (buy) if they expect prices to rise or a short position (sell) if they anticipate prices will fall. This flexibility enables traders to profit in both bullish and bearish markets, unlike traditional investing, which typically only benefits from rising prices.
For traders looking to trade futures in the UK, the combination of leverage and market accessibility offers exciting profit potential, albeit with risks that must be carefully managed.
Types of Futures Contracts
Futures contracts come in several varieties, including:
Commodity Futures
These contracts involve physical goods that are traded on futures exchanges. Examples include crude oil, natural gas, gold, silver, wheat, corn, and coffee. Commodity futures allow producers, consumers, and traders to hedge against price fluctuations or speculate on future price movements. For instance, a farmer might sell wheat futures to lock in a price before harvest.
Currency Futures
Currency futures are standardized contracts to buy or sell a specific amount of a currency at a set price on a future date. Companies and investors use them to hedge foreign exchange risk or speculate on currency movements. For example, a UK-based exporter might use GBP/USD futures to protect against adverse exchange rate changes when receiving payments in US dollars.
Index Futures
These contracts are based on stock market indices such as the FTSE 100, S&P 500, or Dow Jones. Instead of buying individual stocks, traders can speculate or hedge on the overall market performance. Index futures are popular for their liquidity and broad market exposure, making them useful for portfolio hedging or tactical trading.
Bond Futures
Bond futures involve government or corporate bonds, allowing traders to speculate on or hedge against interest rate changes. For example, a bond futures contract might represent a specific government bond with a fixed maturity date and coupon rate. Traders use these contracts to manage interest rate risk or position themselves based on economic outlooks.
Energy Futures
Energy futures include crude oil, natural gas, gasoline, and heating oil contracts. These futures are critical for energy producers, consumers, and traders who want to hedge price volatility or capitalize on changes in energy markets. For example, airlines may use jet fuel futures to stabilize fuel costs.
Agricultural Futures
These contracts cover farm products such as corn, soybeans, wheat, coffee, cotton, and livestock like cattle and hogs. Agricultural futures help farmers and food companies manage risks related to crop yields, weather, and global demand, while traders use them to speculate on commodity prices.
Understanding the specific type of contract is essential for traders who want to know how to trade futures contracts effectively and align their strategies accordingly.
How to Trade Futures Contracts
Learning how to trade futures contracts requires a structured step-by-step guide:
Step 1: Understand How Futures Trading Works
Before diving in, it’s essential to grasp the fundamentals of futures trading — how contracts function, the role of margins, leverage, and the obligation to buy or sell on the contract expiry date.
Step 2: Select a Reliable Broker
Choose a trusted and reliable futures trading platform such as VT Markets that offers robust tools, transparent pricing, and is regulated in the UK to ensure your funds and trades are secure.
Step 3: Open and Fund Your Account
Complete the registration and verification process with your chosen broker. Deposit funds into your trading account to start placing trades.
Step 4: Research and Analyze
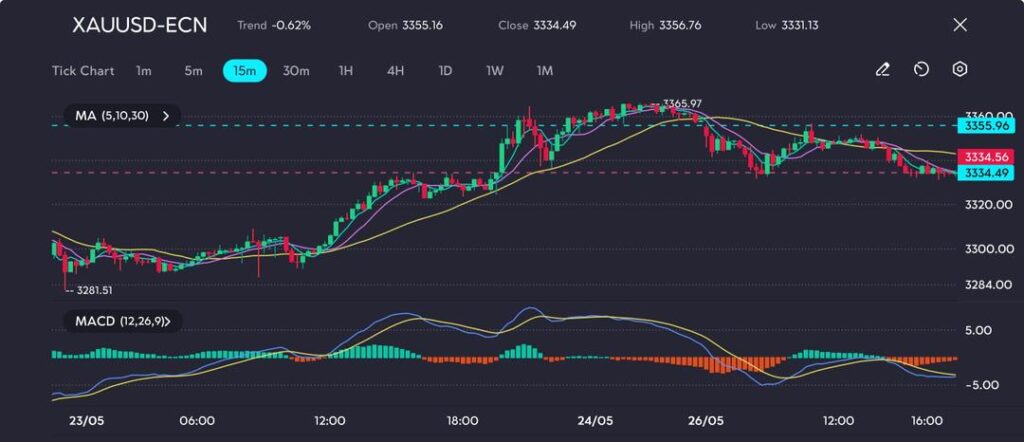
Use fundamental analysis (economic data, news events) and technical analysis (charts, indicators) to identify promising trading opportunities.
Discover the difference between fundamental analysis and technical analysis.
Step 5: Select a Contract
Decide on the specific futures contract that aligns with your trading goals, whether it’s commodity futures, currency futures, index futures, or others.
Step 6: Place a Trade
Open a long position if you anticipate prices will rise, or a short position if you expect a decline, based on your analysis.
Step 7: Implement Risk Management Strategies
Set stop-loss and take-profit levels to control potential losses and lock in profits. Always trade within your risk tolerance and use appropriate position sizing.
Step 8: Monitor and Stay Informed
Track your open positions and stay updated on market news and developments that may impact your trades, adjusting your strategy accordingly.
By following these steps, traders new to futures trading in the UK can build confidence and increase their chances of success.
Common Mistakes to Avoid When Trading Futures Contracts
- Lack of a Clear Trading Plan: Trading impulsively without defined entry, exit, and risk management strategies is a common pitfall that can quickly erode capital.
- Trading Without Fully Understanding the Market: Futures trading involves complex contract specifications and market mechanics. Jumping in without proper knowledge can lead to costly errors. Invest time in learning before trading live.
- Ignoring the Risks of Leverage: While leverage can amplify profits, it also increases potential losses. Many traders underestimate this and risk more than they can afford to lose. Always trade with caution and use leverage responsibly.
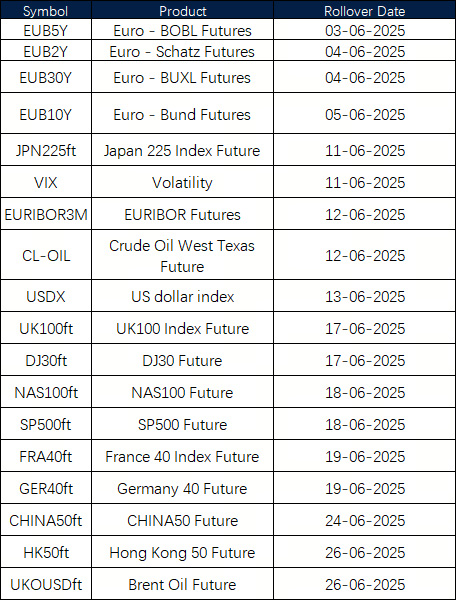
- Neglecting Contract Expiry Dates: Futures contracts have specific expiration dates. Failing to close or roll over positions in time can result in unintended physical delivery or settlement obligations.
- Failing to Maintain Margin Requirements: Traders must keep sufficient funds in their accounts to meet margin calls. Ignoring margin calls can lead to forced liquidation of positions at unfavorable prices.
- Overtrading: Many traders make the mistake of placing too many trades too quickly, often driven by emotion rather than strategy. Overtrading can lead to excessive transaction costs and burnout. Patience and discipline are key.
- Ignoring Market News and Economic Indicators: Futures markets are highly sensitive to economic reports, geopolitical events, and market sentiment. Failing to stay informed can result in unexpected losses or missed opportunities.
- Chasing the Market: Jumping into trades after big price moves, hoping to catch the trend, can be risky. This reactive behavior often results in entering at unfavorable prices and increases the chance of losses.
- Neglecting to Practice on Demo Accounts: Starting live futures trading without practicing on a demo account can lead to costly mistakes. Demo trading helps build familiarity with the platform and refine strategies without risking real money.
Avoiding these mistakes is essential for anyone looking to trade futures in the UK or globally with confidence and success.
In Summary
Futures trading offers versatile opportunities to speculate or hedge across various markets with benefits like leverage, liquidity, and the ability to go long or short. However, success requires understanding how futures work, choosing a reliable broker, conducting thorough research, and practicing disciplined risk management while avoiding common mistakes. For traders in the UK looking to trade futures confidently, selecting a trusted platform like VT Markets can provide the support and tools needed to navigate this dynamic market effectively.
Trade Futures Contracts with VT Markets Today!
Ready to enter the exciting world of futures? VT Markets offers a secure, user-friendly platform tailored for both beginner and experienced traders wanting to trade futures in the UK. Benefit from competitive spreads, fast execution, and comprehensive educational resources on popular platforms like MetaTrader 4 (MT4) and MetaTrader 5 (MT5) that help you master how to trade futures contracts confidently.
Open your account with VT Markets today and start trading futures contracts with confidence and control.
Frequently Asked Questions (FAQs)
1. What is futures trading?
Futures trading involves buying and selling standardized contracts that obligate the purchase or sale of an asset at a predetermined price on a future date. Traders use futures to speculate on price movements or hedge against risks in commodities, currencies, stock indices, and more.
2. How to trade futures contracts?
Learning how to trade futures contracts requires a structured step-by-step guide:
- Step 1: Understand How Futures Trading Works
- Step 2: Select a Reliable Broker
- Step 3: Open and Fund Your Account
- Step 4: Research and Analyze
- Step 5: Select a Contract
- Step 6: Place a Trade
- Step 7: Implement Risk Management Strategies
- Step 8: Monitor and Stay Informed
3. How does futures trading differ from stocks?
Futures contracts involve leverage and have expiration dates, whereas stocks represent ownership in companies without expiration.
4. How do I manage risk when trading futures?
Using stop-loss orders, proper position sizing, and maintaining sufficient margin.
5. What is the difference between futures and options?
Futures contracts obligate the buyer and seller to transact at a set price on a specific date, whereas options give the buyer the right, but not the obligation, to buy or sell an asset.
6. What happens if I hold a futures contract until expiration?
Depending on the contract, you may be required to either settle financially or deliver/take delivery of the underlying asset.
7. How does leverage affect my profits and losses in futures trading?
Leverage amplifies both potential gains and losses because you control a large position with a relatively small margin deposit.
8. Is futures trading suitable for beginners?
While futures trading offers great opportunities, it can be complex and risky. Beginners should start with education, demo accounts, and risk management before trading with real money.


 | VT Markets")
 | VT Markets")


 | VT Markets")