Several key market events are expected to influence the financial markets this week. Specifically, the highly awaited US Consumer Price Index and Producer Price Index will be released. In light of these crucial announcements, we advise traders to approach their trading preparations with caution, considering the potential for heightened market volatility.
Here are some key economic highlights to keep an eye on during the week:
New Zealand Inflation Expectations (9 August 2023)
Inflation expectations in New Zealand declined to 2.79% in Q2 2023 from 3.3% in Q1 2023.
The figures for Q3 2023 will be released on 9 August, with analysts expecting another decrease to 2.5%.
US Consumer Price Index (10 August 2023)
Consumer prices in the US rose 0.2% month-over-month in June 2023 after a 0.1% increase in the previous month.
Analysts anticipate a 0.2% rise in the figures for July, scheduled for release on 10 August.
UK Gross Domestic Product (11 August 2023)
The British economy shrank by 0.1% month-over-month in May 2023, following a 0.2% growth rate in April.
The figures for June are set to be released on 11 August, with analysts expecting the country’s GDP to grow by 0.1%.
US Producer Price Index (11 August 2023)
Producer prices for final demand in the US edged up 0.1% month-over-month in June 2023, following a 0.4% fall seen in May.
The data for July 2023 will be released on 11 August, with analysts expecting a 0.2% increase.
University of Michigan Consumer Sentiment Index (11 August 2023)
The University of Michigan consumer sentiment for the US was revised lower to 71.6 in July 2023 from a preliminary reading of 72.6. It was the highest reading since October 2021 due to the continued slowdown in inflation along with the stabilisation of labour markets.
Analysts expect a reading of 70.9 in the upcoming set of data, due for release on 11 August.
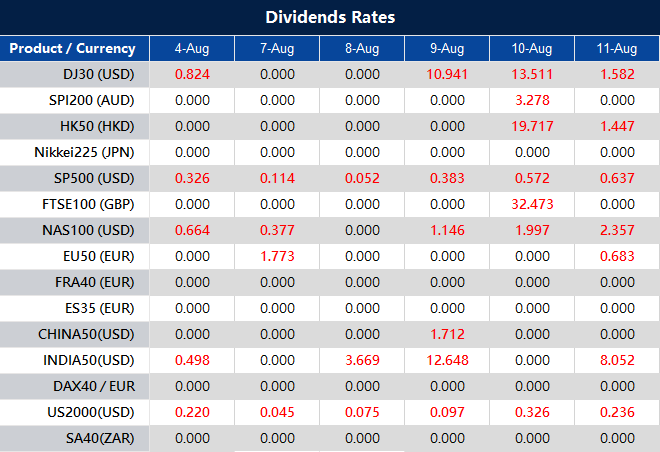
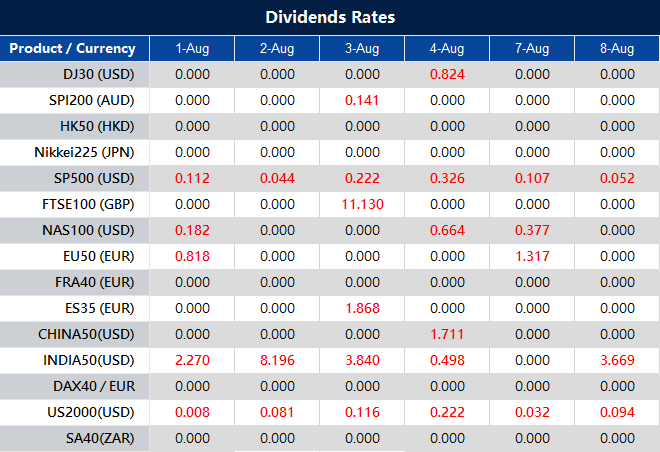
Please note that the dividends of the following products will be adjusted accordingly. Index dividends will be executed separately through a balance statement directly to your trading account, and the comment will be in the following format “Div & Product Name & Net Volume ”.
Please refer to the table below for more details:
The above data is for reference only, please refer to the MT4/MT5 software for specific data.
If you’d like more information, please don’t hesitate to contact info@vtmarkets.com.
The S&P 500 continued its decline for a third day in a row, grappling with the impact of rising bond yields and mixed corporate earnings results. The index fell 0.25%, closing at 4,501.89, while the Dow Jones Industrial Average also lost 0.19%. The Nasdaq Composite inched down by 0.1% at the end of the trading day. The surge in the benchmark 10-year Treasury yield, reaching around 4.18% – its highest since November 2022, added pressure to the real estate sector and resulted in a spike in the Cboe Volatility index. Utilities were also impacted, losing 2.3%.
Some experts on Wall Street highlighted that the market had been overdue for a pause or minor correction, following months of bullish performance. The recent trend of eroding momentum raised concerns, although the longer-term outlook remained positive. The week’s busy earnings reports included chipmaker Qualcomm, which saw an 8.2% drop after disappointing results, and PayPal, which shed 12.3% despite posting in-line results. Meanwhile, Expedia experienced a significant plunge of 16.4% as its gross bookings fell short of expectations.
The market’s focus shifted to tech giants Apple and Amazon, set to release their earnings reports after trading hours. So far, approximately 79% of S&P 500 companies have issued quarterly reports, with around 82% surpassing expectations, but overall earnings are expected to be about 5% lower than the previous year. In the midst of these developments, the Bank of England raised interest rates by 25 basis points to tackle inflation. Additionally, Wall Street kept a close eye on economic data, including weekly jobless claims and second-quarter productivity figures, which showed slight improvements.
On Thursday, the overall market declined by 0.25%. The energy sector showed a notable gain of 0.95%, while consumer discretionary and financial sectors also saw modest increases of 0.34% and 0.07%, respectively. On the other hand, the real estate and utilities sectors experienced significant losses of 1.35% and 2.29%, respectively. Additionally, the information technology sector declined by 0.32%, health care by 0.50%, and industrials and materials both dropped by 0.61% and 0.60%, respectively. Communication services and consumer staples also faced minor declines of 0.17% each.
Major Pair Movement
The dollar index experienced a 0.11% decline, led by a 0.48% loss in USD/JPY, as mixed U.S. data weighed on market sentiment ahead of Friday’s employment report. The dollar’s recent recovery was interrupted due to rising Treasury yields compared to bunds, JGBs, and gilts, though it had already recovered most of its late June to July slide. The markets eagerly awaited Friday’s jobs report to gauge its potential impact on monetary policy.
During Thursday’s trading, long dollar positions were squared off, partly driven by signs that the recent surge in longer-term Treasury yields might have reached a near-term peak. EUR/USD rebounded slightly, while USD/CNH and USD/JPY experienced losses, contributing to profit-taking on long dollar positions. The sharp fall in the yen was influenced by the Bank of Japan’s decision to double the hard cap on 10-year JGB yields, raising concerns over potential Japanese selling of Treasury holdings. Sterling remained flat after the Bank of England’s 25bp rate hike, which fell short of expectations for a 50bp hike. Additionally, Brent and WTI crude oil prices rose following Saudi Arabia’s decision to extend production cuts, impacting USD/NOK and AUD/USD.
EUR/USD Stays Steady Ahead of US Employment Data Despite Limited Market Impact
The EUR/USD remained flat during a quiet session, trading around 1.0940, as investors awaited crucial US employment data. On the economic front, Germany reported lower-than-expected June exports and imports, while Eurostat revealed a decline in the Producer Price Index (PPI) for the Euro area. The Bank of England’s rate hike initially boosted EUR/GBP, but gains were later reversed. In the US, data on initial Jobless Claims and Unit Labor Costs were released, with focus shifting to the upcoming Nonfarm Payrolls report, expected to show an increase of 200,000 jobs.
According to technical analysis, the EUR/USD remained flat on Thursday as the market awaited today’s US Non-farm data, reaching the middle band of the Bollinger Bands. Currently, the price is moving at the middle band, creating a narrow gap between the upper and lower bands of the Bollinger Bands. The Relative Strength Index (RSI) currently stands at 44, suggesting that the EUR/USD is back in consolidation mode. Please be aware that we expect high volatility in the EUR/USD today as the US Non-Farm data will be released.
Resistance: 1.1038, 1.1121
Support: 1.0915, 1.0839
XAU/USD (4 Hours)
XAU/USD Consolidates Losses as US Dollar Strength Persists Amid Labor Market Concerns
On Thursday, XAU/USD traded in the $1,930 price zone, consolidating losses after hitting its lowest point in almost a month at $1,929.48 per troy ounce. The decline was attributed to the continued strength of the US Dollar, which benefited from a somber market sentiment, leading to increased government bond yields and impacting equities. Market players are worried that the tight US labor market will prompt the Federal Reserve to maintain its tightening path for a longer duration than expected. Despite signaling at least one more rate hike, uncertainty prevails as tepid economic indicators suggest a possible pause. The July Nonfarm Payrolls Report (NFP) is eagerly awaited to gain more clarity on the employment situation in the US.
According to technical analysis, on Thursday, the XAU/USD remained flat, with the upper and lower bands of the Bollinger Bands moving closer together. Currently, the price is slightly below the middle band of the Bollinger Bands. The Relative Strength Index (RSI) is currently at 39, indicating that the XAU/USD pair is still slightly bearish.
As part of our commitment to provide the most reliable service to our clients, there will be server maintenance this weekend.
Maintenance Hours :
5th of August 2023 (Saturday) 14:00 – 18:00 (GMT+3)
Please note that the following aspects might be affected during the maintenance:
1. The price quote and trading management will be temporarily disabled during the maintenance. You will not be able to open new positions, close open positions, or make any adjustments to the trades.
2. There might be a gap between the original price and the price after maintenance. The gaps between Pending Orders, Stop Loss and Take Profit will be filled at the market price once the maintenance is completed.
3. Please refer to MT4/MT5 for the latest update on the completion and market opening time. Our services will be back online once the maintenance is completed.
Thank you for your patience and understanding about this important initiative.
If you’d like more information, please don’t hesitate to contact info@vtmarkets.com.
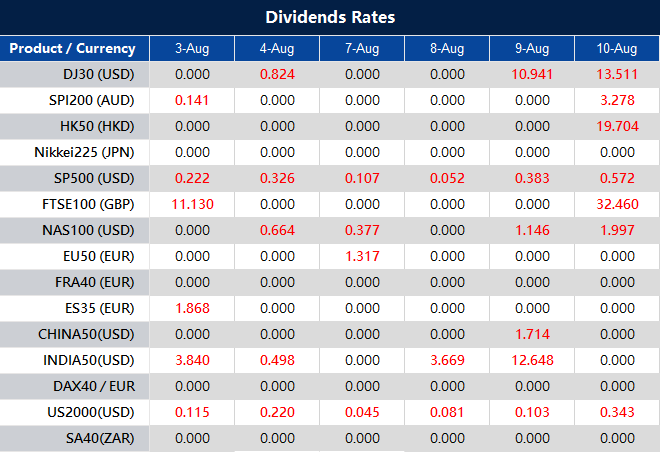
Please note that the dividends of the following products will be adjusted accordingly. Index dividends will be executed separately through a balance statement directly to your trading account, and the comment will be in the following format “Div & Product Name & Net Volume ”.
Please refer to the table below for more details:
The above data is for reference only, please refer to the MT4/MT5 software for specific data.
If you’d like more information, please don’t hesitate to contact info@vtmarkets.com.
A selloff gripped the stock market on Wednesday as the Nasdaq Composite suffered its worst day since February. The downturn was triggered by Fitch Ratings’ decision to downgrade the long-term rating for the U.S. from AAA to AA+, citing concerns about the expected fiscal deterioration over the next three years. This move fueled risk-off sentiment, causing the tech-heavy index to plummet by 2.17% and the S&P 500 to retreat by 1.38%. Leading the declines were technology stocks, including major players like Amazon, Alphabet, and Microsoft, which saw their share prices drop by more than 2% each. The 10-year Treasury yield also surged to its highest level since November, further exacerbating the sell-off.
Despite the rating downgrade, some experts viewed the market correction as a natural part of the market cycle after an extended period of growth. The economy demonstrated resilience, and conditions were notably different compared to the last time the U.S. experienced a rating downgrade. Earnings season proved robust, with approximately 82% of S&P 500 companies reporting positive surprises. While the downgrade did impact investor sentiment, many remained optimistic about the overall economic outlook and market trends, considering the selloff as a constructive rotation rather than a sign of an imminent market downturn.
On Wednesday, the overall stock market experienced a decline of 1.38%. Among the sectors, Consumer Staples showed a slight increase of 0.25%, while Health Care gained 0.06%. On the other hand, the Communication Services sector suffered the most significant drop of 2.07%, closely followed by Information Technology, which declined by 2.59%. Other sectors that experienced losses were Energy (-1.34%), Materials (-1.23%), Consumer Discretionary (-1.84%), Industrials (-1.08%), Financials (-0.89%), Real Estate (-0.44%), and Utilities (-0.01%).
Major Pair Movement
The dollar index surged by 0.5% as a safe-haven response to Fitch’s U.S. credit downgrade and positive ADP data boosted investor confidence. Despite stock market losses leading to a decline in Treasury yields, traders awaited upcoming ISM non-manufacturing and employment reports, considered better indicators of economic growth and the labor market. The chances of further Fed rate hikes remained low, and the rebound in Treasury yields was driven by higher longer-term tenors due to the Treasury’s unexpected borrowing plans. Although Fitch’s credit downgrade and increased borrowing estimates created concerns, portfolio managers were less likely to exit Treasury holdings due to the continued backing of the U.S. government.
EUR/USD experienced a 0.34% decline, approaching the uptrend line from May, reflecting worries about economic weaknesses in Germany and China versus hopes for a soft landing in the U.S. Market expectations showed limited possibilities of further ECB hikes and a higher peak for the Fed’s rates. USD/JPY initially dropped on haven yen gains following the Fitch news but later recovered as JGB yields rose despite BoJ buying. Sterling faced losses earlier but recovered slightly after a poll showing lower UK public inflation expectations. A 25bp hike was favored over a 50bp one in the upcoming BoE meeting due to higher inflation levels in the UK compared to the ECB and the Fed. The Australian dollar and yuan both depreciated against the dollar due to risk-off sentiment and uncertainty about Chinese economic stimulus plans.
Looking ahead, investors were awaiting several key economic reports on Thursday, including Challenger layoffs, jobless claims, ULC, and factory orders, as a prelude to Friday’s jobs report. These data points were expected to provide further insights into the state of the economy and may impact market sentiment and the performance of various currencies.
Picks of the Day Analysis
EUR/USD (4 Hours)
EUR/USD Breaks Key Support Levels Amid Strong US Dollar Performance and Risk Aversion
The EUR/USD pair experienced a significant drop below key support levels, reaching 1.0919, the lowest since July 7, due to the US dollar’s robust performance and risk aversion triggered by Fitch’s downgrade of the US sovereign rating. Despite initial gains after the announcement, the pair resumed its downward trend as the US dollar strengthened, breaking below 1.0960. The US Dollar Index rose to a four-week high above 102.50 following positive labor market data, with private employment increasing by 324K according to ADP. More US employment data is expected, making it crucial for market sentiment. On the horizon, Germany’s trade balance data, service PMIs, Eurostat’s Producer Price Index, and the Bank of England’s decision will be critical for the Euro’s performance.
According to technical analysis, the EUR/USD moved slightly lower on Wednesday and reached the lower band of the Bollinger Bands. Currently, the price is slightly above the lower band of the Bollinger Bands. The Relative Strength Index (RSI) currently stands at 34, suggesting that the EUR/USD is starting to move lower, indicating a bearish mode.
Resistance: 1.1038, 1.1121
Support: 1.0915, 1.0839
XAU/USD (4 Hours)
XAU/USD Faces Volatility Amid Mixed Market Sentiment and Encouraging US Data
The XAU/USD pair experienced volatility as market sentiment fluctuated and encouraging US data supported the US Dollar. Peaking at $1,954.81 per troy ounce, the pair currently trades around $1,935. The dismal market mood, driven by Fitch’s US debt rating downgrade and debt ceiling turmoil, contributed to risk-off sentiment, leading to red global indexes and a rally in government bond yields. However, the US Dollar recovered its poise after the release of positive ADP Employment Change data, showing the private sector added 324K new job positions in July, surpassing market expectations. As the labor market remains tight, speculation grows about further monetary tightening by the Federal Reserve, impacting the XAU/USD pair’s performance amid mixed outlooks and cautious optimism.
According to technical analysis, the XAU/USD fell on Wednesday and reached the lower band of the Bollinger Bands. Currently, the price is moving slightly above the lower band of the Bollinger Bands. The Relative Strength Index (RSI) currently stands at 36, which suggests that the XAU/USD pair is slightly bearish.
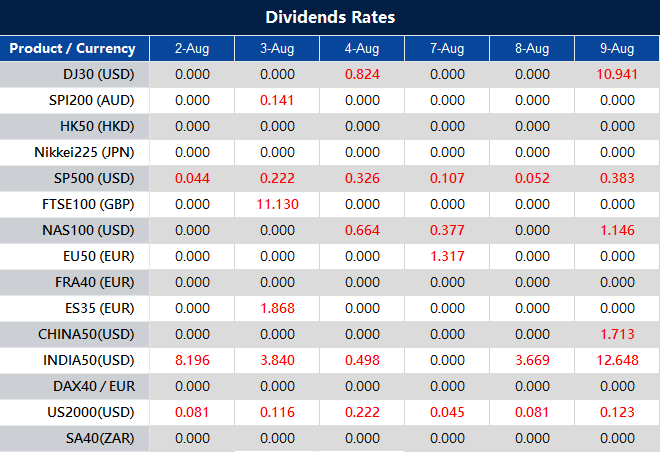
Please note that the dividends of the following products will be adjusted accordingly. Index dividends will be executed separately through a balance statement directly to your trading account, and the comment will be in the following format “Div & Product Name & Net Volume ”.
Please refer to the table below for more details:
The above data is for reference only, please refer to the MT4/MT5 software for specific data.
If you’d like more information, please don’t hesitate to contact info@vtmarkets.com.
Starting in August, the S&P 500 experienced a 0.27% decline, with the Nasdaq Composite also dropping by 0.43%, while the Dow Jones Industrial Average gained 0.2%. Several companies reported mixed results, leading to varied stock movements. Pharmaceutical giant Merck pulled back 1.3% despite exceeding revenue expectations, while Caterpillar’s strong results boosted shares by 8.9%. On the other hand, Pfizer fell 1.2% due to declining Covid product sales, and Uber slid 5.7% on mixed earnings. JetBlue also tumbled 8.3% after reducing its guidance due to slowing domestic travel.
Market analysts attributed these fluctuations to overbought conditions, given the market’s strong performance this year and solid quarterly earnings. Despite over 160 S&P 500 constituents reporting second-quarter results, with 82% exceeding earnings expectations, analysts anticipate a 7.1% earnings decline from a year ago and a third consecutive quarter of falling profits. Economic indicators, including job openings data and manufacturing data showing a continued contraction, were also closely assessed by Wall Street.
On Tuesday, all sectors experienced a 0.27% decline, except for Industrials, which rose by 0.32%, and Information Technology, which saw a slight increase of 0.09%. Financials and Real Estate both dipped by 0.03% and 0.13%, respectively. Communication Services and Materials experienced greater losses, with declines of 0.29% and 0.44% respectively. The Energy sector suffered a 0.46% decrease, while both Consumer Staples and Health Care declined by 0.51%. The Consumer Discretionary sector faced the most significant setback, with a notable 1.15% decline, and Utilities also experienced a considerable 1.26% drop.
Major Pair Movement
EUR/USD is trading lower due to influences from China’s yuan and U.S. interest rates. The yuan’s recent appreciation against the dollar stalled, raising concerns about China’s economy and leading to yuan selling. Eurozone data also indicates a slowdown, potentially resulting in a less hawkish ECB stance and weighing on EUR/USD rates.
U.S. yields remain elevated, and investors expect the Fed to keep rates higher for longer, increasing the dollar’s yield advantage over the euro. Key U.S. data risks are in focus, and upbeat data could further support U.S. rates and the dollar. USD/CAD eyes cloud base support at 1.3311 amid a gloomy global growth outlook, while GBP/USD faces relentless bearish pressure as the BoE’s more-hawkish rate outlook diminishes. USD/JPY is on track to revisit June’s 2023 peak with support at 142. Resilient U.S. data and a soft landing narrative are expected to strengthen the USD.
Picks of the Day Analysis
EUR/USD (4 Hours)
EUR/USD Holds Above Support Amid Mixed Data and Resilient Dollar
The EUR/USD dropped towards last week’s lows but rebounded during the American session, staying above the crucial support area of 1.0950. The US Dollar remains resilient, but its momentum against the Euro appears to be fading. The Final Eurozone PMI showed little change, while Germany’s unemployment rate fell to 5.6% in July. However, the interest rate market indicates low odds of another rate hike from the ECB. The Greenback lost strength against the Euro following mixed US data, with the JOLTS Job Openings report and ISM Manufacturing PMI coming in below expectations. Despite the numbers, US yields saw modest increases. The market focus now shifts to upcoming US employment data, including the ADP report and Nonfarm Payrolls on Friday.
According to technical analysis, the EUR/USD moved slightly higher on Tuesday and reached the middle band of the Bollinger Bands. Currently, the price is still at the middle band of the Bollinger Bands, indicating that the EUR/USD is in a consolidating mode. The Relative Strength Index (RSI) currently stands at 43, suggesting that the EUR/USD is starting to move back to a neutral stance.
Resistance: 1.1038, 1.1121
Support: 1.0915, 1.0839
XAU/USD (4 Hours)
XAU/USD Rebounds on US Credit Rate Cut Amid Economic Concerns
Gold has rebounded to around $1,950 in the Asian session after justifying the United States government’s rate cut by Fitch Ratings. The metal pared previous losses, but technical indicators suggest a bearish trend in the near term. The market sentiment turned negative due to disappointing earnings from big names, leading to a surge in demand for the safe-haven US Dollar. Additionally, US data disappointed, with manufacturing PMI missing estimates. The situation remains uncertain, and investors are closely watching employment clues for further market direction.
According to technical analysis, the XAU/USD fell on Tuesday and is now approaching the lower band of the Bollinger Bands. Currently, the price is moving in the middle between the lower and middle bands of the Bollinger Bands, indicating that there is still potential for Gold to move lower and reach the lower band. The Relative Strength Index (RSI) currently stands at 45, which suggests that the XAU/USD pair is in a neutral stance but slightly bearish.
Please note that the dividends of the following products will be adjusted accordingly. Index dividends will be executed separately through a balance statement directly to your trading account, and the comment will be in the following format “Div & Product Name & Net Volume ”.
Please refer to the table below for more details:
The above data is for reference only, please refer to the MT4/MT5 software for specific data.
If you’d like more information, please don’t hesitate to contact info@vtmarkets.com.