Several key economic releases are expected to impact the financial markets this week. Notably, attention will be on the US Jobs Report, the rate statement from the Reserve Bank of Australia (RBA), and the rate statement from the Reserve Bank of New Zealand (RBNZ). Given the potential for heightened market volatility, we advise traders to approach their trading activities with caution.
Here are some of the notable market highlights for this week:
Reserve Bank of Australia Rate Statement (3 October 2023)
The Reserve Bank of Australia (RBA) maintained its cash rate at 4.1% during its final meeting under Governor Philip Lowe in September 2023, extending the rate pause for the third successive month.
Under the new Governor Michele Bullock, analysts predict that the RBA will keep its cash rate at 4.1% following its next meeting on 3 October.
Reserve Bank of New Zealand Rate Statement (4 October 2023)
The Reserve Bank of New Zealand (RBNZ) maintained its official cash rate (OCR) at 5.5% during its August 2023 meeting, extending its rate pause for the second consecutive month.
Analysts expect the OCR to remain at 5.5% following the central bank’s upcoming meeting on 4 October.
US ISM Services PMI (4 October 2023)
The US Institute of Supply Management (ISM) Services PMI jumped from 52.7 in July 2023 to 54.5 in August 2023, the largest growth in the services sector in six months.
Updated data will be released on 4 October, with analysts expecting the index to be lowered to 53.6.
Canada Employment Change (6 October 2023)
39,900 jobs were added to the Canadian economy in August 2023. Meanwhile, the unemployment rate held steady at 5.5%, maintaining its level from the previous month.
The figures for September are scheduled for release on 6 October, with analysts anticipating the addition of 17,000 new jobs. However, the unemployment rate is expected to rise slightly to 5.6%.
US Jobs Report (6 October 2023)
187,000 jobs were added to the US economy in August 2023. However, the unemployment rate rose to 3.8%, the highest level since February 2022.
The figures for September 2023 are set to be released on 6 October. Analysts anticipate the addition of 163,000 jobs. Additionally, the unemployment rate is expected to decrease slightly to 3.7%.
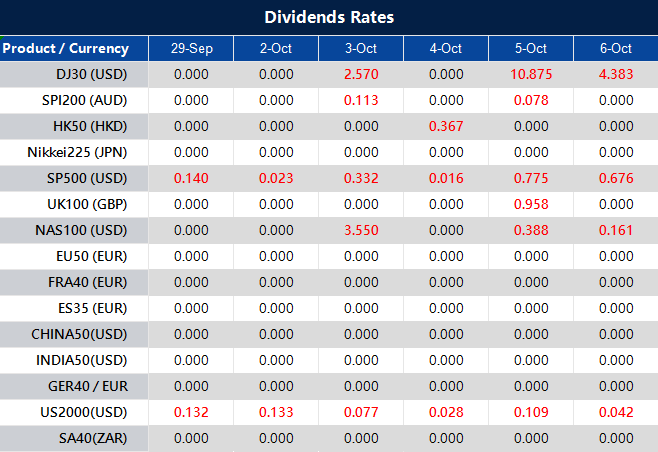
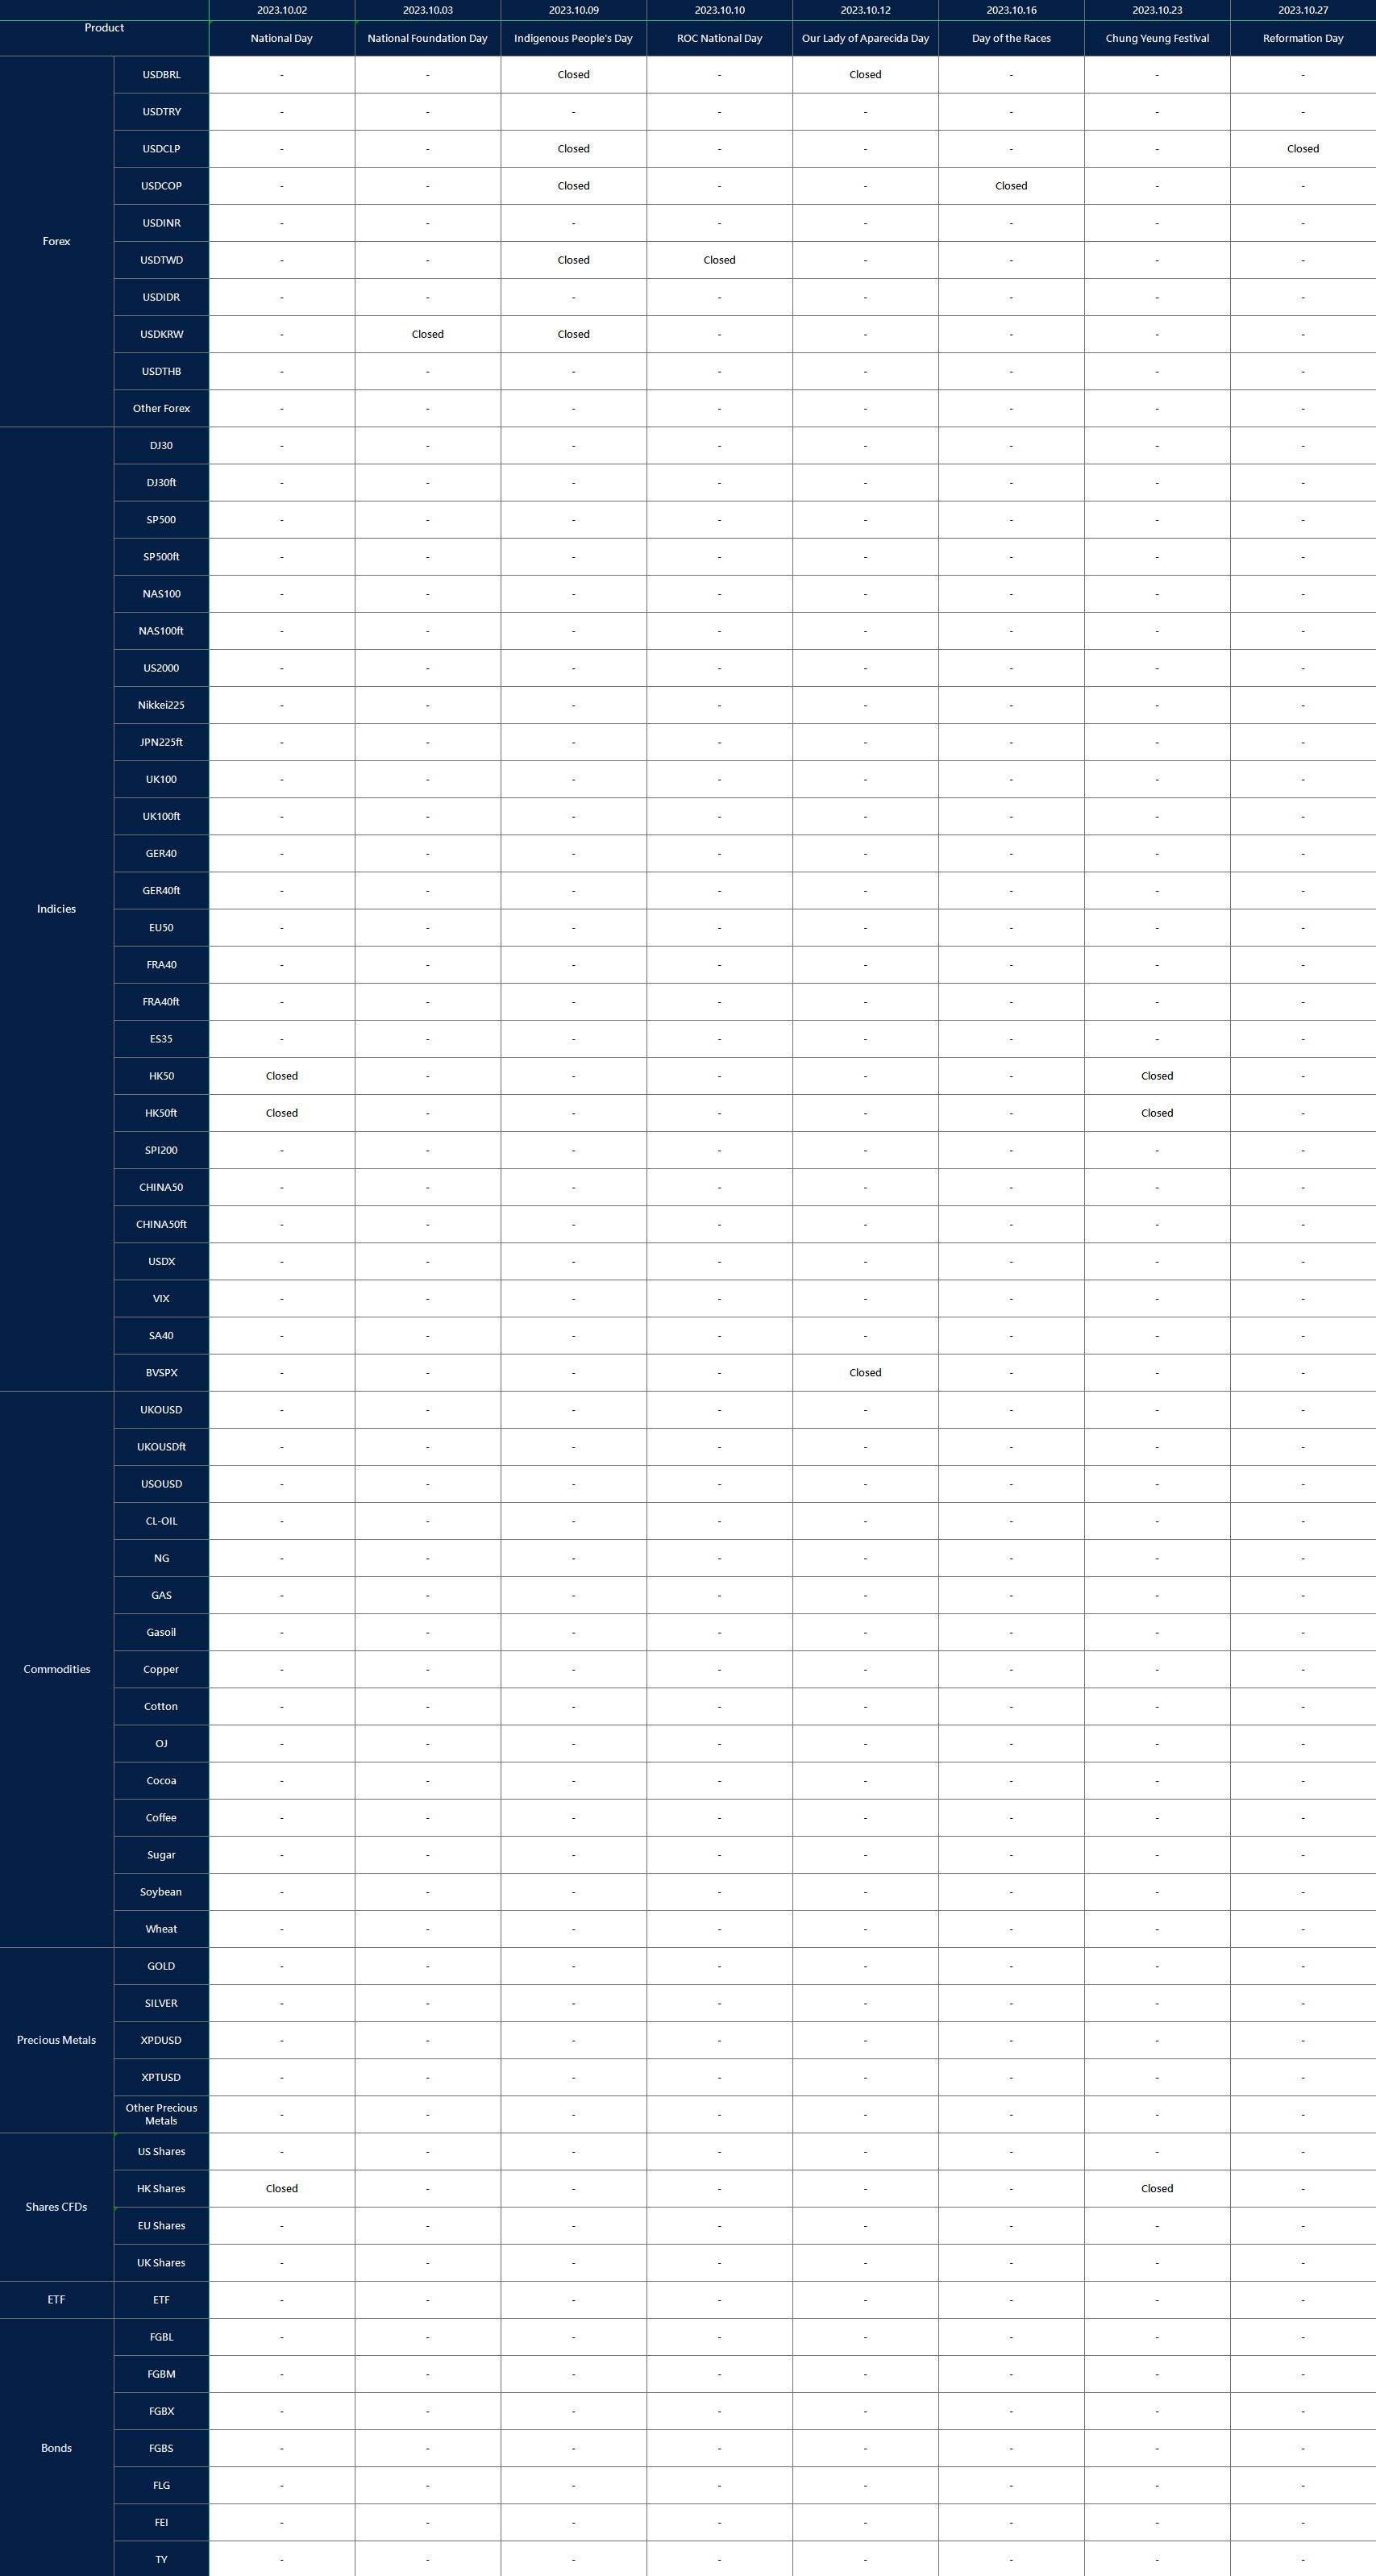
Please note that the dividends of the following products will be adjusted accordingly. Index dividends will be executed separately through a balance statement directly to your trading account, and the comment will be in the following format “Div & Product Name & Net Volume ”.
Please refer to the table below for more details:
The above data is for reference only, please refer to the MT4/MT5 software for specific data.
If you’d like more information, please don’t hesitate to contact info@vtmarkets.com.
Written on September 29, 2023 at 9:02 am, by anakin
On Thursday, the stock market witnessed a rebound as Wall Street aimed to recover from recent losses. The Dow Jones Industrial Average and Nasdaq Composite posted gains of 0.35% and 0.83%, respectively, while the S&P 500 came close to reaching the 4,300 marks with a 0.59% increase. Despite the challenging month and quarter, optimism returned due to a decrease in Treasury yields from multiyear highs and positive economic data showing a resilient labor market. The US dollar also faced a decline, largely influenced by a rebound in the EUR/USD currency pair and evolving monetary policies from the European Central Bank and the US Federal Reserve. Amid these factors, concerns over fiscal difficulties and potential government shutdowns persist.
Stock Market Updates
In the stock market update, on Thursday, stocks showed signs of recovery as Wall Street attempted to bounce back from the steep losses experienced earlier in the month. The Dow Jones Industrial Average rose by 116.07 points, or 0.35%, reaching 33,666.34, while the S&P 500 added 0.59%, just falling short of the key 4,300 level, closing at 4,299.70. The Nasdaq Composite saw a significant gain of about 0.83%, closing at 13,201.28. However, it’s worth noting that stocks have faced a challenging month and quarter, with the Dow expected to end September down 3% and the quarter down more than 2%. The S&P 500 is slated to finish the month with a 4.6% decline and the quarter with a 3.4% decrease, while the Nasdaq is on track to end both the month and quarter lower by 5.9% and 4.3%, respectively.
One key factor influencing market sentiment is the movement in Treasury yields, which have been rising. Investors have been concerned about the potential for higher interest rates and the impact on equities. However, on the positive side, Treasury yields eased from multiyear highs, providing some relief to the stock market. Additionally, positive economic data showing a resilient labor market with lower-than-expected jobless claims helped bolster market confidence. Investors are also keeping an eye on inflation metrics, particularly the personal consumption expenditures price index, which is the Federal Reserve’s preferred gauge of inflation. Moreover, political developments in Washington, specifically negotiations on a U.S. spending bill, are being closely monitored, as they could impact market dynamics in the near term.
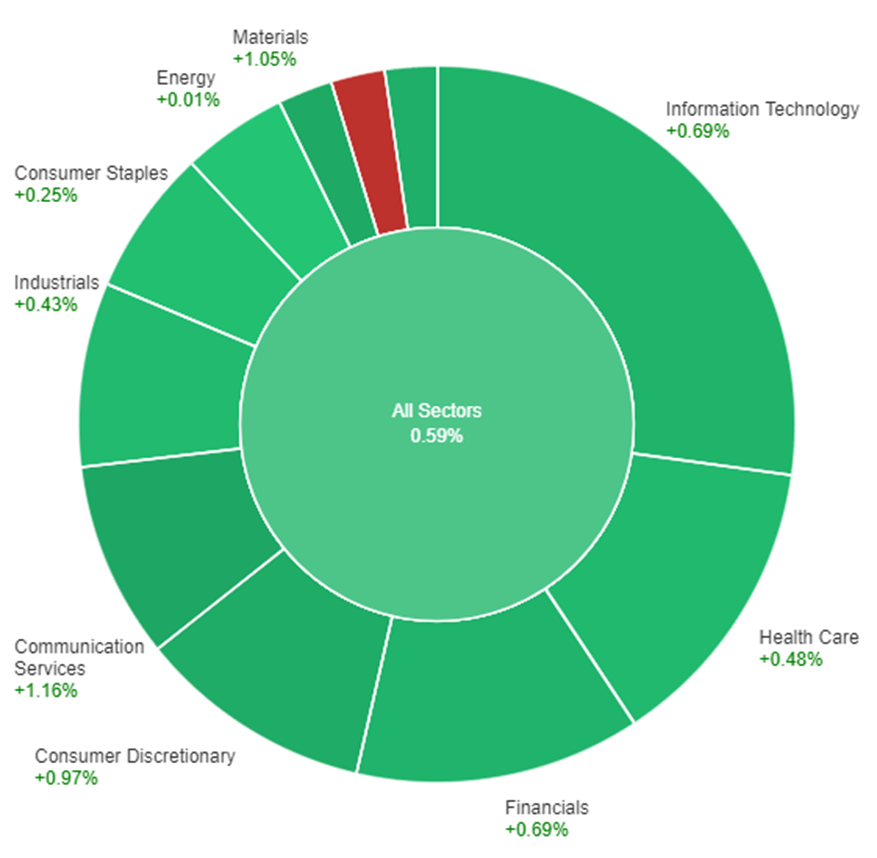
On Thursday, across all sectors, there was a modest increase in the market, with a gain of 0.59%. Notably, Communication Services, Materials, and Consumer Discretionary sectors saw even stronger performance, with gains of 1.16%, 1.05%, and 0.97% respectively. The Real Estate, Financials, and Information Technology sectors also experienced positive growth, with gains of 0.85%, 0.69%, and 0.69%. Health Care and Industrials sectors had more moderate increases, with gains of 0.48% and 0.43%. However, Consumer Staples saw a smaller gain of 0.25%. The Energy sector only saw a minimal increase of 0.01%. In contrast, the Utilities sector faced a significant decline, with a loss of -2.19% on Thursday.
Currency Market Updates
In the latest currency market updates, the US dollar faced a notable decline, with the dollar index slipping by 0.37%. A significant contributor to this fall was the impressive 0.5% rebound in the EUR/USD currency pair, which had been deeply oversold. The pair found crucial support at the 1.0482 low from January 6, 2023, particularly toward the end of the month. This recovery was bolstered by a substantial rise in bund-Treasury yield spreads. Interestingly, the European Central Bank (ECB), despite German CPI figures coming in slightly below forecasts and reaching their lowest levels since the Russian invasion of Ukraine, indicated that it might not raise interest rates further. Instead, the ECB is in the process of unwinding its previous quantitative easing and bank-supportive policies, while fiscal policymakers in the region are grappling with rising costs. On the US front, concerns loom over potential fiscal difficulties, including the possibility of a government shutdown. The Federal Reserve’s commitment to maintaining higher interest rates for an extended period was also questioned by some, including Fed’s Austan Goolsbee. Though US jobless claims remained slightly below forecast, the pending home sales plummeted by 7.1% from July to August, hinting at a potential drop in September’s existing home sales, which could reach their lowest point in over a decade.
Moreover, in the context of the currency market, USD/JPY experienced a 0.2% decline due to a minor drop in Treasury-JGB yield spreads. Nevertheless, despite the promising yield spreads, the primary factor holding back USD/JPY’s advance is the fear of Japanese foreign exchange intervention. While most of the market’s attention is on the 150 level as a potential intervention trigger point, it could potentially break out above 2023’s channel top towards 2022’s 32-year high at 151.94, mirroring the scenario that triggered interventions in October 2022. Japanese officials have stated that they do not defend specific currency levels but rather respond to excessive volatility. However, recent price action has not been notably volatile. Additionally, the British pound rose by 0.46% following a recent low, which marked an 8% slide since its highs in July. This rebound was supported by the recovery of two-year gilts-Treasury yield spreads. Furthermore, the slight drop in Treasury yields, combined with a rebound in risk sentiment and pullbacks in both the dollar and oil prices, contributed to a 1.1% rise in AUD/USD and a 0.35% fall in USD/CNY. Upcoming data releases are set to include Tokyo CPI, Japan’s job market indicators, industrial production, and retail sales, as well as eurozone CPI figures, followed by the release of U.S. core PCE data, income and spending metrics, Michigan sentiment numbers, and Chicago PMI data.
Picks of the Day Analysis
EUR/USD (4 Hours)
EUR/USD Rebounds as US Dollar Correction Pauses Amidst Robust Economic Data
In a notable Thursday surge, the EUR/USD pair made a strong comeback from recent monthly lows, nearing the 1.0600 level, thanks to a brief halt in the US Dollar’s bullish streak driven by positive US economic indicators. While the US economy continued to show signs of strength, including a 2.1% annualized Q2 GDP growth rate and lower-than-expected Initial Jobless Claims, market sentiment weighed on the greenback. The Euro’s performance appeared relatively unaffected by the European Central Bank’s current stance, with market expectations leaning towards no October rate hike. Though comments from ECB members had limited influence, data, such as Germany’s falling annual inflation rate and resilient business and consumer sentiment indicators, helped bolster the Euro’s position, with Friday’s Eurozone inflation figures eagerly awaited.
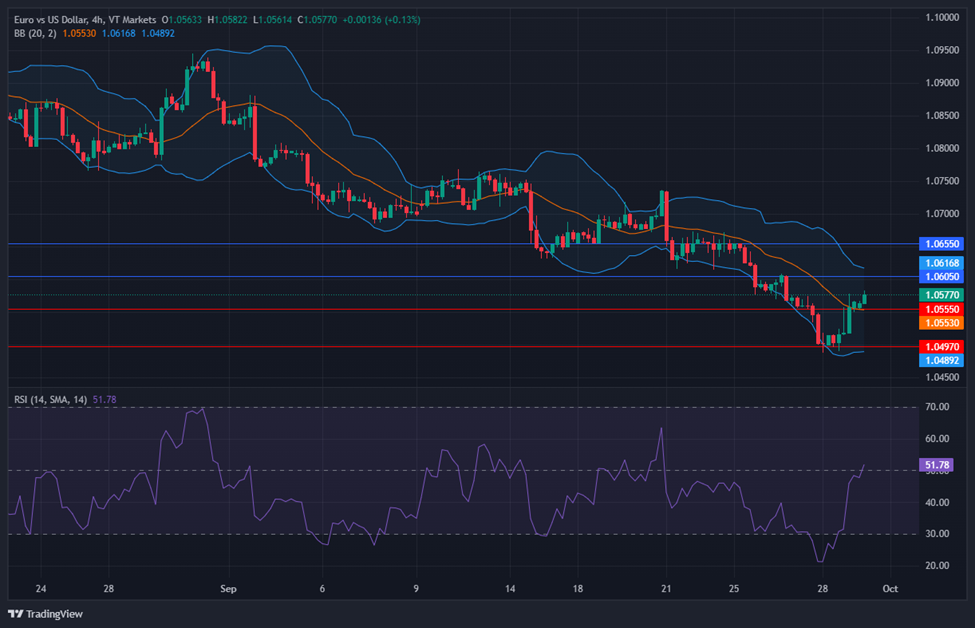
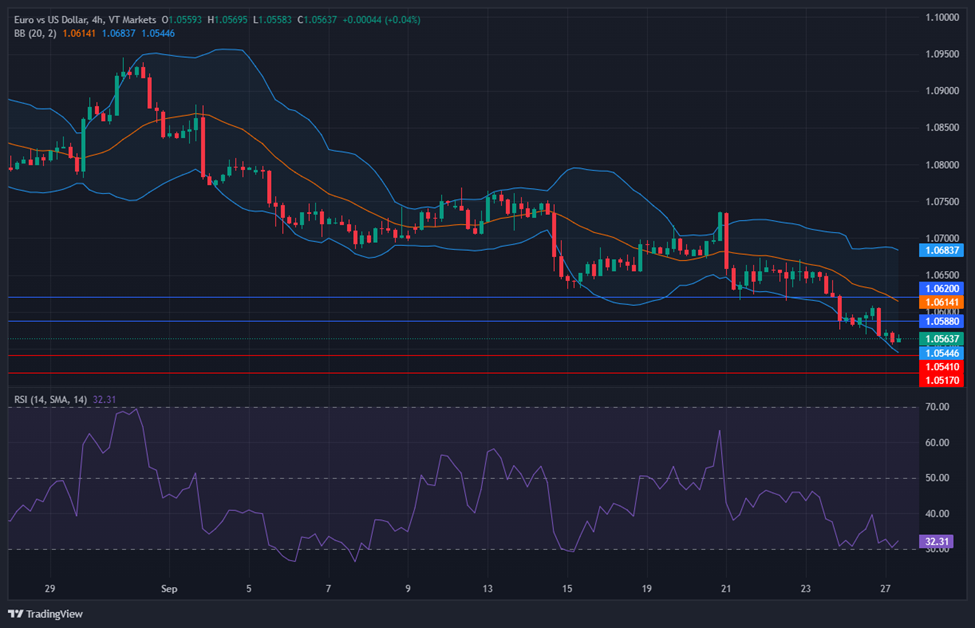
According to technical analysis, EUR/USD moved higher on Thursday, reaching the middle band of the Bollinger Bands. It is currently trading above the middle band, suggesting the potential for further gains to reach the upper band. The Relative Strength Index (RSI) is at 51, indicating that EUR/USD is attempting to return to a neutral stance.
Resistance: 1.0547, 1.0605
Support: 1.0488, 1.0440
XAU/USD (4 Hours)
XAU/USD Hits Six-Month Low as US Dollar Gains Amid Positive Economic Data
On Thursday, the price of gold continued its decline, reaching $1,857.66 per troy ounce, its lowest point since early March. The US Dollar strengthened against gold due to improved market sentiment driven by positive macroeconomic data, including the confirmation of a 2.1% Q2 Gross Domestic Product (GDP) and better-than-expected Initial Jobless Claims. Additionally, government bond yields retreated from recent highs, with the 10-year Treasury note at 4.61% and the 2-year bond at 5.08%, down 12 basis points from recent highs following the Federal Reserve’s monetary policy announcement. Investors now await the latest US inflation data, particularly the August Personal Consumption Expenditures (PCE) Price Index, with the core annual reading expected to be 3.9%, slightly below July’s 4.2%.
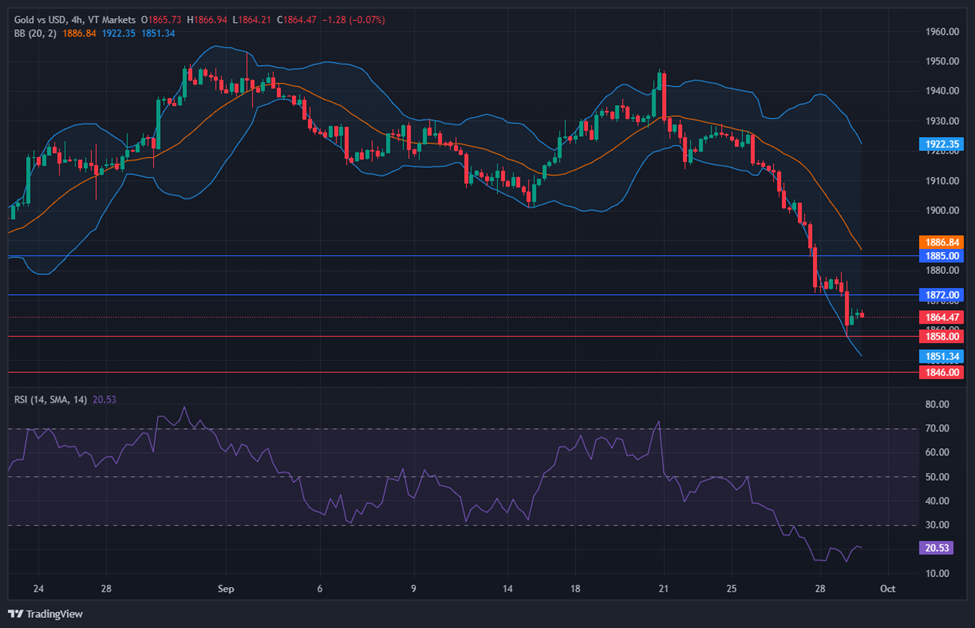
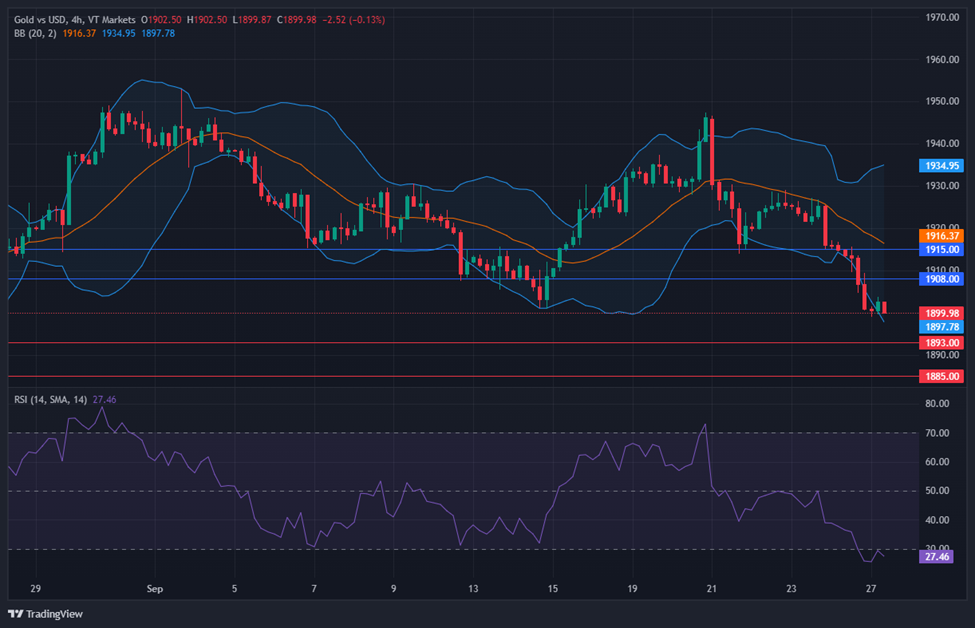
According to technical analysis, XAU/USD moved lower on Thursday, creating downward pressure on the lower band of the Bollinger Bands. Currently, the price is consolidating above the lower band, suggesting potential consolidation for today. The Relative Strength Index (RSI) is currently at 20, signifying a bearish bias for the XAU/USD pair.
Resistance: $1,872, $1,885
Support: $1,858, $1,846
Economic Data
Currency
Data
Time (GMT + 8)
Forecast
CAD
GDP m/m
20:30
0.1%
USD
Core PCE Price Index m/m
20:30
0.2%
USD
Revised UoM Consumer Sentiment
22:00
67.7
Written on September 29, 2023 at 3:19 am, by anakin
Please note that the dividends of the following products will be adjusted accordingly. Index dividends will be executed separately through a balance statement directly to your trading account, and the comment will be in the following format “Div & Product Name & Net Volume ”.
Please refer to the table below for more details:
The above data is for reference only, please refer to the MT4/MT5 software for specific data.
If you’d like more information, please don’t hesitate to contact info@vtmarkets.com.
Written on September 28, 2023 at 7:25 am, by anakin
On Wednesday, the Dow Jones Industrial Average fell by 0.20% as increasing Treasury yields and surging oil prices weighed on investor sentiment, with the S&P 500 approaching a critical support level. The energy sector outperformed, while concerns about inflation and disappointing economic data continued to impact the market. The US dollar strengthened, driven by a contrast in economic data between the United States and the Eurozone, posing challenges for EUR/USD speculators. The USD/JPY pair approached a significant level, with implications for foreign exchange interventions, while sterling and the Australian dollar faced their own challenges. Upcoming economic data releases are expected to maintain market volatility.
Stock Market Updates
The Dow Jones Industrial Average experienced further losses, falling 0.20% on Wednesday, largely due to increased Treasury yields and rising oil prices, which negatively impacted investor sentiment. The Dow closed at 33,550.27, shedding 68.61 points, despite briefly surging by 112.77 points earlier in the session. On the other hand, the S&P 500 showed marginal gains of 0.02%, closing at 4,274.51, while the Nasdaq Composite ended the session 0.22% higher at 13,092.85. The increase in Treasury yields and a 3% spike in U.S. crude oil futures to $93.68 per barrel were key factors contributing to the market’s downward trajectory. The energy sector emerged as the best performer, rising by 2.5%, with notable companies like Marathon Oil and Devon Energy both posting gains of over 4%.
The recent market turbulence can be attributed to concerns regarding inflation, as rising rates and disappointing economic data have weighed on investor sentiment. The S&P 500 slipped below the crucial 4,300 level for the first time since June, and the Dow recorded its most significant one-day loss since March, closing below its 200-day moving average for the first time since May. September, known as a seasonally weak month for stocks, has seen the S&P 500 down by 5%, the Dow down by more than 3%, and the Nasdaq performing the worst, with a loss exceeding 6% for the month. Investors anticipate continued volatility in the coming weeks but remain hopeful for strong buying opportunities leading up to the year-end, particularly in October.
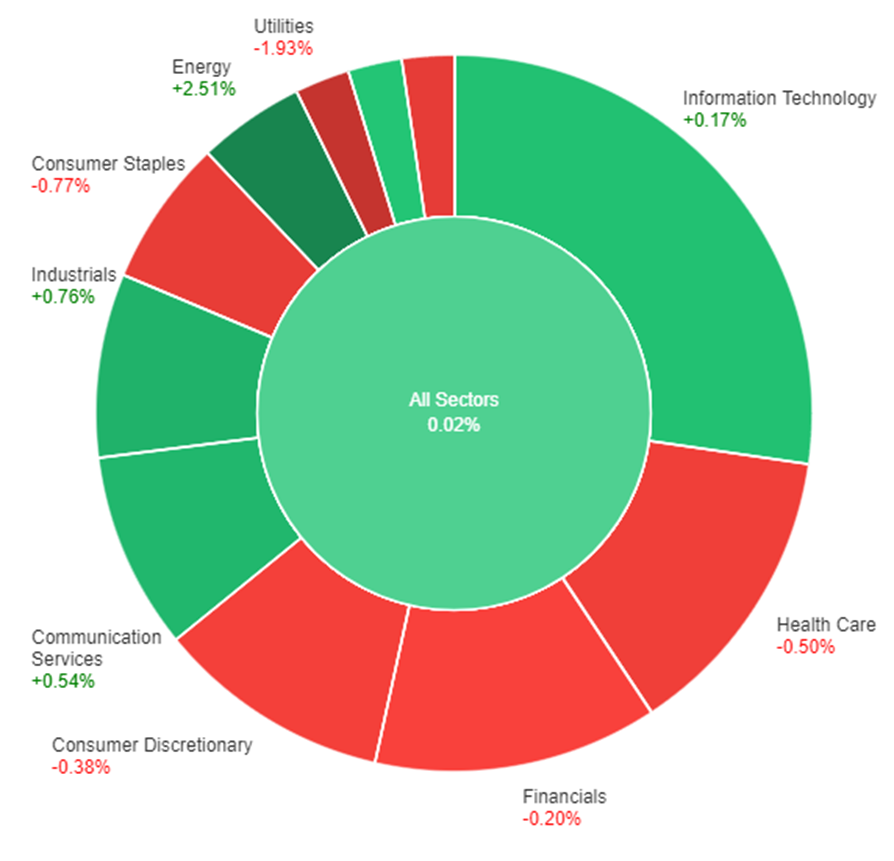
On Wednesday, across all sectors, the market saw a minimal increase of 0.02%. Energy performed exceptionally well with a substantial gain of 2.51%, while Industrials and Communication Services showed moderate increases of 0.76% and 0.54%, respectively. Information Technology also saw a slight gain of 0.17%. On the flip side, several sectors experienced declines, with Utilities being the most impacted, showing a significant decrease of 1.93%. Real Estate, Consumer Staples, and Health Care also had notable declines of 0.83%, 0.77%, and 0.50%, respectively. Financials and Consumer Discretionary had smaller losses of 0.20% and 0.38%, respectively.
Currency Market Updates
The US dollar showed significant strength in the currency market, with the dollar index surging by 0.55% on Wednesday. This increase was driven by the EUR/USD pair falling by 0.75% below the 1.0500 mark and approaching the 2023 low of 1.0482. The dollar’s gains were primarily attributed to a contrast between better-than-expected economic data from the United States and rising concerns of a recession in the Eurozone, compelling short positions on the dollar to seek cover. Notably, Eurozone money supply contracted at a historic rate in August, with loans to households and businesses falling well short of forecasts. Additionally, deteriorating German consumer sentiment raised doubts about a recovery this year. The USD’s recent gains, totaling approximately 7% against the euro since July, are likely to be concerning for speculators who entered long positions earlier in the year, as the EUR/USD pair hovers near its 2023 low.
In the meantime, the USD/JPY pair is approaching the significant level of 150, which many speculate the Japanese Ministry of Finance might defend, either through verbal interventions or actual foreign exchange interventions. Surpassing 150 could lead to a defense of the 32-year peak reached last year at 151.94 on EBS, potentially signaling an overdue correction. The trajectory of 10-year Treasury yields in the United States, which rose by 7 basis points to levels not seen since 2007, is crucial for USD/JPY. While US yields surge, 10-year Japanese Government Bond (JGB) yields remain at a much lower level of around 0.75%, setting the stage for further developments in this currency pair. This currency market update also revealed that sterling fell by 0.35% due to concerns about the Bank of England’s ability to combat inflation effectively, with the pound inching closer to the 2023 low of 1.1805 after an almost 8% decline from its July highs. Other notable movements in the market include the Australian dollar (AUD/USD) falling by 0.9% due to risk aversion related to issues in China and limited expectations of an interest rate hike by the Reserve Bank of Australia (RBA). The US dollar also made gains against the Norwegian krone (USD/NOK) by 0.56% in response to rising crude oil prices, particularly as Brent crude approached the $100 mark. The market anticipates more economic data releases on Thursday, including German Consumer Price Index (CPI), US jobless claims, Q2 GDP revisions, and pending home sales, with a heavier slate of releases scheduled for Friday.
Picks of the Day Analysis
EUR/USD (4 Hours)
EUR/USD Hits 2023 Lows, ECB’s Focus on Inflation, and USD Strength Dominates Markets
The EUR/USD has experienced a seven-day decline, plummeting to its lowest point since January, falling below 1.0500. The prevailing market sentiment is bearish, with no correction in sight, and the European Central Bank (ECB) closely watching upcoming inflation data from Spain and Germany. ECB members’ comments have had minimal impact, as the bank awaits crucial inflation figures this week. Spain expects a rebound in consumer inflation, while Germany anticipates a sharp decline in CPI. The US Dollar continues to strengthen, reaching new highs with the US Dollar Index nearing 107.00. Despite declining equities, US Treasury yields remain high, and economic data, including Durable Goods Orders and Jobless Claims, is closely monitored.
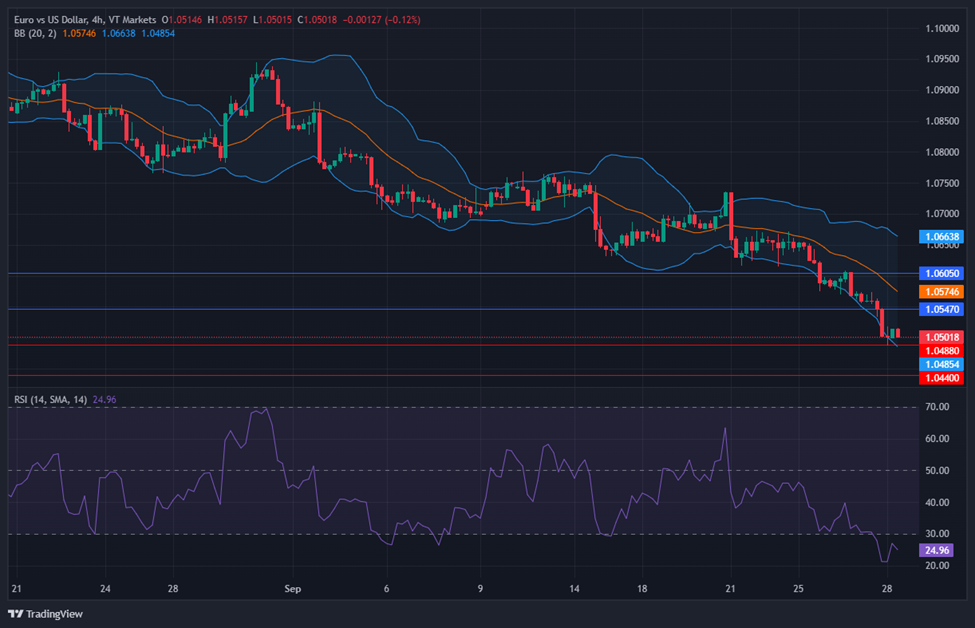
According to technical analysis, the EUR/USD moved lower on Wednesday and created downward pressure on the lower band of the Bollinger Bands. This movement suggests the possibility of further losses in EUR/USD. The Relative Strength Index (RSI) is currently at 24, indicating a bearish bias for the EUR/USD.
Resistance: 1.0547, 1.0605
Support: 1.0488, 1.0440
XAU/USD (4 Hours)
XAU/USD Slumps Below $1,880 as Dollar Surges Amidst U.S. Funding and Rate Hike Concerns
Spot Gold’s decline deepened as it slipped below the $1,880 threshold, driven by a strengthening U.S. Dollar in a risk-averse climate, while financial markets closely monitored developments in the United States, where a federal shutdown loomed due to political disagreements over funding. Simultaneously, global stock markets extended their bearish trends on concerns that central banks might prolong higher interest rates, elevating the risk of economic downturns. Government bond yields spiked, with the 10-year Treasury note hitting a 15-year high at 4.59%, and the 2-year note offering 5.11%, nearing levels not seen since the Federal Reserve’s monetary policy announcement.
According to technical analysis, XAU/USD moved lower on Wednesday, creating downward pressure on the lower band of the Bollinger Bands. Currently, the price is hovering just above the lower band, suggesting a potential further decline for XAU/USD. The Relative Strength Index (RSI) is currently at 15, signifying a bearish bias for the XAU/USD pair.
Resistance: $1,885, $1,902
Support: $1,866, $1,846
Economic Data
Currency
Data
Time (GMT + 8)
Forecast
EUR
German Prelim CPI m/m
All Day
0.3%
EUR
Spanish Flash CPI y/y
15:00
3.5%
USD
Final GDP q/q
20:30
2.2%
USD
Unemployment Claims
20:30
214K
USD
Fed Chair Powell Speaks
04:00 (29th)
Written on September 28, 2023 at 2:39 am, by anakin
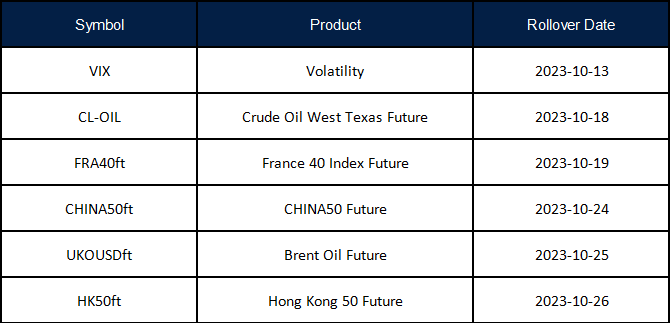
New contracts will automatically be rolled over as follows:
Please note:
• The rollover will be automatic, and any existing open positions will remain open.
• Positions that are open on the expiration date will be adjusted via a rollover charge or credit to reflect the price difference between the expiring and new contracts.
• To avoid CFD rollovers, clients can choose to close any open CFD positions prior to the expiration date.
• Please ensure that all take-profit and stop-loss settings are adjusted before the rollover occurs.
• All internal transfers for accounts under the same name will be prohibited during the first and last 30 minutes of the trading hours on the rollover dates.
If you’d like more information, please don’t hesitate to contact info@vtmarkets.com.
Written on September 28, 2023 at 2:21 am, by anakin
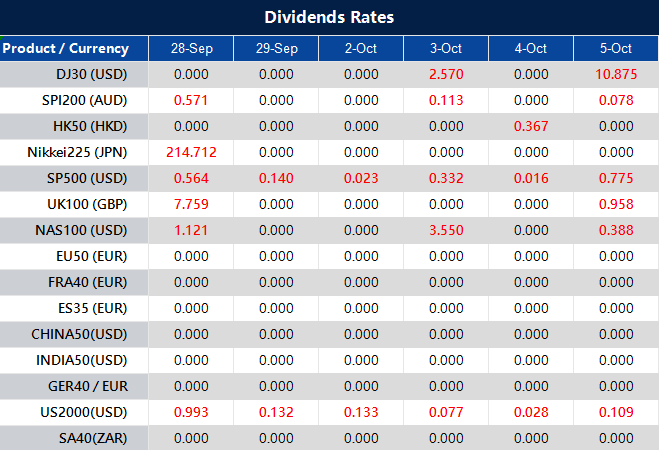
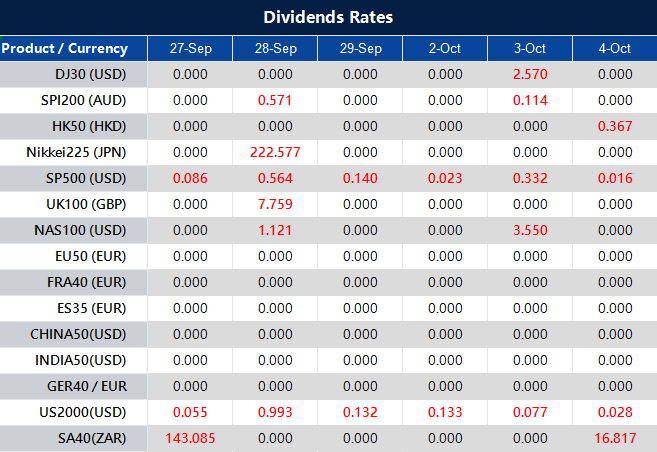
Please note that the dividends of the following products will be adjusted accordingly. Index dividends will be executed separately through a balance statement directly to your trading account, and the comment will be in the following format “Div & Product Name & Net Volume ”.
Please refer to the table below for more details:
The above data is for reference only, please refer to the MT4/MT5 software for specific data.
If you’d like more information, please don’t hesitate to contact info@vtmarkets.com.
Written on September 27, 2023 at 8:27 am, by anakin
On Tuesday, the stock market experienced a significant decline, with the Dow Jones Industrial Average falling by 388.00 points, marking its worst day since March. The S&P 500 and Nasdaq Composite also saw notable drops, and Amazon’s shares fell 4% due to an antitrust lawsuit. This decline is part of a broader trend in September, with the Nasdaq down nearly 7%, influenced by factors such as the Federal Reserve’s indication of fewer rate cuts and ongoing uncertainty. In the currency market, the US dollar surged, reaching a ten-month high, driven by a retreat in other currencies and hawkish comments from Fed officials. The article also highlights the impact on currencies like the British pound and the Japanese yen.
Stock Market Updates
The stock market experienced a significant decline as the Dow Jones Industrial Average fell by 388.00 points, or 1.14%, to close at 33,618.88. This marked the worst day for the Dow since March, and the index closed below its 200-day moving average for the first time since May. The S&P 500 also saw a 1.47% decrease, closing below 4,300 for the first time since June 9, while the Nasdaq Composite dropped by 1.57% to 13,063.61. Amazon’s shares took a hit, falling 4%, following an antitrust lawsuit filed by the Federal Trade Commission, alleging that the online retailer keeps prices artificially high and harms its competitors. Additionally, disappointing data emerged, as August new home sales missed expectations and the Conference Board’s consumer confidence index fell, contributing to the overall bearish sentiment in the market.
The stock market’s losses for the month are accumulating, with the Nasdaq Composite down nearly 7% in September, and the S&P 500 and Dow both experiencing declines of more than 5% and 3%, respectively. This downward trend has been influenced by factors such as the Federal Reserve’s indication of fewer rate cuts in the coming year, leading to a rise in bond yields not seen since 2007. Investors remain cautious, given the uncertainty about the economy, the Fed’s actions, and the value of the dollar. Meanwhile, lawmakers in Washington are negotiating to prevent a government shutdown that could occur as early as October 1 if a spending bill agreement is not reached. Despite these challenges, October, historically known as a “jinx month” for market crashes, is also considered a potential “bear killer,” according to the “Stock Trader’s Almanac,” providing opportunities for investors in the midst of seasonal market volatility.
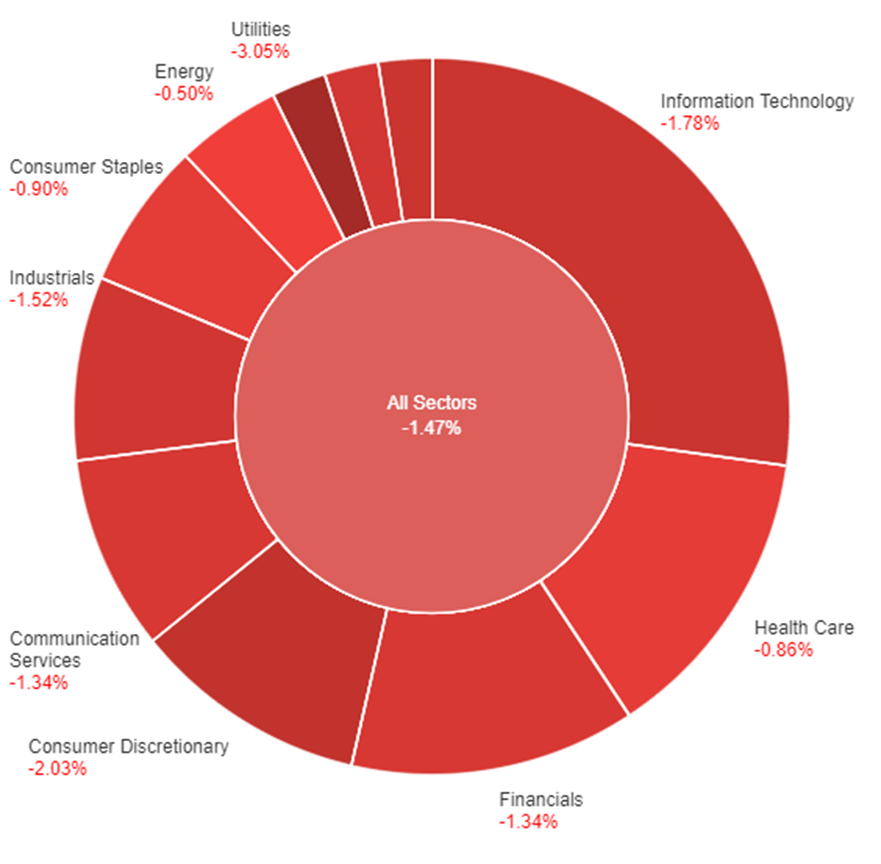
On Tuesday, across all sectors, the market experienced a decline of 1.47%. Notably, Utilities were hit the hardest with a significant decrease of 3.05%, while Consumer Discretionary also saw a substantial drop of 2.03%. The Information Technology and Real Estate sectors both had losses of 1.78%, and most other sectors saw negative trends ranging from -0.50% in Energy to -1.52% in Industrials. Financials and Communication Services also suffered losses of -1.34%, while Health Care and Consumer Staples had slightly smaller declines of -0.86% and -0.90% respectively. Materials fell by 1.45% on this day.
Currency Market Updates
In recent currency market developments, the US dollar experienced a notable surge, with the dollar index rising by 0.24%, marking its highest point in nearly ten months. This uptrend was driven by a retreat in currencies like sterling, the Australian dollar, and the euro, while USD/JPY held steady, partly due to the threat of intervention by the Ministry of Finance and a preference for the safe-haven yen amidst risk-off sentiments. Notably, there was an initial pullback in Treasury yields, but this decline was reversed, leading to a fresh six-month low for the EUR/USD pair during the New York session. Despite weaker-than-expected US consumer sentiment and new home sales, the rebound in US yields persisted, largely driven by hawkish comments from officials like Minneapolis Federal Reserve Bank President Neel Kashkari and Chicago Fed President Austan Goolsbee. Additionally, concerns about Italy’s fiscal plans led to an increase in 10-year BTP-bund yield spreads, further impacting the euro’s performance.
Furthermore, the British pound weakened by 0.43% in response to the recent hawkish stance of the Federal Reserve, combined with indications from the Bank of England that rate hikes might be on hold, despite inflation levels remaining significantly above the 2% target. In terms of technical levels, Cable (GBP/USD) approached critical Fibonacci support levels. On the other hand, USD/JPY witnessed fluctuations and achieved new 2023 highs, only to be influenced by daily Japanese government warnings about potential FX intervention to counter excessive yen weakness. The 150 level is seen as a potential line in the sand for the Ministry of Finance, although traders appear inclined to continue buying dips unless disappointing US data leads to a halt in the rise of Treasury yields over Japanese Government Bond (JGB) yields. Amidst these dynamics, the US dollar exhibited strength against most high-beta currencies, and the USD/CNY pair experienced a marginal decline. Looking ahead, the US data calendar remains relatively light until Friday when personal income, spending, and core PCE data are expected, provided there is no government shutdown, with other releases including the Chicago PMI and Michigan sentiment for September, as well as eurozone CPI data.
Picks of the Day Analysis
EUR/USD (4 Hours)
EUR/USD Decline Continues Amid Strengthening US Dollar and Risk Aversion
The EUR/USD pair faced continued declines and struggled to maintain levels above 1.0600, primarily driven by the robust performance of the US Dollar in various markets. The US Dollar index achieved its highest daily close in months, surpassing 106.10, supported by elevated US yields. Despite weaker-than-expected US economic data, the dollar remained resilient. Wall Street experienced a decline in equity prices, further bolstering the Dollar’s surge. Upcoming reports on German and Spanish inflation data, as well as the Core Personal Consumption Expenditure Index from the US, are eagerly anticipated by market participants as potential market movers.
According to technical analysis, the EUR/USD moved lower on Tuesday and created downward pressure on the lower band of the Bollinger Bands. This movement suggests the possibility of further losses in EUR/USD. The Relative Strength Index (RSI) is currently at 32, indicating a bearish bias for the EUR/USD.
Resistance: 1.0588, 1.0620
Support: 1.0541, 1.0517
XAU/USD (4 Hours)
XAU/USD Dive as US Dollar Soars Amidst Growing Economic Concerns
In a sharp decline, spot gold (XAU/USD) fell to $1,900.83, marking its lowest point in nearly two weeks. This slide was driven by a surge in the US Dollar, triggered by mounting apprehension in the financial markets due to central banks’ commitment to keeping rates higher for longer and disappointing economic data from the United States. The US CB Consumer Confidence Index extended its decline, indicating potential recession signs, while New Home Sales saw a substantial drop. Federal Reserve Bank President Neel Kashkari’s remarks added to the uncertainty, with investors worried about prolonged monetary tightening. This confluence of factors kept gold at the lower end of its monthly range, while Wall Street experienced a sell-off and 10-year Treasury note yields reached levels not seen since 2007.
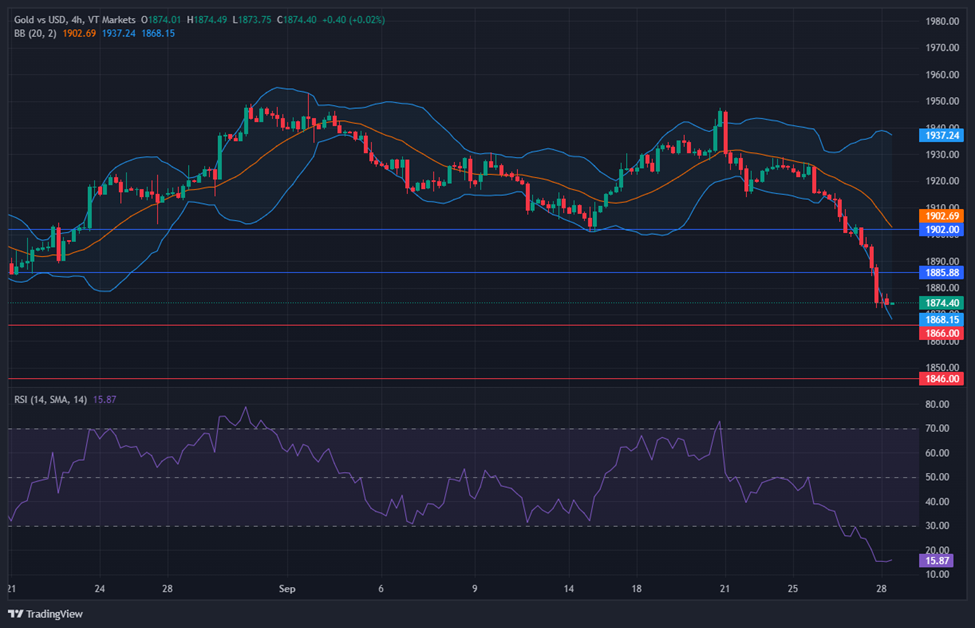
According to technical analysis, XAU/USD moved lower on Tuesday, creating downward pressure on the lower band of the Bollinger Bands. Currently, the price is hovering just above the lower band, suggesting a potential further decline for XAU/USD. The Relative Strength Index (RSI) is currently at 27, signifying a bearish bias for the XAU/USD pair.
Resistance: $1,908, $1,915
Support: $1,893, $1,885
Economic Data
Currency
Data
Time (GMT + 8)
Forecast
AUD
CPI y/y
09:30
5.2% (Actual)
Written on September 27, 2023 at 3:50 am, by anakin
Welcome to the world of Forex trading, a dynamic marketplace where currencies are bought and sold. This market offers incredible potential for profit, but it’s crucial to understand and manage the risks that come with it.
A knight in the armour source: The Writing Train
Read more about the nature of risks and emotional discipline techniques in our previous article. In this guide, we’ll explore practical risk management strategies to help non-professional traders like you navigate the Forex market and make informed trading decisions.
Stop Loss and Take Profit Orders
In the fascinating world of Forex trading, mastering risk management isn’t just a good practice—it’s a game-changer. Let’s talk about two powerful allies in this domain: stop loss and take profit orders.
These tools are like your trading buddies, keeping you safe from sudden market changes and helping you stay on track. For anyone starting out in Forex and wanting to succeed, knowing how to use these tools is really important.
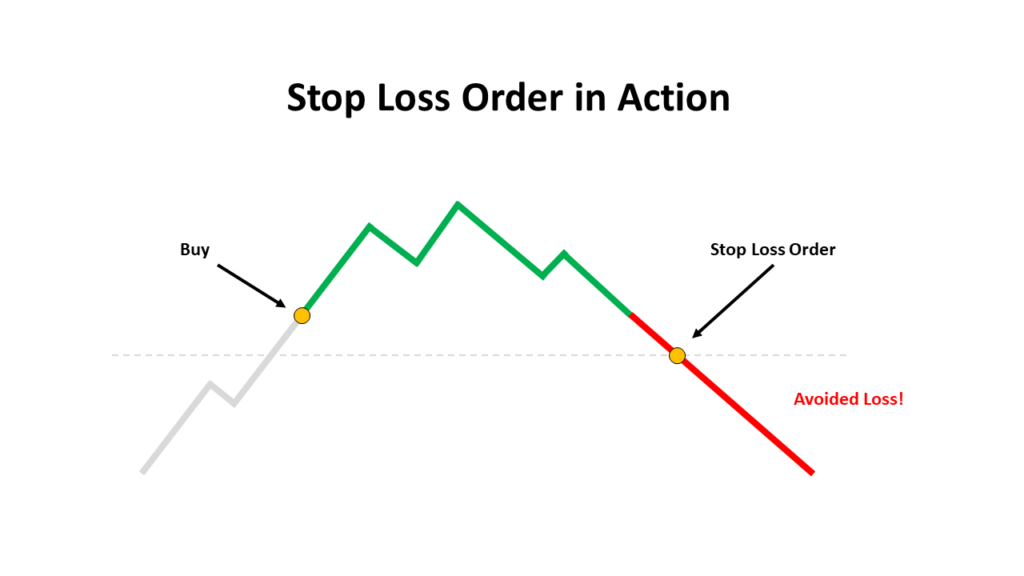
Stop Loss Orders
A stop loss order is a protective tool used in Forex trading to minimise potential losses by automatically closing a trade when the market moves against your position. It serves as a buffer against unexpected market shifts, providing traders with a predefined exit strategy to limit their downside.
Let’s say you enter a trade to buy EUR/USD at 1.2000. You set a stop loss order at 1.1950. If the market price drops and reaches 1.1950, your trade will automatically close, limiting your loss to 50 pips.
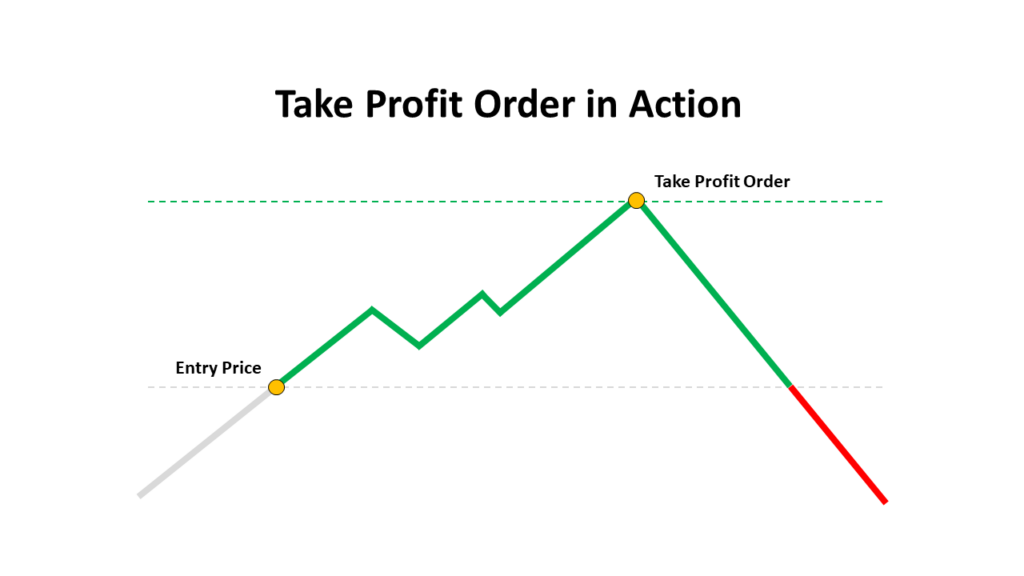
Take Profit Orders
A take profit order is a predefined price level at which you choose to close a portion or the entire trade to secure profits. This structured approach enables you to lock in gains, maintaining discipline in your trading strategy by closing the trade at a predetermined profit level and ensuring you secure profits before the market potentially reverses.
Continuing with the EUR/USD trade, if you set a take profit order at 1.2050, and the market price reaches this level, your trade will automatically close, securing a profit of 50 pips.
Setting Realistic Levels
When setting stop loss and take profit levels, consider a comprehensive analysis of the market, historical price data, and your risk appetite. It’s akin to planning your bike ride route based on your fitness level and preferences. Assess the market conditions, recent trends, and your trading goals to determine optimal levels.
Risk-Reward Ratio
The risk-reward ratio is a fundamental metric used in trading to measure the potential profit in relation to the potential loss for a specific trade.
Maintaining an advantageous risk-reward ratio is paramount, ensuring that the potential reward significantly outweighs the potential risk. This balance is key to bolstering the overall profitability of your trades.
The risk-reward ratio is calculated by dividing the potential profit by the potential loss for a trade:
Risk-Reward Ratio = Potential Profit / Potential Loss
Let’s say you are willing to risk $100 on a trade in the hopes of making a potential profit of $300. In this scenario, your risk-reward ratio would be 1:3. This implies that for every $1 you risk, your potential reward is $3.
A favorable risk-reward ratio helps you assess whether a trade is worth pursuing. For instance, a ratio of 1:3 indicates that you are aiming for a reward three times greater than your risk. This can guide your trade decisions and contribute to a more successful trading strategy over time.
Diversification
Diversification, in the context of Forex trading, means spreading your investments across various currency pairs or assets. This approach is aimed at reducing risk and promoting a more balanced investment portfolio.
Diversification offers a twofold advantage. Firstly, it helps to mitigate the impact of a downturn in a single currency pair. Secondly, it ensures your portfolio is not overly reliant on one particular asset, providing stability in varying market conditions.
source: Real Simple
Picture diversification like building a well-rounded meal. Just as you’d include a mix of proteins, vegetables, and grains for a balanced diet, diversifying your investment portfolio involves including different currency pairs to create a balanced financial “meal.” This strategic approach aims to minimise the overall risk and maximise potential returns.
By spreading your trades across different currency pairs, you avoid overconcentration in a single pair. Think of it as not putting all your eggs in one basket. This way, if one currency pair experiences an adverse movement, it won’t drastically impact your entire portfolio, allowing for more consistent and sustainable trading outcomes.
Using Economic Calendars
Economic calendars are valuable tools that offer crucial information about upcoming economic events and indicators that could impact the financial markets.
Leveraging the data from economic calendars allows traders to make informed decisions and adjust their trading strategy in anticipation of significant market movements driven by economic events.
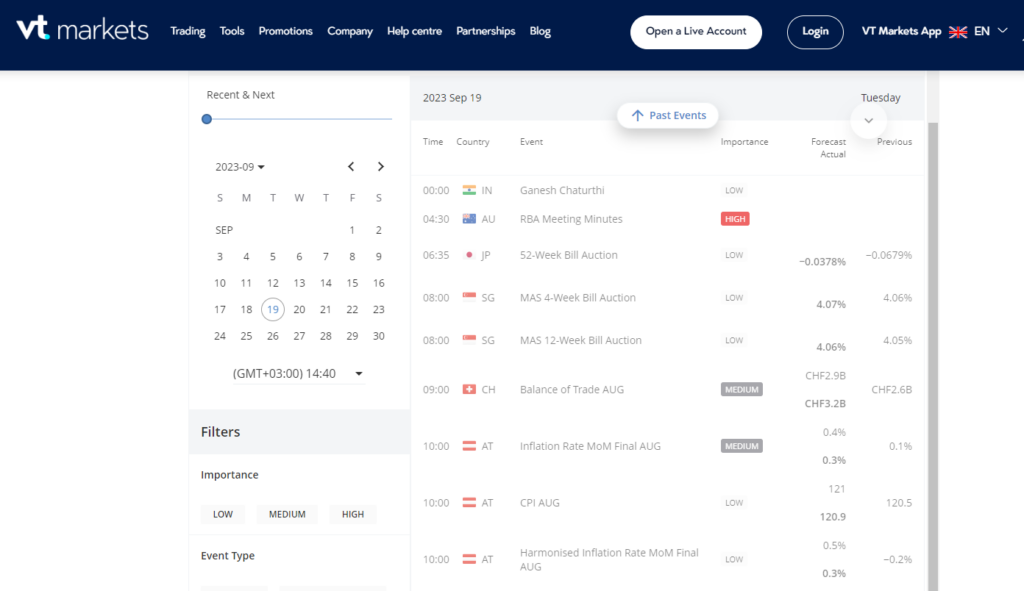
Imagine you’re planning a cross-country road trip. Before you hit the road, you’d naturally check the traffic conditions, right? Similarly, in trading, economic calendars like the one provided by VT Markets serve as your traffic report for the Forex market.
Economic Calendar by VT Markets
They provide advanced knowledge about economic events, helping you navigate the market more effectively. By considering the economic calendar data, you can make informed decisions about when to enter or exit trades, thereby reducing the risk of being caught off-guard by unexpected market volatility.
Demo Trading
A demo trading account is a simulated trading environment that allows you to practice trading using virtual funds. The primary purpose of a demo account is to familiarise yourself with the mechanics of the market and the trading platform without risking your actual capital.
Demo trading offers a multitude of benefits. Firstly, it provides a risk-free environment for refining your risk management skills. Secondly, it allows you to experiment with different trading strategies, helping you identify what works best for you. Lastly, it can boost your confidence as you witness your virtual trades succeeding, offering a valuable learning experience.
A demo account with VT Markets offers traders a completely risk-free opportunity to hone their skills and test strategies before engaging in live trading. With virtual funds at your disposal, you can gain valuable hands-on experience in a secure environment. To open your demo account with VT Markets and embark on your risk-free trading journey, simply tap on this link: Open demo Account with VT Markets.
Risk Management Tools
Risk management tools, including position sizing calculators, play a crucial role in the trading world. These tools aid in determining appropriate position sizes for your trades based on various factors like risk tolerance, account balance, and trade specifics.
Making the most of these tools involves using them strategically to align your position sizes with your risk tolerance and trading objectives. It’s about finding the right balance that allows for potential profits while mitigating potential losses.
A position size calculator helps traders decide the appropriate trade size considering factors like risk tolerance, account balance, and stop-loss levels. By inputting these parameters, it ensures trades align with their risk strategy, facilitating informed and responsible trading decisions.
In conclusion, mastering risk management in Forex trading is a journey that requires discipline, knowledge, and continuous learning. By understanding and implementing the strategies outlined in this guide, you’ll be better equipped to navigate the Forex market while preserving and growing your investment. Always remember, successful trading is not about avoiding risks entirely, but managing them wisely to achieve your financial goals. Happy trading!
Written on September 26, 2023 at 8:37 am, by anakin