This week, the market’s focus will primarily revolve around the Bank of Japan’s rate decision. Investors are eagerly anticipating any statements from the bank’s governor Kazuo Ueda, especially after observing the impact of the strong Japanese Yen arising from a weakening US Dollar. In addition to this, consumer price index (CPI) and gross domestic product (GDP) data for various regions will also be released, possibly further affecting the market.
As always, traders are advised to exercise caution as we approach these significant market highlights for the week:
Bank of Japan’s interest rate decision (19 December 2023)
Following its October meeting, the Bank of Japan (BOJ) maintained its key short-term interest rate at -0.1% and held 10-year bond yields steady at approximately 0%.
No changes are expected in the BOJ’s upcoming rate statement, scheduled for release on 19 December.
Canada CPI (19 December 2023)
Canada’s CPI rose by 0.1% month-over-month in October 2023, rebounding from a 0.1% decline in September.
Analysts expect a decrease of 0.2% in the CPI figures for November, scheduled for release on 19 December.
UK annual CPI (20 December 2023)
The UK’s annual CPI data reflected a decline in the UK’s inflation rate, from 6.7% in August and September 2023 to 4.6% in October 2023.
Analysts expect the UK’s annual CPI to drop further to 4.3% in the next set of updated figures, scheduled for release on 20 December.
US final GDP (21 December 2023)
The US economy saw an annualised expansion of 5.2% in Q3 2023, surpassing a preliminary estimate of 4.9% and marking the strongest growth since Q4 2021.
Analysts expect a 5.2% expansion in the US economy to be confirmed following the release of updated GDP data on 21 December.
UK retail sales (22 December 2023)
Retail sales in the UK declined by 0.3% month-over-month in October 2023 following a revised 1.1% decrease in September.
Analysts expect a 0.5% increase in the next set of UK retail sales figures, scheduled for release on 22 December.
Canada GDP (22 December 2023)
The Canadian economy grew by 0.1% in September 2023, primarily propelled by a 0.3% increase in goods-producing industries. This also marked its first upturn in six months.
Analysts expect a 0.2% increase in the next set of GDP data for Canada, slated for release on 22 December.
US core PCE price index (22 December 2023)
Core personal consumption expenditure (PCE) prices for the US increased by 0.2% in October 2023, marking a slight easing from the 0.3% rise observed in September.
Analysts expect a 0.2% increase in the core PCE price index for the US following the release of updated data on 22 December.
Written on December 18, 2023 at 2:50 am, by anakin
The Forex market’s landscape is constantly evolving, with various countries emerging as key players based on the number of active traders.
In 2023, according to data provided by Forex Broker Report, there’s been a significant global distribution of Forex traders. This spread is largely influenced by the intricate dynamics of advanced financial systems and regulatory frameworks.
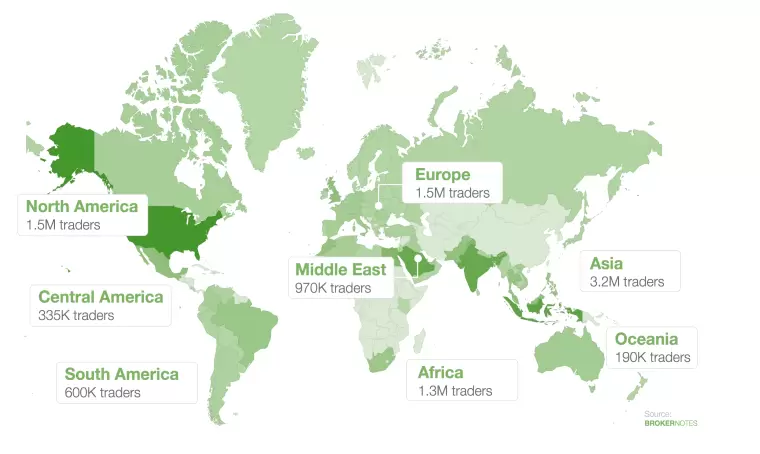
The regional distribution of online Forex traders Source: Broker Notes
The global distribution of online Forex traders, as highlighted in the ForexBrokers.com report, shows a notable regional variance: Asia leads with 3.2 million online traders, Europe follows with 1.5 million, and Africa with 1.3 million, while the United States also shows a substantial presence in the Forex market. These figures underscore the widespread popularity and varied levels of Forex trading engagement across different regions.
As we delve into the top 10 countries at the forefront of Forex trading, each presents a unique combination of attributes and challenges within their Forex markets.
1. United Kingdom (341,000 Traders)
The UK, especially London, is not just Europe’s but one of the world’s foremost financial hubs. The Financial Conduct Authority (FCA) provides robust regulation, ensuring transparency and trader protection. London’s time zone advantageously positions it to capitalise on both Asian and American market hours, enhancing its Forex trading activity.
2. United States (335,000 Traders)
The U.S. boasts a highly developed financial market with extensive Forex trading activity. The regulatory environment, overseen by organisations like the CFTC and NFA, ensures a secure trading platform for a diverse array of traders. The U.S. dollar’s dominance in global finance further amplifies the country’s role in the Forex market.
3. Japan (223,000 Traders)
Japan’s Forex market has witnessed exponential growth since retail Forex trading was legalised in 1998. The Japanese yen, a major currency in Forex markets, is often involved in carry trades due to Japan’s low-interest-rate environment. The Financial Services Agency (FSA) maintains a well-regulated trading environment, balancing openness with trader protection.
4. Singapore (218,000 Traders)
As a critical financial centre in Asia, Singapore’s strategic location enables significant trading overlap with global markets. The Monetary Authority of Singapore (MAS) is known for its stringent regulatory standards, fostering a secure and efficient trading environment. Singapore’s advanced technological infrastructure also contributes to its robust Forex market.
5. Hong Kong (200,000 Traders)
Hong Kong stands as a significant gateway to Asian markets, with a stable economy and a strong regulatory framework. The Hong Kong dollar is a crucial currency in Forex markets, and the region’s proximity to mainland China adds to its strategic trading position. Hong Kong’s sophisticated financial services sector attracts traders globally.
6. Australia (195,000 Traders)
Australia’s Forex market is underpinned by its resource-driven economy and political stability. Regulated by the Australian Securities and Investments Commission (ASIC), the market offers a safe environment for traders. The Australian dollar, a commodity currency, is highly influenced by the country’s trade dynamics, particularly with China.
7. Switzerland (182,000 Traders)
Switzerland’s reputation for financial stability and banking secrecy makes its Forex market attractive. The Swiss Franc, a safe-haven currency, is a popular choice during global economic uncertainties. Switzerland’s Forex market benefits from its neutrality and the country’s stringent regulatory practices.
8. France (120,000 Traders)
France’s Forex market is integral to the Eurozone. The Euro’s strength and stability, combined with France’s significant economic position in Europe, make it a key player in Forex trading. The Autorité des Marchés Financiers (AMF) ensures a well-regulated trading environment.
9. Germany (109,000 Traders)
Germany’s robust economy and the Euro’s prominence bolster its Forex market. Germany’s Forex trading is influenced by its strong industrial and export sectors. The Federal Financial Supervisory Authority (BaFin) provides a stringent regulatory framework, ensuring market integrity.
10. China (105,000 Traders)
China’s growing Forex market reflects its rising economic power. The Chinese Yuan’s increasing inclusion in global Forex trading symbolises China’s expanding financial influence. However, the market is more regulated and less open than in other major countries, with strict oversight from the People’s Bank of China and SAFE.
In conclusion, the Forex trading landscape in 2023 highlights the diversity and dynamism of global financial markets. Each of the top 10 countries offers unique advantages and challenges, shaped by their respective economic conditions, regulatory frameworks, and currency strengths. These nations not only provide significant opportunities for Forex traders but also play a crucial role in shaping the future of international finance and trade.
Written on December 15, 2023 at 8:32 am, by anakin
Gold, a precious metal, continues to capture the attention of traders seeking diversification and potential profits. If you’re interested in gold trading, it’s important to understand the basics and explore the trading opportunities available.
In this article, we’ll explore the fundamentals of gold trading for beginners.
Different Ways to Trade Precious Metals
When it comes to trading metals like gold, there are multiple avenues to explore. Each method has its own unique characteristics and appeals to different types of traders. Let’s find out what they are:
1. Spot Market
The spot market is the simplest way to trade metals. It involves immediate delivery of purchased assets and is ideal for commodity consumers who need goods for immediate use.
The spot price, which is the current market price of gold, serves as a reference point for spot market transactions.
2.Futures and Options
These options are popular derivatives used by speculators to trade gold without physically owning the metal. Futures contracts involve buying or selling a predetermined amount of gold at a specified price and date in the future.
Meanwhile, options contracts grant the right, but not the obligation, to buy or sell gold within a specific timeframe.
Both futures and options prices are influenced by the spot price of gold, providing traders with opportunities to profit from price movements without taking physical delivery of the metal.
Trading Gold as Forex Pairs
Gold can also be traded as a forex pair, such as XAU/USD (gold against the US dollar). Forex trading allows traders to speculate on the price movement of gold relative to a base currency.
For example, when trading XAU/USD, buying indicates purchasing gold by selling US dollars, while selling implies buying US dollars in exchange for gold.
Forex trading of gold offers flexibility and convenience, as it allows traders to participate in the market using margin and take advantage of leverage.
Factors Driving Gold Prices
To make informed trading decisions, it’s crucial to understand the factors that influence gold prices. Here are some key drivers to consider:
1. Demand
Gold demand comes from various sources, including its use in jewelry. Additionally, gold is often seen as a safe-haven asset during economic downturns.
Investors turn to gold to preserve wealth and hedge against market volatility.
2.Real Interest Rates
Gold prices have historically shown a correlation with real interest rates, which are the current interest rates adjusted for inflation.
When real interest rates are low or negative, alternative investment options offer limited returns, leading investors to consider gold as a way to protect their wealth.
Conversely, when real interest rates are high, the appeal of holding gold diminishes as cash and bonds become more attractive.
3. Gold Trading Correlation with the US Dollar
The relationship between gold and the US dollar is of interest to traders. While gold is priced in US dollars, the correlation between the two assets is not always straightforward.
Although they often exhibit an inverse correlation, periods of financial stress and market uncertainty can cause both gold and the US dollar to rise simultaneously. In such times, investors see both assets as havens of stability.
4.Supply Dynamics of Gold
Understanding the supply dynamics of gold is crucial for assessing its long-term value. Gold is a finite resource, and estimates suggest that all mineable gold may be depleted by 2070.
However, gold is highly durable, and virtually all the gold ever mined is still in circulation. This characteristic ensures that the available amount of gold continues to increase until supplies are fully exhausted.
Concluding Insights on Gold Trading
Gold trading offers opportunities for investors seeking portfolio diversification and potential profits.
By understanding different trading methods, the factors driving gold prices, and the supply dynamics of this precious metal, traders can make informed decisions.
A solid foundation in education is paramount for anyone venturing into gold trading. Understanding market trends, economic indicators, and technical analysis can significantly enhance your trading strategy and outcomes. VT Markets is committed to empowering traders with a wealth of educational resources tailored to gold trading.
From live webinars and in-depth tutorials to comprehensive guides and market analysis, we provide the tools and knowledge necessary to navigate the gold market successfully. Whether you’re a novice aiming to understand the basics or an experienced trader looking to refine your strategy, our learn forex page is designed to support your growth and help you trade gold with confidence.
VT Markets provides a comprehensive trading platform that empowers traders with the necessary tools and resources to navigate the world of gold trading with confidence. Discover more about gold trading with VT Markets today.
Written on December 15, 2023 at 8:28 am, by anakin
In the fast-paced world of Forex trading, where fortunes can be made or lost in the blink of an eye, the importance of selecting the right trading approach cannot be overstated.
Today, over 70% of traders rely on algorithmic trading methods, as revealed by the research report “Predictive Assessment of Electronic Trade Dynamics: 2022-2027“. This staggering statistic underscores the prevalence and influence of algorithmic trading in the contemporary financial landscape.
Understanding the nuances of both manual and algorithmic trading is crucial for non-professional traders to navigate these complexities successfully. Let’s delve into these approaches, exploring their intricacies and uncovering the key considerations that can shape the success of Forex trading.
Manual Trading: The Art of Hands-On Decision-Making
Involving a traditional, hands-on approach where traders rely on intuition and market analysis, manual trading provides a unique learning experience and enables the exercise of emotional control.
This method offers a practical learning environment, allowing traders to engage directly with the market. For instance, envision a trader meticulously analysing historical price charts, identifying key support and resistance levels, and anticipating a trend reversal based on a combination of technical indicators and economic factors.
Actively participating in decision-making processes, manual trading helps traders develop emotional control – a crucial aspect of success. Consider a scenario where a trader, faced with a sudden market downturn, resists the impulse to panic sell and instead relies on their analysis to make rational decisions, avoiding potentially significant losses.
However, manual trading has its challenges. The time-intensive nature demands constant attention, making it challenging for traders with busy schedules. Emotional challenges remain prevalent, and the limited capacity for multitasking can hinder a trader’s ability to seize multiple opportunities simultaneously.
To illustrate, imagine a manual trader who, after studying market conditions, identifies a potential breakout in a currency pair. This trader monitors the charts, patiently waiting for the opportune moment to enter the market. When the anticipated reversal occurs, the trader executes a well-timed trade, capitalising on insights gained through hands-on analysis.
In essence, manual trading offers a personalised and engaging experience for traders willing to invest time and effort into understanding the intricacies of the Forex market. While it requires discipline and focused attention, the skills acquired through manual trading can be invaluable for those seeking a deep connection with their trading strategies.
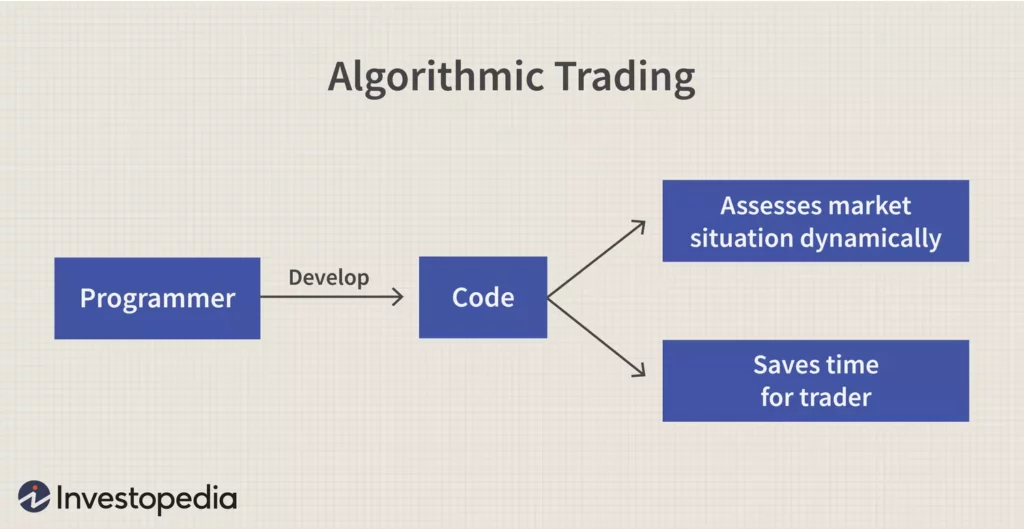
Algorithmic Trading: The Precision of Automated Decision-Making
In stark contrast to manual methods, algorithmic trading relies on automated execution and data-driven decisions, emphasising speed, efficiency, and systematic strategy application.
Algorithmic trading excels in speed and efficiency, processing vast market data in milliseconds. An example is an algorithm identifying and capitalising on price discrepancies across markets, executing trades instantaneously.
Algorithmic trading model source: Investopedia
Crucial to algorithmic trading, backtesting validates strategies using historical data, minimising the risk of flawed analysis. Imagine a trader developing an algorithm identifying profitable trends through historical price movements, ensuring viability before live application.
Despite its advantages, algorithmic trading has complexities. A steep learning curve demands proficiency in programming and data analysis. Over-reliance on historical data poses risks, as strategies may lose effectiveness in rapidly changing markets.
Consider a trader developing a sophisticated algorithm with machine learning techniques, allowing anticipation of price movements accurately and consistently yielding profits by adapting to evolving market conditions.
Algorithmic trading comes with risks, including system failures and technical challenges. Traders must be vigilant to address potential issues promptly, as glitches or failures could lead to unintended consequences.
In essence, algorithmic trading offers an efficient, systematic approach to Forex trading. Despite technical demands and potential risks, a well-designed algorithm has the potential to unlock consistent profits in the ever-evolving financial landscape.
Factors to Consider: Choosing Between Manual and Algorithmic Trading
When faced with the decision between manual and algorithmic trading, a careful evaluation of several key factors can significantly impact your trading journey.
Factor 1.Risk Tolerance:
Manual Trading: Ideal for those comfortable with risk, offering flexibility and adaptability.
Algorithmic Trading: Suited for risk-averse individuals, providing a disciplined and controlled approach.
Factor 2.Time Commitment:
Manual Trading: Demands constant attention and time investment.
Algorithmic Trading: Offers automation, saving time for exploring opportunities and strategy refinement.
Factor 3.Skill Level:
Manual Trading: Requires a deep understanding of market dynamics and analysis.
Algorithmic Trading: Involves programming and data analysis skills.
In summary, align your trading approach with your risk tolerance, time commitments, and skill set to make an informed decision between manual and algorithmic trading.
For example, a computer science-savvy trader might excel in algorithmic trading, leveraging programming skills. Meanwhile, a trader attuned to market psychology may find success in manual trading.
Each method has unique benefits, ensuring a strategic fit for your preferences and enhancing your success in Forex trading.
Combining Manual and Algorithmic Trading: The Power of Hybrid Strategies
As technology and trading methodologies evolve, the concept of hybrid trading has emerged as a compelling strategy for traders seeking the best of both worlds. By combining manual and algorithmic approaches, traders can capitalise on the strengths of each method, creating a versatile and adaptive trading strategy.
source: Freepik
Intuitive Decision-Making with Efficiency
Hybrid trading combines manual intuition with algorithmic efficiency. Traders leverage the strengths of both approaches – making informed decisions based on market understanding while benefiting from the speed and precision of automated execution.
Risk Management at the Core
Central to hybrid trading is robust risk management. Traders can swiftly adapt to changing market conditions by switching between manual and algorithmic modes. This dynamic approach enhances risk mitigation, allowing traders to navigate diverse market scenarios with agility.
A trader, combining economic insight with sentiment analysis algorithms, may switch between manual and algorithmic modes based on market events. This adaptability ensures critical decision-making during unexpected situations.
Continuous Adaptation and Learning
Hybrid traders embrace continuous adaptation and learning. The synergy between manual and algorithmic methods enables real-time strategy refinement, crucial in the ever-changing Forex market.
Optimising Strengths, Minimising Weaknesses
By combining manual and algorithmic trading, traders aim to optimise strengths while mitigating weaknesses. Manual trading adapts to unique market conditions, while algorithmic trading provides efficiency in executing predefined strategies.
VT Markets welcomes traders of all styles, whether engaging in manual or algorithmic trading.
For manual traders, the user-friendly interfaces of MT4, MT5, and WebTrader Plus ensure a seamless and intuitive experience across Forex, indices, commodities, and other assets. Execute trades with precision and efficiency, empowered by real-time data and analytical tools.
Alternatively, for those who prefer automated strategies, leverage the platform’s compatibility with expert advisors. Implement finely-tuned algorithmic approaches tailored to the nuances of your preferred instrument and aligned with unique trading objectives.
In conclusion, both manual and algorithmic trading have their merits and drawbacks. Forex traders should explore both approaches, considering factors such as risk tolerance, time commitment, and skill level. Embracing a hybrid strategy and leveraging the tools and opportunities provided by platforms like VT Markets can empower traders to navigate the Forex market successfully. Continuous learning and adaptation are key in this ever-evolving financial landscape.
Summary:
Manual trading and algorithmic trading are two primary approaches to engaging in financial markets.
Manual trading involves hands-on decision-making but faces challenges like time intensity.
Algorithmic trading relies on automated execution but has a steep learning curve.
Hybrid trading, blending manual intuition with algorithmic efficiency, is gaining popularity.
Consider your risk tolerance, time commitments, and skill set when choosing between manual and algorithmic trading in Forex.
Written on December 15, 2023 at 7:56 am, by anakin
The stock market soared to record highs as the Dow Jones Industrial Average closed at 37,248.35 points, marking a 0.43% increase, spurred by a drop in the 10-year Treasury note yield. This surge resonated in the S&P 500 and Nasdaq, both climbing upwards. Investor confidence in a potential soft economic landing for 2024 grew, with speculation about forthcoming rate cuts, especially after the Federal Open Market Committee hinted at possible reductions. Specific sectors, including solar stocks and Moderna, experienced substantial gains. Additionally, sectors like Energy and Real Estate thrived, while Utilities and Consumer Staples saw declines. In the currency market, the dollar index dropped significantly as the Bank of England and the European Central Bank diverged from the Federal Reserve’s dovish stance, influencing currency pairs like EUR/USD and Sterling, while USD/JPY faced downward pressure amidst expectations surrounding major central banks’ policies.
Stock Market Updates
The stock market experienced a positive surge as the Dow Jones Industrial Average hit a record high, closing up by 0.43% at 37,248.35 points, following its previous milestone above 37,000. This increase was mirrored by the S&P 500, which rose by 0.26% to 4,719.55, and the Nasdaq Composite, which gained 0.19% to 14,761.56. These upticks were propelled by the 10-year Treasury note yield dropping below 4%, leading to increased investor confidence in a potential soft economic landing for 2024. This drop in interest rates spurred speculation about potential rate cuts for the upcoming year, with the Federal Open Market Committee indicating the possibility of three rate reductions.
Additionally, specific sectors saw notable movements. Solar stocks, including SunRun and Enphase, surged as the 10-year Treasury yield fell, with the Invesco Solar ETF (TAN) climbing over 8.1%. Moderna’s shares also rose by 9.3% after trial data revealed promising results for its cancer vaccine used in conjunction with Merck’s Keytruda. Looking ahead, the S&P 500 inches closer to its all-time closing record set in January 2022, sitting just 1.6% away, while the Nasdaq remains approximately 8% below its closing record and 9% from its intraday peak.
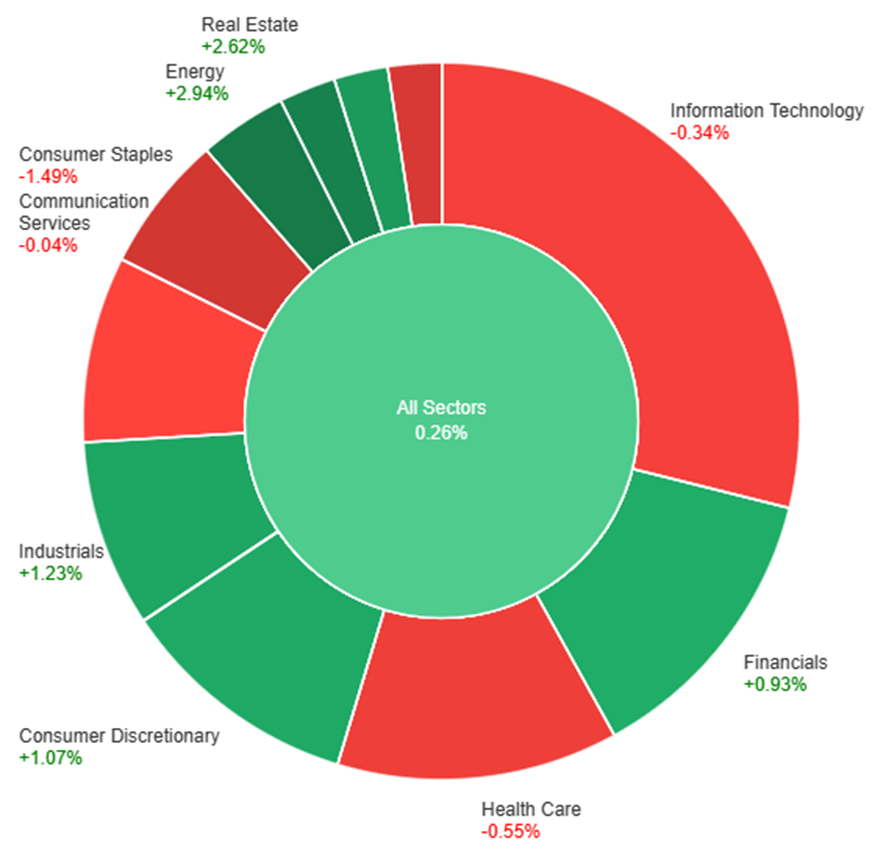
On Thursday, the overall market showed a positive trend, with a gain of 0.26%. The standout performers were Energy and Real Estate, surging by 2.94% and 2.62%, respectively. Materials and Industrials also experienced notable gains, rising by 1.68% and 1.23%. However, sectors like Utilities and Consumer Staples saw declines, with decreases of 1.28% and 1.49%, respectively. Communication Services remained relatively stable, showing a marginal decrease of 0.04%. Notably, Information Technology and Health Care experienced declines of 0.34% and 0.55%, respectively, contributing to the overall mixed performance across sectors.
Currency Market Updates
In the currency market updates, the dollar index faced a significant decline by 1% after the Bank of England (BoE) and the European Central Bank (ECB) chose not to mirror the Federal Reserve’s dovish stance. This highlighted a trend where the U.S. central bank consistently leads major policy shifts during the pandemic. Despite a brief rebound in the dollar following positive U.S. retail sales and jobless claims, this momentum was overshadowed by the divergence between the Fed’s dovishness and the BoE and ECB’s reluctance to consider easing.
The BoE maintained elevated rates due to UK core inflation at 5.7%, substantially higher than the central bank’s target, while the ECB’s 4% rate remained notably lower compared to the BoE and Fed. Market futures now anticipate the Fed’s first rate cut in March, accumulating to 150 basis points by 2024. On the other hand, the ECB is slightly predicted to cut rates by March, aiming for nearly 150 basis points by year-end. The BoE is expected to cut rates by May, albeit by 106 basis points for 2024. Amidst this, currency pairs like EUR/USD surged by 1%, nearing November’s trend high, while Sterling rose by 1.36%, driven by the BoE’s resistance to rate cut expectations and benefited from risk-on flows.
USD/JPY experienced a decline from November’s peak, reaching 140.95 after the Fed’s pivot and ahead of crucial announcements from the BoE, ECB, and U.S. retail sales. Despite a retracement to 140.71, USD/JPY faced downward pressure, partly attributed to the expectation that the Bank of Japan (BoJ) stands alone among major central banks in considering a hike next year.
The EUR/USD pair experienced a surge, hitting 1.1009 before a minor pullback, driven by contrasting central bank actions. The US Dollar faced pressure post-Fed, while the Euro gained ground following the ECB’s decision to maintain rates and continue PEPP reinvestments through H1 2024, with plans to reduce the portfolio by €7.5 billion monthly in H2. Despite expectations of a gradual inflation decline till 2024 and concerns over price pressures, ECB President Christine Lagarde clarified no discussions on rate cuts occurred. Additionally, the Dollar’s slide was compounded by a drop in Treasury yields. While positive US data on Retail Sales and Jobless Claims surpassed expectations, the focus remains on Friday’s release of S&P Global’s preliminary December PMIs for the EU and the US.
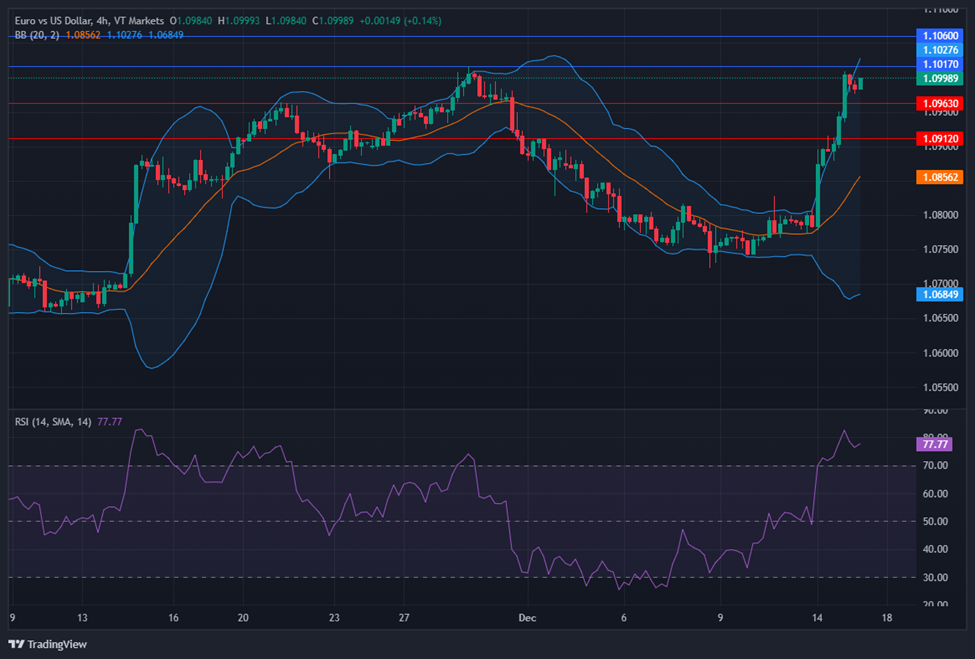
On Thursday, the EUR/USD moved higher and was able to reach the upper band of the Bollinger Bands. Currently, the price moving slightly below the upper band, suggesting a potential continuation movement, potentially reaching the resistance level at 1.1017. Notably, the Relative Strength Index (RSI) maintains its position at 77, signaling a bullish outlook for this currency pair.
Resistance: 1.1017, 1.1060
Support: 1.0963, 1.0912
XAU/USD (4 Hours)
XAU/USD Hold Steady Amidst Dollar Respite and Central Bank Divergence
Gold (XAU/USD) navigates a week of fluctuations, poised for a weekly gain after a retreat from record highs. The Asian market’s influence is marked by the US Dollar’s pause in its decline, propelled by a slight rebound in US Treasury bond yields. Amidst this, the US Dollar finds stability as Asian stocks trim early gains, awaiting pivotal preliminary PMI data from the US and Eurozone, crucial for gauging global economic health. The backdrop is a US Federal Reserve embracing a dovish stance, contrasting with the Bank of England and European Central Bank hinting at potential tightening, revealing a pronounced monetary policy divergence that weighs heavily on the dollar. Despite temporary Dollar recoveries due to unexpected US Retail Sales upticks, the dovish Fed outlook continues to fuel a global risk-on sentiment, supporting Gold prices near recent highs. As the week concludes, the focus remains on the PMI data’s impact and potential profit-taking amid a volatile week dominated by central bank actions.
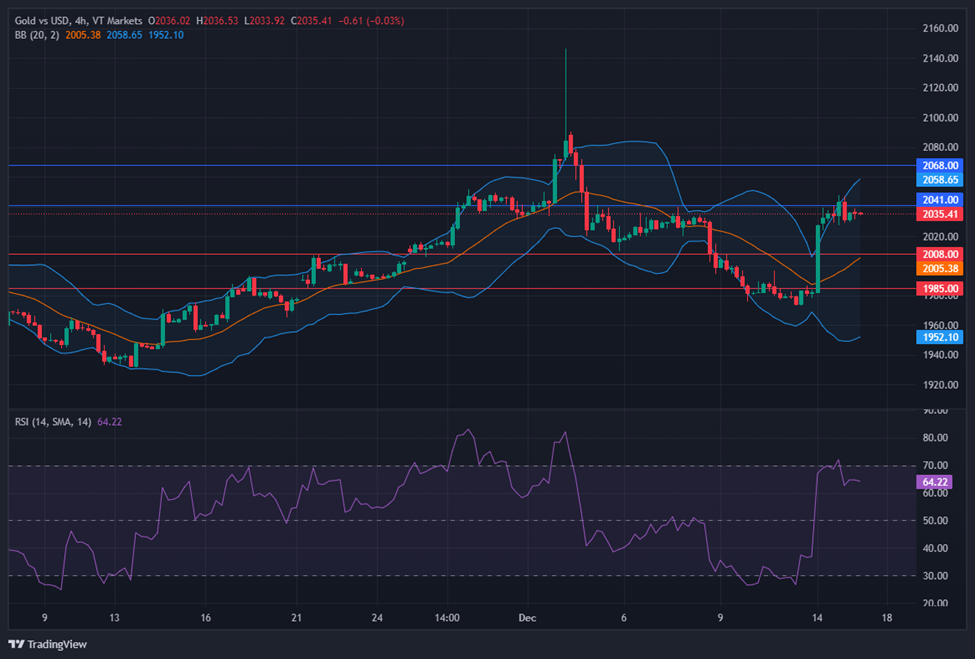
On Thursday, XAU/USD moved in consolidation around the upper band of the Bollinger Bands. Currently, the price moving below the upper band, suggesting a potential continuation movement, potentially reaching the resistance level at $2,041. The Relative Strength Index (RSI) stands at 64, signaling a bullish outlook for this pair.
Resistance: $2,041, $2,068
Support: $2,008, $1,985
Economic Data
Currency
Data
Time (GMT + 8)
Forecast
EUR
French Flash Manufacturing PMI
16:15
43.3
EUR
French Flash Services PMI
16:15
46.1
EUR
German Flash Manufacturing PMI
16:30
43.1
EUR
German Flash Services PMI
16:30
49.9
GBP
Flash Manufacturing PMI
17:30
47.6
GBP
Flash Services PMI
17:30
51.0
USD
Empire State Manufacturing Index
21:30
2.0
USD
Flash Manufacturing PMI
22:45
49.5
USD
Flash Services PMI
22:45
50.7
Written on December 15, 2023 at 4:06 am, by anakin
The stock market surged to historic heights as the Dow Jones Industrial Average closed above 37,000 for the first time, fueled by the Federal Reserve’s indication of upcoming rate cuts amidst eased inflation projections. This move drove notable gains across indices and sectors, with banking stocks like Bank of America and Wells Fargo rising significantly, alongside Home Depot, while pushing year-to-date gains for the Dow, S&P 500, and Nasdaq Composite. Simultaneously, the currency market witnessed substantial shifts, marked by the dollar index’s plunge and various currency pairs reacting to the Fed’s revised outlook, while attention turned to potential impacts on retail sales in the evolving landscape.
Stock Market Updates
The stock market soared to new heights, with the Dow Jones Industrial Average reaching a record-breaking close above 37,000 for the first time, spurred by the Federal Reserve’s indication of multiple rate cuts in the coming year. This move comes in response to the Fed’s acknowledgment of eased inflation and a revised forecast for a lower inflation rate of 2.4% in 2024, down from the previously projected 2.6%. Investors welcomed this shift in monetary policy, driving the Dow up by 512.30 points (1.40%), the S&P 500 by 1.37%, and the Nasdaq Composite by 1.38%, all hitting fresh 52-week highs. The market’s positive response was further reinforced by promising inflation data and a decrease in the 10-year Treasury yield to 4.03%, its lowest since August.
The Fed’s decision to signal forthcoming rate cuts boosted specific sectors: banking stocks like Bank of America and Wells Fargo, poised to benefit from a softer monetary policy, surged by 4% and nearly 3%, respectively. Additionally, Home Depot experienced a 3% gain, potentially due to expectations of increased sales driven by a potential housing market revival. This shift in market sentiment, aligning with investors’ desires for a more accommodating Fed stance, has significantly contributed to the Dow’s remarkable 11.9% year-to-date rise, while the S&P 500 and Nasdaq Composite have seen even more substantial gains of 22.6% and 40.8%, respectively, in 2023.
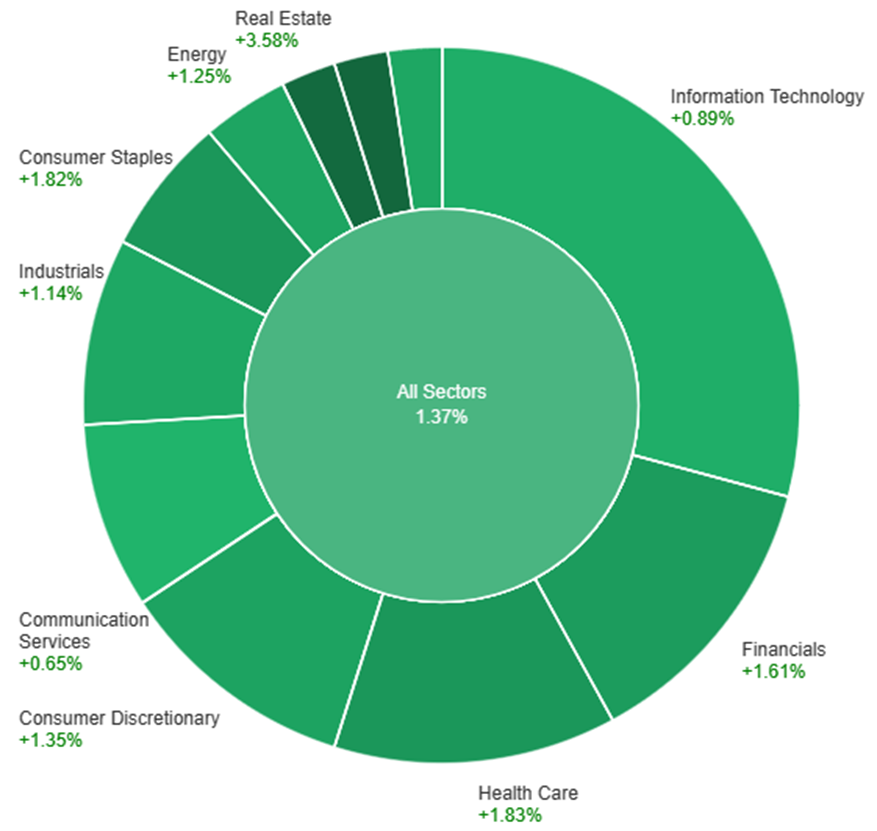
On Wednesday, across all sectors, the market saw a positive trend with a gain of 1.37%. Notably, the Utilities and Real Estate sectors experienced robust growth, rising by 3.72% and 3.58% respectively, outperforming other sectors. Health Care and Consumer Staples also showed healthy gains of 1.83% and 1.82% respectively. Financials, Consumer Discretionary, Energy, Materials, and Industrials followed suit with increases ranging from 1.14% to 1.61%. However, Information Technology and Communication Services had comparatively modest gains, recording 0.89% and 0.65% respectively, contributing to the overall positive market movement.
Currency Market Updates
The currency market witnessed significant shifts following the Federal Reserve’s announcements, causing a plunge in the dollar index by 0.7% during New York afternoon trade. Projections of three rate cuts in 2024, coupled with economic assessments, prompted a drop in two-year Treasury yields and futures pricing, with a notable rise in the probability of a March rate cut to 69%. The Fed’s deviation from previous dot plots, altering the trajectory from expected hikes in 2023 to anticipated cuts in 2024, marked a substantial change in market expectations. Notably, the EUR/USD pair surged by 0.85% following the Fed’s news, hitting a seven-day high, partly attributed to the European Central Bank’s projected rate cuts and the Eurozone’s economic performance lagging behind the US. Meanwhile, sterling experienced a shift from a loss to a gain, with expectations concerning the Bank of England’s stance on rate cuts diverging from the market’s projections.
Additionally, USD/JPY experienced a significant decline of 1.6% post-Fed, contrasting with its 0.2% dip ahead of the announcement. This movement aligned with lower Treasury-JGB yields following the Fed’s update, despite Japan’s positive Tankan survey and the Bank of Japan’s potential divergence as the sole major central bank possibly considering rate hikes next year. The dynamics in the currency market were influenced by oil price movements, with Brent finding support preceding June lows, driven by unexpected drops in WTI inventories and the amplified prospects of easing by major central banks, including the Fed. Looking ahead, the market’s focus shifted toward U.S. retail sales, anticipated to show soft figures, further contributing to the evolving currency landscape.
Picks of the Day Analysis
EUR/USD (4 Hours)
EUR/USD Rallies Amid Fed’s Stance, Eyes on ECB Decision
The EUR/USD pair surged more than 100 pips post the Federal Reserve meeting, breaching the 1.0900 mark on a firmly bullish trajectory driven by the US Dollar’s dip. The Fed’s decision to maintain interest rates and the projection of future rate cuts in 2024 propelled US bond rallies, pushing the 10-year yield to 4% lows and the US Dollar Index down by nearly 1%. Ahead of the European Central Bank’s anticipated decision, expectations loom around unchanged rates, discussions on PEPP reinvestment, and updated projections, foreseeing potential downgrades in growth and inflation forecasts. Market sentiment appears dovish, factoring in a possible rate cut in April, pressuring the Euro. Attention shifts to the ECB’s stance for insights into future market repositioning, with the US Dollar’s decline potentially propelling a rally toward 1.1000, tempered by the ECB decision or Eurozone PMI reports.
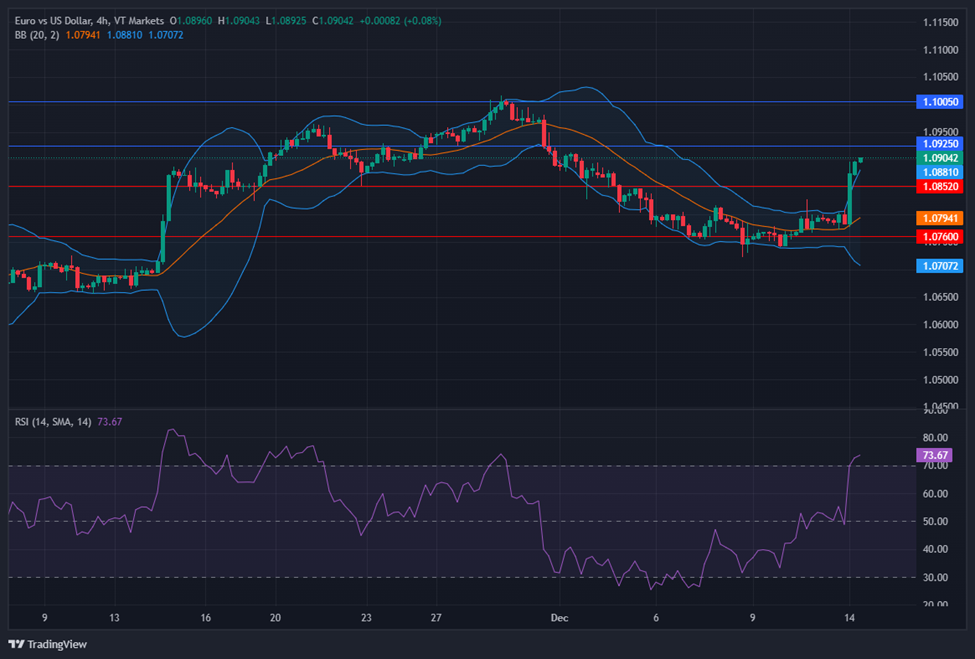
On Wednesday, the EUR/USD moved higher and was able to reach the upper band of the Bollinger Bands. Currently, the price moving slightly above the upper band, suggesting a potential continuation movement, potentially reaching the resistance level at 1.0925. Notably, the Relative Strength Index (RSI) maintains its position at 73, signaling a bullish outlook for this currency pair.
Resistance: 1.0925, 1.1005
Support: 1.0852, 1.0760
XAU/USD (4 Hours)
XAU/USD Surges Above $2,000 as Fed’s Dovish Tone Weakens Dollar and Treasury Yields
Gold (XAU/USD) soared past the $2,000 mark amidst the early Asian session, buoyed by a weaker US Dollar and declining Treasury yields following the Federal Reserve’s meeting. The Fed maintained interest rates unchanged, adopting a dovish stance on monetary policy. Fed Chair Jerome Powell hinted at potential rate cuts, contributing to the Dollar Index’s sharp decline and boosting gold prices. Despite market expectations aligning with the Fed’s decision, the possibility of rate cuts in 2024 exceeded forecasts, intensifying interest in gold. With upcoming US economic reports and Chinese data on the horizon, gold traders anticipate further cues from jobless claims, retail sales figures, and international economic indicators.
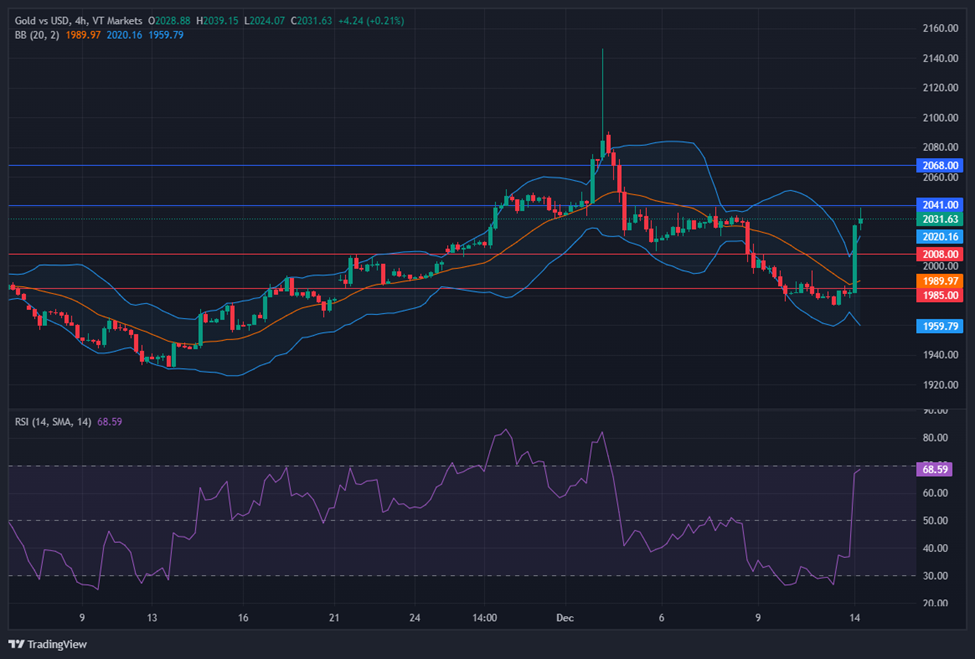
On Wednesday, XAU/USD moved higher and was able to reach the upper band of the Bollinger Bands. Currently, the price moving slightly above the upper band, suggesting a potential continuation movement, potentially reaching the resistance level at $2,041. The Relative Strength Index (RSI) stands at 68, signaling a bullish outlook for this pair.
Resistance: $2,041, $2,068
Support: $2,008, $1,985
Economic Data
Currency
Data
Time (GMT + 8)
Forecast
CHF
SNB Monetary Policy Assessment
16:30
CHF
SNB Policy Rate
16:30
1.75%
CHF
SNB Press Conference
17:00
GBP
Monetary Policy Summary
20:00
GBP
MPC Official Bank Rate Votes
20:00
2-0-7
GBP
Official Bank Rate
20:00
5.25%
EUR
Main Refinancing Rate
21:15
4.50%
EUR
Monetary Policy Statement
21:15
USD
Core Retail Sales m/m
21:30
-0.1%
USD
Retail Sales m/m
21:30
-0.1%
USD
Unemployment Claims
21:30
219K
EUR
ECB Press Conference
21:45
Written on December 14, 2023 at 3:03 am, by anakin
Discover the tips and tricks of trading charts in our webinar, ‘Mastering Chart Techniques: The Pro’s Handbook.’ Learn expert advice and practical strategies to navigate markets with confidence. Whether you’re new to trading or want to boost your skills, this session is your roadmap to becoming a chart analysis pro.
Written on December 13, 2023 at 7:21 am, by anakin
Despite the S&P 500, Dow Jones, and Nasdaq reaching new peaks amidst the consumer price index (CPI) rising as anticipated, the market remains divided in response. Analysts note both bullish and bearish sentiments, with investors bracing for potential strategic investment opportunities. Oracle’s 12% decline and Macy’s 8% drop affect sector dynamics, while currency markets respond subtly to the CPI data, keeping the dollar index down. The Fed’s impending policy announcement and cues from Jerome Powell’s commentary are anticipated, influencing future rate adjustment speculations. Meanwhile, diverse currency pairs show varied movements, indicating nuanced market shifts, while attention turns to forthcoming events like US retail sales and central bank meetings impacting currency markets’ cautious stance.
Stock Market Updates
The stock market saw a continued climb as the S&P 500, Dow Jones Industrial Average, and Nasdaq Composite all rose, hitting new 52-week highs. This growth occurred despite the consumer price index (CPI) rising 3.1% year over year in November, matching economist predictions. However, the month-over-month CPI increase aligned with expectations, maintaining a steady inflation trajectory. Analysts noted that while both bullish and bearish sentiments exist about the CPI figures, the market largely responded in a manner consistent with expectations, with many investors anticipating a potential dip for strategic investments.
Investors are eagerly awaiting the Federal Reserve’s upcoming policy announcement, anticipated to maintain steady interest rates. However, the market is keenly attentive to cues from Chair Jerome Powell’s commentary, seeking indications about potential future rate adjustments. Amidst this market climate, Oracle shares dropped by over 12% due to lower-than-expected fiscal second-quarter revenue, while Macy’s declined by 8% following a downgrade to sell from Citi, impacting the market’s sectoral dynamics.
On Tuesday, most sectors experienced gains, with the overall market rising by 0.46%. The Information Technology sector led the gains with an increase of 0.83%, followed by Financials at 0.71% and Materials at 0.57%. Health Care and Industrials also saw positive movement, each rising by 0.47% and 0.46%, respectively. However, sectors like Energy, Utilities, and Real Estate faced declines, with Energy notably dropping by 1.35%. Utilities and Real Estate experienced smaller decreases of 0.41% and 0.05%, respectively, marking a mixed day across various sectors.
Currency Market Updates
The recent currency market updates reveal a nuanced response to the US CPI data, maintaining the dollar index down by 0.22%. Core inflation figures persisting at 4% year-on-year hindered a dovish Fed pivot signal, despite real weekly earnings experiencing a significant 0.5% surge in the month. This upturn in earnings, especially in super core services minus shelter costs, influenced Powell’s outlook, contributing to a marginal rise in Treasury yields and the dollar post-CPI.
EUR/USD witnessed a 0.24% uptick, benefiting from a weaker dollar, declining energy prices, optimistic indicators in Germany’s ZEW expectations index, and tightened bund treasury yield spreads. However, the currency pair is seeking support above specific moving averages to solidify its sizable speculative long position. Meanwhile, USD/JPY experienced a 0.4% drop from recent lows, navigating towards equilibrium after a notable November-December plunge, a portion of it attributed to an exaggerated Fed rate cut and unrealistic BoJ rate hike expectations. The overall trend remains in favor of shorts unless key resistance at 147.76 is breached, considering the historical context of a double-top formation from 2022/23 and the anticipated reversal of the Fed rate hike cycle.
The sterling remained relatively stagnant amid concerns over decelerating UK wage growth and domestic political uncertainty. Looking ahead, market attention shifts to upcoming events such as US retail sales and the ECB and BoE meetings, viewed as preludes to anticipated rate adjustments by March and June, respectively, maintaining a cautious stance in the currency markets.
The EUR/USD made a modest ascent, yet failed to sustain levels above 1.0800, lingering below the 200-day SMA. The US Dollar’s mixed sentiment post-US inflation figures and in anticipation of the Federal Reserve’s upcoming decision fuel cautious movements. Despite the CPI aligning with expectations and the USD initially weakening, the currency regained ground. Eyes are on the Fed’s probable unchanged rates and Chair Jerome Powell’s tone. The market eyes the dot plot for 2024 projections, influencing interest rate expectations. With the ECB decision looming and expectations of a non-event, EUR/USD struggles persist amid over 50% odds of a rate cut by March, impeding potential rebounds.
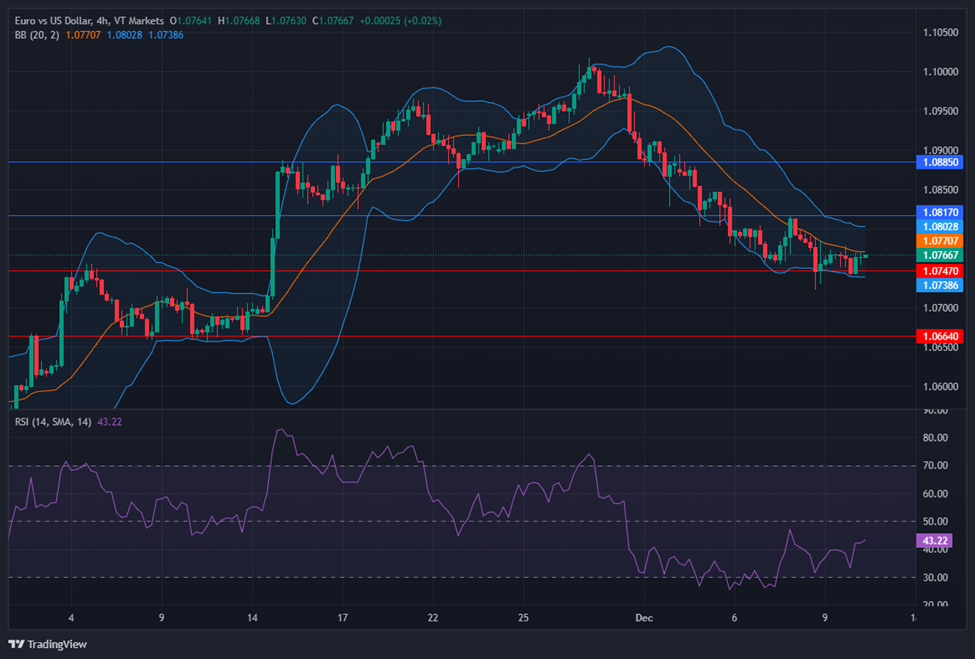
On Tuesday, the EUR/USD moved slightly higher and able to reach near the upper band of the Bollinger Bands. Currently, the price moving slightly below the upper band, suggesting a potential lower movement, potentially reaching the middle band. Notably, the Relative Strength Index (RSI) maintains its position at 50, signaling a neutral outlook for this currency pair.
Resistance: 1.0817, 1.0885
Support: 1.0747, 1.0664
XAU/USD (4 Hours)
XAU/USD Stable Amidst Inflation Data and Fed Anticipation
Gold prices, reflected in XAU/USD, held steady at around $1,980.00, showing marginal movement despite the US Dollar’s early softness due to Asian equity gains. Investor caution prevailed ahead of the US Consumer Price Index (CPI) release, which reported in line with expectations – a monthly increase of 0.1% and an annual rate of 3.1%, slightly down from the previous 3.2%. Although the initial response saw XAU/USD touch $1,996.68 post-news, the Greenback recovered swiftly, leading to speculation on the Federal Reserve’s upcoming monetary policy announcement. As investors anticipate the Fed’s stance on rate adjustments, the steady inflation figures have partially tempered expectations of immediate rate cuts, contributing to short-term concerns and favoring the USD.
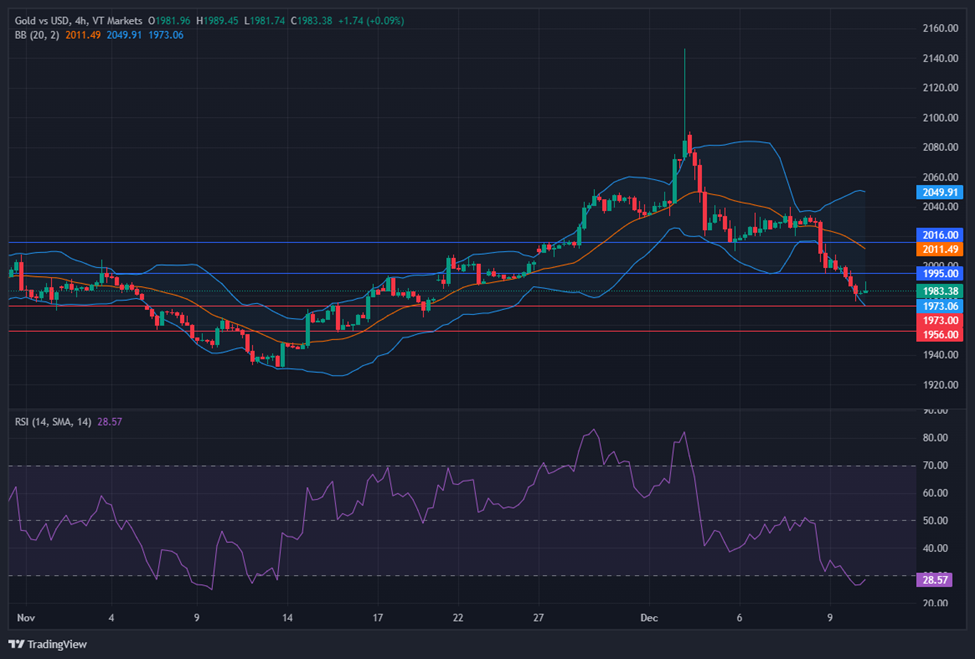
On Tuesday, XAU/USD moved slightly lower. Currently, the price is moving between the lower and middle bands of the Bollinger Bands which creates a possibility that XAU/USD might move lower and try to reach our support levels. The Relative Strength Index (RSI) stands at 28, indicating bearish sentiment as it’s in the oversold area.
Resistance: $1,995, $2,016
Support: $1,973, $1,956
Economic Data
Currency
Data
Time (GMT + 8)
Forecast
GBP
GDP m/m
15:00
-0.1%
USD
Core PPI m/m
21:30
0.2%
USD
PPI m/m
21:30
0.0%
USD
Federal Funds Rate
03:00 (14th)
5.50%
USD
FOMC Statement
03:00 (14th)
USD
FOMC Press Conference
03:30 (14th)
NZD
GDP q/q
05:45 (14th)
0.2%
Written on December 13, 2023 at 3:00 am, by anakin
Please note that the dividends of the following products will be adjusted accordingly. Index dividends will be executed separately through a balance statement directly to your trading account, and the comment will be in the following format “Div & Product Name & Net Volume ”.
Please refer to the table below for more details:
The above data is for reference only, please refer to the MT4/MT5 software for specific data.
If you’d like more information, please don’t hesitate to contact info@vtmarkets.com.
Written on December 12, 2023 at 7:55 am, by anakin
Stock futures showed minimal movement as Wall Street tracked the market’s resilience against impending inflation data. Modest increases in Dow Jones futures contrasted slight declines in S&P 500 and Nasdaq 100 futures, indicating a sustained end-of-year rally with indices securing multi-week gains. Investor sentiment faces a test with the upcoming release of the consumer price index (CPI) and the Federal Reserve’s final meeting, compounded by Oracle’s post-trading decrease. Additionally, recent dollar index growth, speculation on central bank actions, and stable currency pair movements contribute to the market’s delicate balance, with inflation and corporate earnings poised to challenge bullish sentiment.
Stock Market Updates
Stock futures exhibited minimal movement on Monday evening as Wall Street monitored the potential for the ongoing market surge to withstand upcoming inflation data. Futures linked to the Dow Jones Industrial Average marginally increased by 2 points, while S&P 500 and Nasdaq 100 futures experienced slight declines, each less than 0.1%. Despite these fractional changes, Monday’s modest stock market rise suggested that the end-of-year rally persisted, marking the S&P 500’s highest closure since March 2022 and the Dow’s strongest settlement since January 2022. Notably, all three major indices—the Dow, S&P 500, and Nasdaq Composite—maintained three-day winning streaks and had secured six consecutive weeks of gains.
However, investor sentiment faces a pivotal test on Tuesday as the release of November’s consumer price index (CPI) before the market opens and the commencement of the Federal Reserve’s final meeting of the year could sway market direction. Additionally, the market might react to tech giant Oracle’s after-hours trading decline of 7%, prompted by its fiscal second-quarter revenue missing Wall Street’s expectations. These developments indicate a delicate balance for the market, with inflation data and corporate earnings posing potential challenges to the prevailing bullish sentiment.
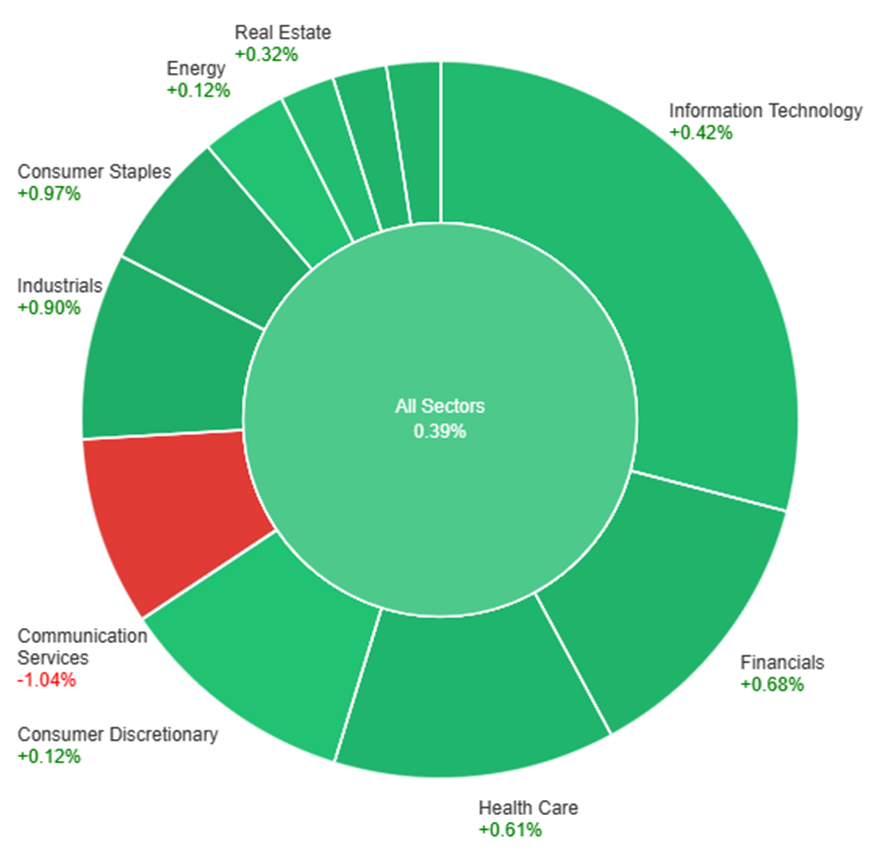
On Monday, the market saw an overall positive trend with all sectors showing gains except for Communication Services, which experienced a decline of 1.04%. Consumer Staples led the gains with a notable increase of 0.97%, followed closely by Industrials at 0.90%, Materials at 0.71%, and Financials at 0.68%. Sectors like Utilities, Health Care, and Information Technology also contributed to the uptrend, albeit to a slightly lesser extent, with gains ranging from 0.42% to 0.66%. However, the Real Estate and Consumer Discretionary sectors showed more modest increases at 0.32% and 0.12%, respectively. Energy mirrored Consumer Discretionary with a similar 0.12% gain.
Currency Market Updates
In recent market movements, the dollar index experienced a 0.13% surge post an encouraging payrolls report, prompting a sharp reversal in USD/JPY’s decline driven by exaggerated speculation on BoJ rate hikes and aggressive Fed rate cut predictions. Attention now pivots towards the upcoming U.S. CPI release and the Fed’s meeting conclusion later in the week. Treasury yields and the dollar, after robust Treasury auctions, have been on a decline.
The USD/JPY pair showcased a notable 0.9% ascent, nearly recovering from its substantial plunge in November, which saw a drastic 3.8% decline in a single day. Misinterpretation of BoJ Governor Kazuo Ueda’s remarks on potential rate hikes led to misconceived expectations, dispelled by reports suggesting the BoJ sees no rush in eliminating negative interest rates owing to insufficient evidence of sustained inflation stemming from wage growth. Market futures currently indicate a probability of a 10bp hike not until April, post-spring wage negotiations, and the disclosure of FY 2024-5 plans. The primary determinant for USD/JPY and other dollar pairings continues to be the trajectory of Fed policies. Anticipations have shifted post the jobs data, now leaning towards a first Fed hike in May rather than March, with four hikes projected by year-end, as opposed to the previously expected five.
Meanwhile, other currency pairs experienced relatively stable movements. EUR/USD remained stagnant, potentially influenced by concerns regarding China’s contracting economy, expectations of 130bp ECB cuts by 2024, and apprehensions about Ukraine’s financial capability in countering Russia’s invasion. Sterling demonstrated minimal change, relinquishing earlier gains, preceding notable U.S. event risks, including UK jobs data and the BoE and ECB meetings later in the week. The market favors the BoE’s initial cut in June, projecting a total of 75bp reductions next year. The Australian dollar declined by 0.15%, affected by surging Treasury yields, Chinese deflation trends, and plummeting energy prices, with USD/CNH reaching its highest level since November 20th.
Picks of the Day Analysis
EUR/USD (4 Hours)
EUR/USD Rebounds Modestly Amid Quiet Markets, Eyes ECB and US Economic Data
The EUR/USD pair saw a mild uptick, hovering around 1.0765 after hitting a low of 1.0741 in a subdued Monday session. The US Dollar Index experienced marginal gains, driven by rising Treasury yields as investors anticipate significant economic reports and central bank meetings. Eyes are set on the ZEW survey and ECB meeting in the Eurozone, with expectations leaning toward discussions on reinvestments from the PEPP program. Meanwhile, in the US, the focus shifts to the CPI figures and the FOMC meeting, where no significant surprises are expected but markets keenly await new projections. The USD remains in consolidation mode, awaiting fresh catalysts amid a restrained market environment.
On Monday, the EUR/USD moved slightly higher and was able to reach the middle band of the Bollinger Bands. Currently, the price moving slightly below the middle band, suggesting a potential lower movement, potentially reaching the lower band. Notably, the Relative Strength Index (RSI) maintains its position at 43, signaling a bearish outlook for this currency pair.
Resistance: 1.0817, 1.0885
Support: 1.0747, 1.0664
XAU/USD (4 Hours)
XAU/USD Slide Amidst USD Strength and Fed’s Policy Conundrum
Spot Gold faced a continued decline on Monday, slipping below the $2,000 mark in response to the robust US Nonfarm Payrolls report. The surge in the US dollar, propelled not by confidence but by safety concerns, amplified worries about future monetary policy and its potential impact on the economy. The Federal Reserve’s cautious approach to interest rates, driven by the need for previous measures to take effect and concerns about the risks of higher rates, contrasts with a persistent aim to keep inflation in check. The tightening labor market, evident in the shrinking Unemployment Rate to 3.7% in November, signals the potential for further rate hikes, raising the specter of an impending recession. With the impending release of the November Consumer Price Index and the Fed’s policy decision and economic projections this week, answers regarding inflation and the Fed’s stance may dictate Gold’s trajectory amidst the complex economic landscape.
On Monday, XAU/USD moved lower and was able to break below our support levels and create a push to the lower band of the Bollinger Bands. Currently, the price is moving slightly above the lower band which creates a possibility that XAU/USD might move higher and try to reach our resistance level. The Relative Strength Index (RSI) stands at 28, indicating bearish sentiment as it’s in the oversold area.
Resistance: $1,995, $2,016
Support: $1,973, $1,956
Economic Data
Currency
Data
Time (GMT + 8)
Forecast
GBP
Claimant Count Change
15:00
20.3K
USD
Core CPI m/m
21:30
184K
USD
CPI m/m
21:30
3.9%
USD
CPI y/y
21:30
62.0
Written on December 12, 2023 at 2:26 am, by anakin