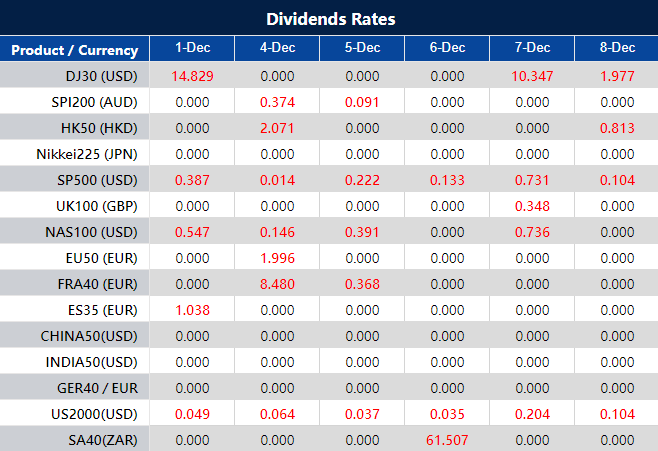
Please note that the dividends of the following products will be adjusted accordingly. Index dividends will be executed separately through a balance statement directly to your trading account, and the comment will be in the following format “Div & Product Name & Net Volume ”.
Please refer to the table below for more details:
The above data is for reference only, please refer to the MT4/MT5 software for specific data.
If you’d like more information, please don’t hesitate to contact info@vtmarkets.com.
U.S. stocks experienced a downturn amidst fluctuating trends, impacted by a drop in inflation and looming job market reports. The Dow Jones and S&P 500 faced consecutive losses, a rare occurrence since October, despite initial optimism from economic indicators. Investors remain watchful, especially regarding upcoming labor-related data releases, notably the November nonfarm payrolls report. European markets saw rebounds, but individual stock performances diverged. Currency markets witnessed the EUR/USD pair declining, potentially signaling a saturation point for rate cut expectations by the ECB and the Fed. Concerns about disinflationary trends arose due to underwhelming economic data. The Sterling approached critical levels against the dollar, influenced by declining yield spreads. Additionally, oil markets saw significant declines, reflecting worries about a global economic slowdown overshadowing OPEC+ supply cuts.
Stock Market Updates
U.S. stocks faced a downturn, grappling with fluctuating trends amid data revealing a drop in inflation and a significant jobs report on the horizon. The Dow Jones fell by 0.19%, closing at 36,054.43, marking the third consecutive losing day for both the Dow and the S&P 500, a rare occurrence since October. Initially buoyed by favorable economic indicators—such as declining labor costs and increased productivity—the market struggled to maintain its gains, fluctuating throughout the session. Investors remain vigilant as they assess various labor-related data releases, particularly scrutinizing the ADP report, which hinted at a potential easing in the job market, a crucial concern for the Federal Reserve.
However, uncertainties loom as investors eye upcoming data, particularly the eagerly awaited November nonfarm payrolls, wages, and unemployment rate figures scheduled for release on Friday. Despite the recent declines, questions emerge about whether this reflects a temporary pause in the late 2023 rally or signals a potential overextension of the market’s rapid ascent. Meanwhile, European markets rebounded, with the Stoxx 600 index rising by 0.6%, driven by surges in sectors like mining and autos, even as specific stocks like H&M experienced dips following a downgrade by Deutsche Bank analysts. In the Asia-Pacific region, markets rebounded after a previous sell-off, contributing to a positive turn in U.S. stocks during Wednesday’s morning trade following consecutive days of decline.
Amidst these fluctuations, individual stocks experienced divergent performances: Cloud company Box saw a more than 10% tumble due to third-quarter results falling below expectations, while homebuilder stock Toll Brothers gained nearly 2% after surpassing projections on both revenue and earnings. Additionally, telecom company Nokia faced a 6% drop following news of a partnership between U.S. giant AT&T and Ericsson for a next-generation wireless network rollout. In Europe, travel group Tui experienced a 14% increase in its stock value, backed by a significant rise in full-year profit and a promising forecast for operating profit growth in 2024.
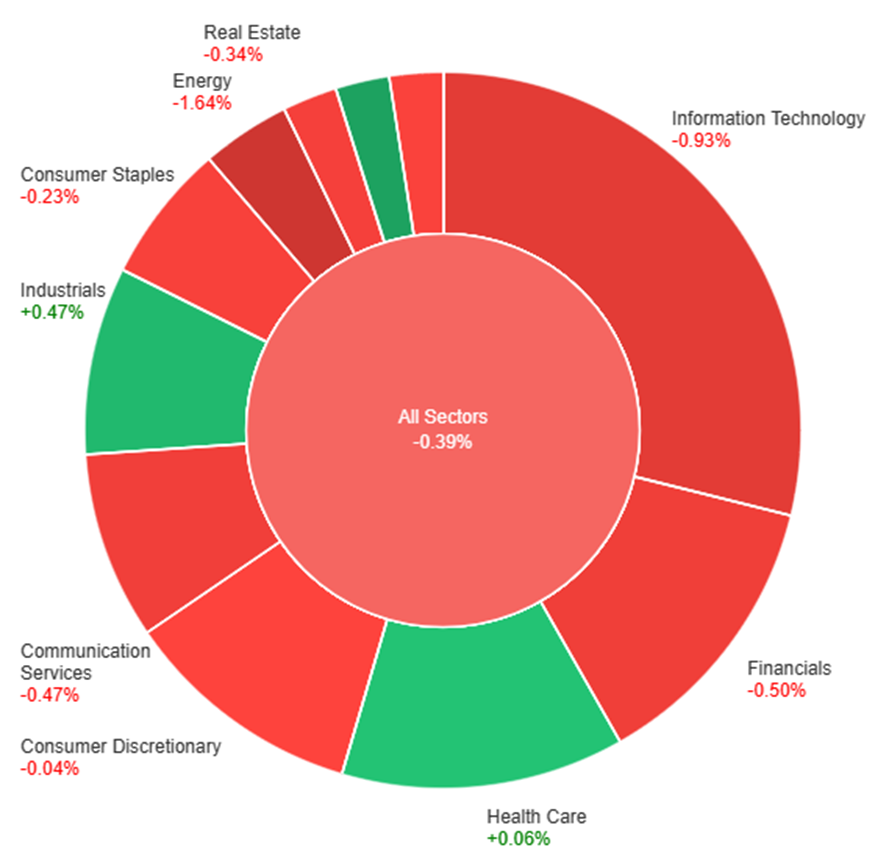
On Wednesday, most sectors experienced a slight downturn with the overall market showing a decrease of 0.39%. Utilities saw a positive trend, gaining 1.38%, followed by Industrials at 0.47% and Health Care at a minimal 0.06% increase. Conversely, Energy faced the most significant decline, plummeting by 1.64%, while Information Technology also saw a considerable drop of 0.93%. Other sectors like Consumer Discretionary, Materials, Consumer Staples, Real Estate, Communication Services, and Financials also registered decreases ranging from -0.04% to -0.50%.
Currency Market Updates
In the recent currency market updates, the EUR/USD pair experienced a mild decline amidst a backdrop of various economic indicators and central bank sentiments. Despite a decrease in yield spreads between 2-year bunds and Treasury bonds, the pace of losses for the pair slowed, possibly indicating a saturation point for expectations of rate cuts by the ECB and the Fed in the coming year. The dollar faced challenges due to lower-than-anticipated ADP and unit labor cost figures, contributing to concerns about disinflationary trends, compounded by underwhelming JOLTS data. As market speculation already prices in future rate cuts by the Fed and the ECB, the focus has shifted to upcoming economic reports, particularly Thursday’s jobless claims, Friday’s employment report, and next Tuesday’s CPI figures, to gauge their impact on altering expectations for Fed rate cuts relative to the ECB’s stance.
EUR/USD’s decline to 1.07725 lows followed unexpected plunges in German industrial orders, reflecting a pattern of increasingly negative German economic data. While ECB representatives like Peter Kazimir echoed sentiments aligning with the view that rate hikes seem improbable, the possibility of swift rate cuts remains uncertain. Meanwhile, the USD/JPY pair saw a marginal increase, navigating a potential reversal from its 2023 uptrend, with key technical thresholds breached this week. Market anticipation for a downtrend revival, possibly leading to a move towards 144.58, relies heavily on forthcoming U.S. employment and inflation data reinforcing expectations of substantial Fed rate cuts.
Elsewhere, the Sterling approached a critical support level at 1.2569 against the dollar, influenced by declining Gilt-Treasury yield spreads. Market attention has turned to the upcoming BoE meeting, particularly monitoring the policy vote split, as expectations lean toward potential rate cuts as early as May, with projected cuts of 84 basis points by year-end, amid risks outlined in the BoE’s Financial Stability Report. Additionally, in the oil market, WTI experienced a significant decline of over 4%, while Brent hit its lowest point since June. These movements reflect growing concerns about a potential slowdown in the global economy, overshadowing the impact of OPEC+ supply cuts, as market sentiment increasingly focuses on demand-side risks.
Picks of the Day Analysis
EUR/USD (4 Hours)
EUR/USD Continues Decline Amidst Economic Indicators and Central Bank Signals
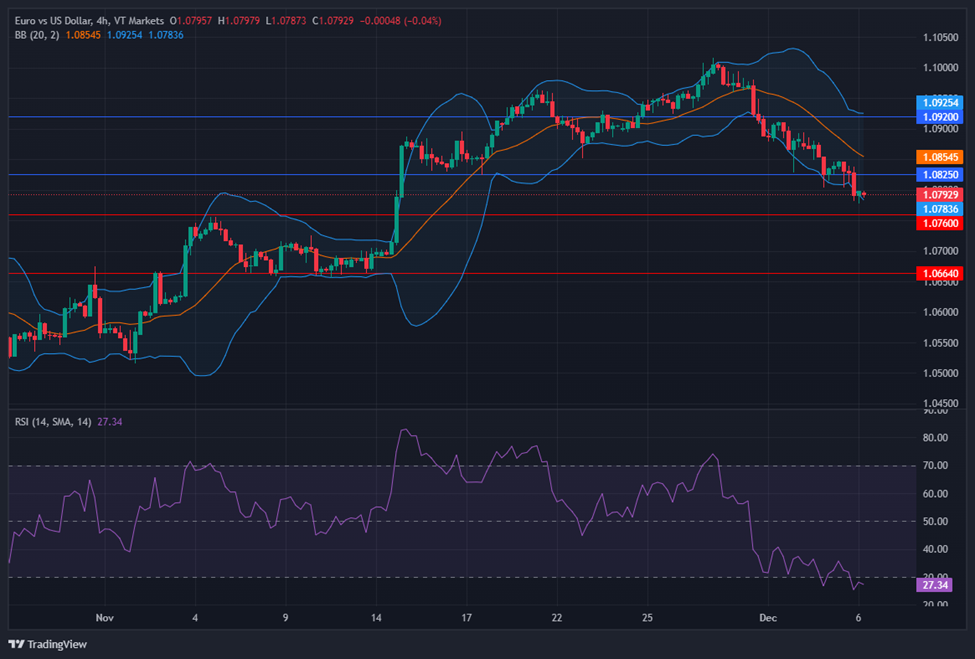
The EUR/USD pair sustained its sixth consecutive day of decline, plunging below 1.0770, marking its lowest point since mid-November. This downward trend stems from a weakened Euro juxtaposed against a robust US Dollar, intensifying pressure on the currency pair. Anticipation hovers around US job data, where the European Central Bank’s (ECB) projected rate cuts for 2024, ahead of the Federal Reserve (Fed), have notably impacted the EUR/USD dynamics. Despite subpar US data failing to prompt significant movement, the German 10-year bond yield’s drop, surpassing its US counterpart, indicates a complex market sentiment. Eurozone Retail Sales and Germany’s Factory Orders, showcasing mixed results, contribute to the growing expectation of ECB easing. Meanwhile, in the US, the ADP report hinted at a tightening labor market but failed to deter the resilient Dollar. With upcoming critical events such as Jobless Claims, Nonfarm Payrolls, the Consumer Price Index (CPI), and the impending FOMC decision, the market focus remains intensely fixated on the EUR/USD trajectory amidst these economic indicators and central bank signals.
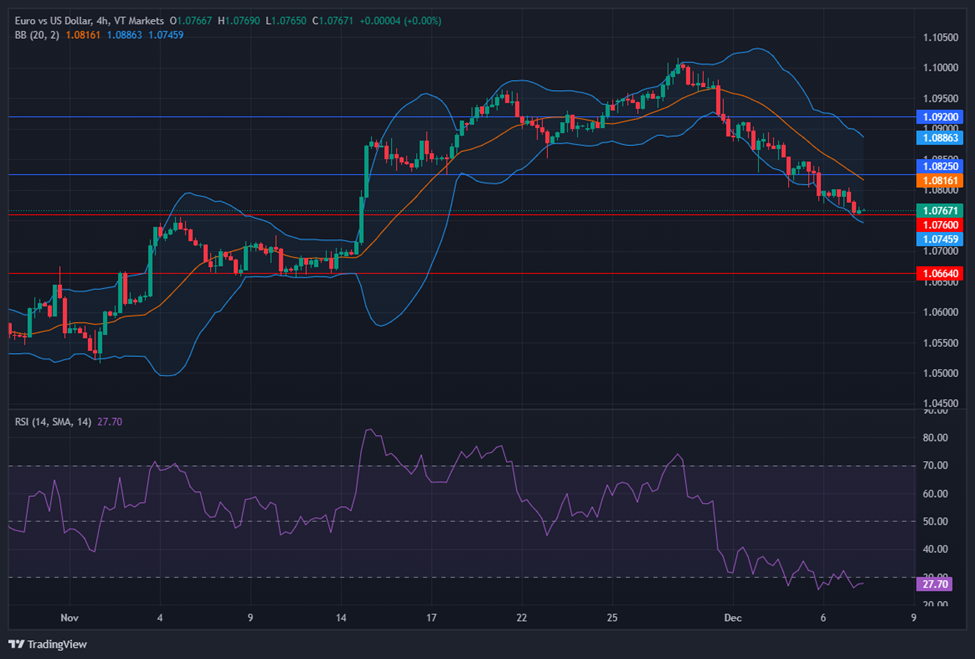
On Wednesday, the EUR/USD experienced a downward movement, creating a push to the lower band of the Bollinger Bands. Currently, the price moving slightly above the lower band, suggesting a potential upward movement, potentially reaching the middle band before goes back lower. Notably, the Relative Strength Index (RSI) maintains its position at 27, signaling a bearish outlook for this currency pair.
Resistance: 1.0825, 1.0920
Support: 1.0760, 1.0664
XAU/USD (4 Hours)
XAU/USD Consolidates Amid Economic Data and Dollar Strength
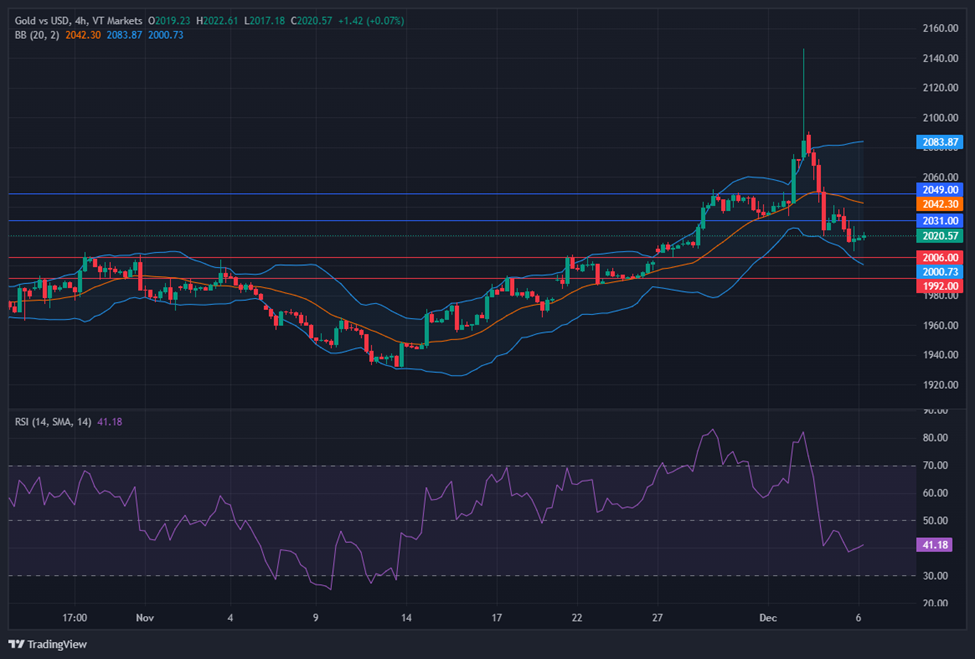
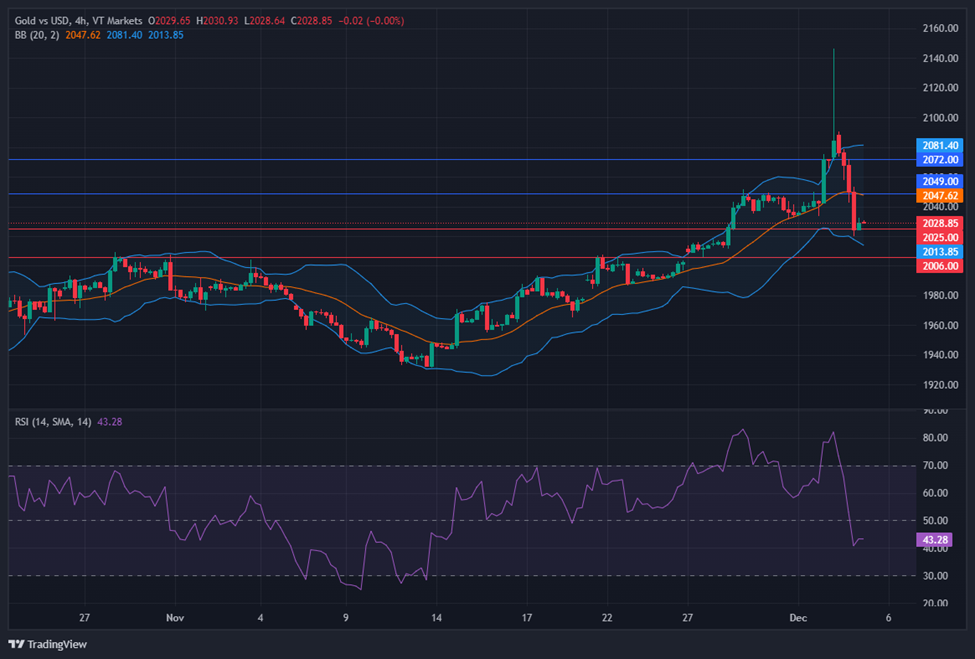
Gold (XAU/USD) experienced a notable shift as it recovered from recent lows near $2,008 following its pullback from record highs above $2,130. Currently consolidating around the $2,030 support level, the metal finds itself grappling with lower Treasury yields while facing a resilient US Dollar. Despite softer employment figures and declining 10-year Treasury yields, Gold’s upward momentum remains subdued. The metal retains a bullish long-term trend, yet it’s notably distant from its recent historic peaks, with its stability hinting at a complex interplay of economic data and currency strength. The looming release of further US employment data stands poised to influence Gold’s trajectory in the coming days.
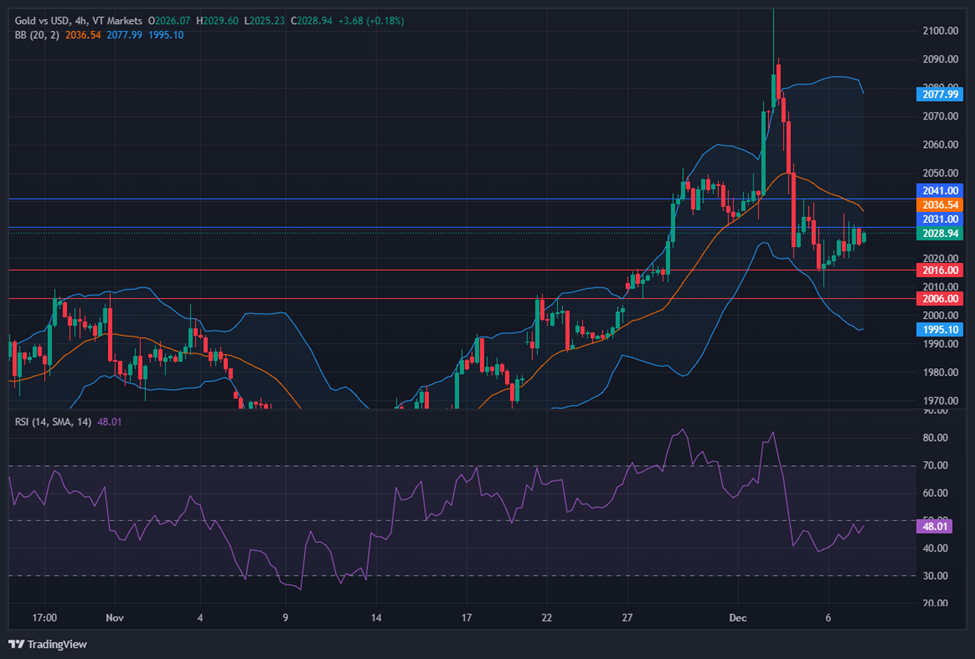
On Wednesday, XAU/USD moved slightly higher trying to reach the middle band of the Bollinger Bands. The current movement suggests a potential upward trend, possibly reaching the middle band. The Relative Strength Index (RSI) stands below 48, indicating a neutral sentiment for this pair.
The stock market displayed a mixed session with varied movements across major indices: the Dow and S&P 500 edged slightly downward while the Nasdaq surged, propelled by tech stock performance. Factors including the U.S. 10-year Treasury yield dip below 4.2% and European market fluctuations played key roles. Amidst this, notable individual stock movements, like GitLab’s surge and the Russell 2000’s fall, highlighted nuanced market dynamics. Additionally, the currency market witnessed significant fluctuations, including the EUR/USD pair’s decline, highlighting the impact of central bank signals and global economic indicators on currency valuations.
Stock Market Updates
The stock market experienced a mixed day on Tuesday as major indices saw varied movements. The Dow Jones Industrial Average and the S&P 500 slid slightly, with the Dow dropping by 0.22% to close at 36,124.56 and the S&P 500 inching down by 0.06% to 4,567.18. However, the Nasdaq Composite managed to gain 0.31%, reaching 14,229.91, propelled by the outperformance of technology shares. GitLab surged by 11.5% after surpassing quarterly financial expectations and issuing robust guidance for the current quarter. Conversely, the Russell 2000 fell by more than 1% after a recent upward trend, raising hopes for a broader market rally and potential interest rate cuts from the Federal Reserve.
The market’s movements were influenced by various factors, including fluctuations in the U.S. 10-year Treasury yield, which fell below the significant 4.2% level, indicating a cooling labor market. This prompted a boost in technology shares, driving the Nasdaq into positive territory for the session. Meanwhile, European markets displayed mixed performance, with the Stoxx 600 index closing 0.4% higher, fueled by gains in auto stocks but offset by drops in mining stocks. Telecom stocks also saw notable shifts, with Ericsson climbing by 4.4% following a deal with AT&T, while Nokia faced an 8.4% plunge due to anticipated losses. The overall market sentiment seemed to hinge on prospects of potential rate cuts from the Federal Reserve, despite attempts by Fed Chair Jerome Powell to temper expectations for such measures. Additionally, gold prices reached record highs, touching $2,100, propelled by geopolitical uncertainty, a weaker U.S. dollar, and expectations of future interest rate cuts.
The market’s trajectory appeared influenced by nuanced shifts in various sectors and global events, with investors closely monitoring economic data, Federal Reserve signals, and geopolitical factors that could impact future market movements.
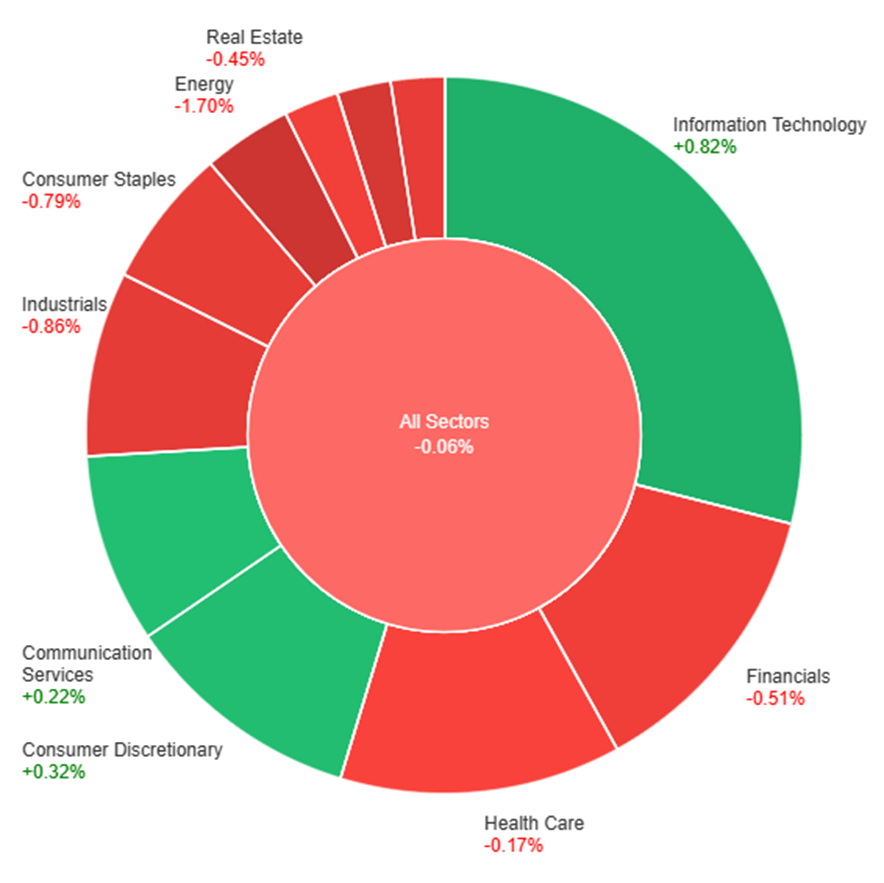
On Tuesday, the overall market saw a slight dip of 0.06%. However, specific sectors experienced varied movements. Information Technology surged by 0.82%, leading the gainers, followed by Consumer Discretionary (+0.32%) and Communication Services (+0.22%). Health Care (-0.17%), Real Estate (-0.45%), Financials (-0.51%), Consumer Staples (-0.79%), Utilities (-0.81%), Industrials (-0.86%), Materials (-1.37%), and Energy (-1.70%) all faced declines, with Energy and Materials showing the most significant drops among the sectors.
Currency Market Updates
The currency market witnessed significant fluctuations, particularly in the EUR/USD pair, which plummeted by 0.5%. This decline came after ECB’s Isabel Schnabel hinted at holding off on further rate hikes, coupled with improved U.S. November ISM services. The breach of support at 1.0800 led to a 0.4% rise in the dollar index, heavily influenced by EUR/USD, surpassing its downtrend line and settling around the 200-day moving average at 103.56. The market anticipates potential dollar gains depending on forthcoming economic indicators like Thursday’s jobless claims, Friday’s employment report, and next Tuesday’s CPI. This could mitigate the slide in Treasury yields, which have been factoring in five Fed cuts in 2024, possibly commencing as early as March post the Fed’s Dec. 12-13 meeting. Simultaneously, the ECB appears poised for two rate cuts by April and a substantial 142 basis points cut by the year-end.
Meanwhile, the pound experienced a 0.4% decline amidst a drop in 10-year gilts yields. Sterling’s support from the Bank of England signals a longer maintenance of higher rates compared to the Fed in the upcoming year. However, this also highlights the greater challenge the UK faces in curbing disinflation compared to the U.S. and the eurozone. In another development, the USD/JPY pair rose by 0.1% after initial fluctuations following mixed U.S. data. Yet, a bearish outlook persists due to a double-top at 32-year highs, hinting at potential medium-term weakness as the Fed’s tightening cycle reverses. The pair has approached major support levels at 146.64, and further decline might target significant supports at 144.58.
Additionally, the Australian dollar fell by 1% post the RBA meeting, perceived as less hawkish than anticipated. Moody’s downward revision of China’s outlook and a subsequent drop in the CSI300 added to the pressure, leading to the Aussie’s decline to its lowest point since February 2019. These combined factors contributed to the noteworthy movements across the currency market, reflecting the influence of global economic indicators and central bank policies on currency pairs’ valuations.
The EUR/USD sustained its decline below the 20-day SMA, influenced by a resurgent US Dollar and cautious remarks from ECB’s Isabel Schnabel regarding inflation. Speculation of a potential rate cut by the ECB heightened as Eurozone indicators revealed a decline in the Producer Price Index and stable one-year inflation expectations at 4.0%. Meanwhile, in the US, despite mixed data, a stronger Dollar persisted, driven by a perceived completion of the Fed’s tightening cycle amid slowing inflation and a more balanced labor market. Market focus now shifts to upcoming Eurozone retail sales data and the ADP Employment Report in the US as key indicators impacting the EUR/USD trend.
On Tuesday, the EUR/USD experienced a downward movement, creating a push to the lower band of the Bollinger Bands. Currently, the price moving slightly above the lower band, suggesting a potential upward movement, potentially reaching the middle band before goes back lower. Notably, the Relative Strength Index (RSI) maintains its position at 27, signaling a bearish outlook for this currency pair.
Resistance: 1.0825, 1.0920
Support: 1.0760, 1.0664
XAU/USD (4 Hours)
XAU/USD Struggles as Dollar Gains Momentum Amid Mixed US Reports
Gold (XAU/USD) encountered a brief upswing in the Asian session before resuming its downward trajectory, signaling persistent bearish pressure. Despite varied US economic indicators and a drop in Treasury yields, the precious metal declined. The US reported a decrease in job openings alongside an ISM Services PMI surpassing expectations, fostering a balanced labor market impression. Despite this, the Greenback regained strength as Treasury yields fell, hitting multi-day highs. This Dollar momentum, coupled with declining yields, sustains a short-term bullish trend, painting a negative outlook for Gold amidst anticipation of key upcoming US data releases.
On Tuesday, XAU/USD moved lower trying to reach the lower band of the Bollinger Bands. The current movement suggests a potential upward trend, possibly returning to the middle band. The Relative Strength Index (RSI) stands below 41, indicating a bearish yet neutral sentiment for this pair.
In the riveting world of finance, tales of triumph and turmoil are often immortalised on both the big and small screens. If you’ve been captivated by the dazzling lives of traders depicted in popular series like “Billions,” you might be intrigued to explore the real-life counterparts who have left an indelible mark on the financial landscape.
Beyond the drama and glamour of television, these master traders have reshaped markets, defied the odds, and amassed fortunes that rival even the most vivid Hollywood imagination.
1. George Soros: The Speculator Extraordinaire
Estimated net worth: $8.5 billion (2022)
Source of wealth: Hedge fund management
Known as “The Man Who Broke the Bank of England,” George Soros is a name synonymous with audacious market speculation. In 1992, Soros made a bold bet against the British pound, earning him a staggering $1 billion in a single day. His ability to foresee market trends and capitalise on them has solidified his place as one of the greatest traders in history.
George Soros source: Open Society Foundation
2. Warren Buffett: The Oracle of Omaha
Estimated net worth: $104.6 billion (2022)
Source of wealth: Investing
Warren Buffett, often hailed as the Oracle of Omaha, stands as a beacon of value investing. As the chairman and CEO of Berkshire Hathaway, Buffett’s patient and disciplined approach has seen him accumulate vast wealth over the decades. His sage advice and long-term investment strategy make him not just a trader but an iconic figure in the world of finance.
Warren Buffett source: Business Insider
3. Jesse Livermore: The Legendary Stock Trader
Estimated net worth: $100 million (1929, adjusted for inflation)
Source of wealth: Stock trading
The early 20th century saw the rise of Jesse Livermore, a legendary figure in stock trading. Livermore’s career was marked by astounding successes and heartbreaking losses. His uncanny ability to read market trends earned him immense fortunes, but the volatile nature of trading eventually took its toll. Livermore’s legacy is one of both triumph and tragedy, showcasing the unpredictable nature of financial markets.
Jesse Livermore source: Analyzing Alpha
4. Ray Dalio: Mastering Macro Trends
Estimated net worth: $16.9 billion (2022)
Source of wealth: Hedge fund management
Ray Dalio, the founder of Bridgewater Associates, has left an indelible mark on the hedge fund industry. Known for his expertise in macroeconomic trends, Dalio’s risk management strategies have propelled Bridgewater to become one of the largest and most successful hedge funds globally. His insights into the broader economic landscape have earned him a reputation as a thought leader in the financial world.
Ray Dalio source: Fortune India
5. Bernard Baruch: The Presidential Advisor and Financier
Estimated net worth: $200 million (1955, adjusted for inflation)
Source of wealth: Investing, stock trading
In the early 20th century, Bernard Baruch, a distinguished financier and trusted advisor to multiple U.S. presidents, emerged as a significant figure whose impact resonated in both financial and political spheres. His accomplishments extended beyond successful trading ventures to encompass a pivotal role in shaping economic policy, particularly during times of crisis. Baruch’s unique position at the intersection of finance and politics highlighted the depth of his influence and the critical role he played in navigating the challenges of his era.
Bernard Baruch source: Zocalo Public Square
6. William Delbert Gann: Pioneering Technical Analysis
Estimated net worth: $100 million (1940, adjusted for inflation)
Source of wealth: Trading commodities, stocks, and currencies
William Delbert Gann’s contributions to technical analysis are nothing short of revolutionary. Gann’s innovative techniques, including Gann angles and the Square of Nine, have become cornerstones of market forecasting. His work laid the foundation for a more systematic approach to understanding and predicting market movements.
William Delbert Gann
7. Richard Dennis: The Turtle Trader Experiment
Estimated net worth: $200 million (2014)
Source of wealth: Trading commodities
Richard Dennis, a commodities trader, gained fame for his unconventional approach to trading. The Turtle Traders experiment, where he trained novices to become successful traders using specific rules, demonstrated the potential of systematic trading strategies. Dennis’s experiment challenged conventional wisdom and showcased the power of disciplined trading.
Richard Dennis source: Trusted Broker Reviews
8. John Paulson: Profiting from the Subprime Mortgage Crisis
Estimated net worth: $22 billion (2022)
Source of wealth: Hedge fund management
John Paulson gained widespread recognition for his successful bets against the subprime mortgage market in 2007. His prescient moves not only protected his hedge fund from the financial crisis but also earned it billions of dollars in profits. Paulson’s strategic thinking during turbulent times highlights the importance of adaptability in the ever-changing world of finance.
John Paulson source: Vanity Fair
9. Paul Tudor Jones: Predicting the 1987 Stock Market Crash
Estimated net worth: $5.5 billion (2022)
Source of wealth: Hedge fund management
Paul Tudor Jones, a pioneer in global macro trading, made a name for himself by accurately predicting the 1987 stock market crash. The founder of Tudor Investment Corporation, Jones has consistently demonstrated his ability to navigate volatile markets and capitalise on major economic shifts.
Paul Tudor Jones source: National Audubon Society
10. Jim Simons: The Quantitative Trading Maestro
Estimated net worth: $23.5 billion (2022)
Source of wealth: Quantitative investment management
Jim Simons, a mathematician turned hedge fund manager, founded Renaissance Technologies and revolutionised quantitative trading. Simons’ success in developing complex algorithms and employing mathematical models has consistently delivered high returns, solidifying his place as a trailblazer in the world of quantitative finance.
Jim Simons source: Just Trading
In the intricate tapestry of financial history, master traders have crafted tales of risk, reward, and resilience – stories that caution and inspire. Beyond the allure of screens, the real magic unfolds in the strategic minds of those who conquer markets. If you’re inspired to start your own trading journey and seek outstanding results, take the first step by opening a live account with VT Markets. Just as legendary traders paved their way, this platform can be your foundation for financial success. Open your account and begin crafting your narrative in the dynamic world of trading.
Explore the World of CFD Trading with VT Markets in the UK
In the dynamic world of online trading, Contract for Differences (CFDs) has emerged as a popular investment instrument. VT Markets, a leading trading platform, offers an expansive range of CFDs in the UK, including shares and bonds, providing traders with numerous opportunities to diversify their portfolios.
Why Trade CFD with VT Markets
Choosing the right platform for CFD trading is as crucial as understanding the market itself. VT Markets stands out in the UK’s competitive trading landscape for several compelling reasons:
1. Comprehensive Range of Markets: VT Markets offers an extensive array of CFDs, including shares from major global markets and a variety of bond CFDs. This diversity allows traders to spread their risk and explore opportunities in different sectors.
2. Competitive Leverage Options: With leverage options of 20:1 for shares and 100:1 for bonds, VT Markets caters to traders who seek to maximize their market exposure. This leverage can significantly amplify potential returns, albeit with a proportionate increase in risk.
3. Advanced Trading Tools: VT Markets provides cutting-edge trading tools and platforms, including sophisticated charting packages and real-time market data. These tools are essential for making informed trading decisions.
4. Education and Support: Understanding the complexity of CFDs is vital for success. VT Markets offers comprehensive educational resources, including webinars, tutorials, and expert insights, to equip traders with the necessary knowledge.
5. Customer-Centric Approach: VT Markets is committed to providing exceptional customer service. Whether it’s technical support or market advice, the dedicated team is always ready to assist.
By trading CFDs with VT Markets, traders in the UK can confidently navigate the financial markets, backed by a platform that supports their trading aspirations every step of the way.
VT Markets CFDs: A Diverse Range of Trading Instruments
1. Shares CFDs (Leverage 20:1): VT Markets offers CFD trading on shares from various global markets, allowing traders to speculate on price movements without owning the underlying asset. This includes:
US Shares CFD: Trade on the performance of leading American companies.
UK Shares CFD: Get access to some of the biggest names on the London Stock Exchange.
EU Shares CFD: Diversify your portfolio by trading shares from major European companies.
HK Shares CFD: Tap into the Asian market by trading shares from the Hong Kong stock exchange.
With a leverage of 20:1, traders can magnify their trading capital, though it’s important to remember that leverage also increases risk exposure.
2. Bond CFDs (Leverage 100:1): Bond CFDs are another exciting offering at VT Markets. With leverage up to 100:1, traders can engage in the bond market, an area often considered as a safe haven during market volatility. This high leverage ratio allows significant market exposure, offering the potential for considerable returns.
Advantages of Trading CFDs with VT Markets in the UK
a. Flexibility and Accessibility: CFD trading with VT Markets provides flexibility, allowing traders to go long or short based on their market predictions. This accessibility makes it easier for traders to respond quickly to market changes.
b. Diverse Portfolio Options: With a range of shares and bond CFDs, VT Markets enables traders to diversify their investment portfolio, spreading risk across different asset classes.
c. Advanced Trading Platforms: VT Markets prides itself on offering advanced trading platforms that are user-friendly and equipped with essential tools and analytics for effective trading.
d. Regulatory Compliance: As a platform compliant with regulatory standards, VT Markets offers a secure and reliable trading environment, ensuring peace of mind for traders.
Embrace Your Trading Journey with VT Markets UK
CFD trading with VT Markets in the UK opens up a world of opportunities for traders looking to diversify their investment strategies. Whether interested in shares or bonds, VT Markets provides a robust platform, equipped with all the tools necessary for successful trading. As always, it’s crucial for traders to understand the risks involved, particularly when trading with leverage.
Ready to explore the potential of CFD trading? Visit VT Markets today, sign up for a demo account, and experience the thrill of trading with one of the leading platforms in the UK. Discover more at vtmarkets.net.
Following a five-week winning streak, stock markets experienced a decline, prompting investor worries about potential overvaluation. Major indices, including the Dow Jones Industrial Average, S&P 500, and Nasdaq Composite, dropped due to selling pressure on Big Tech stocks. However, Bitcoin hit a 19-month high while gold reached unprecedented levels, benefiting companies like Marathon Digital, Riot Platforms, MicroStrategy, and Coinbase. The market shift away from tech shares, despite the S&P 500 hitting highs, led to speculation about future rate cuts from central banks, especially as Federal Reserve Chairman Jerome Powell attempted to moderate expectations. European and Asia-Pacific markets reflected mixed performances amid predictions of interest rate cuts in 2024. Currency markets saw significant movements, with the dollar index surging and the euro facing downward pressure against the dollar due to Treasury yield recoveries and market sentiment regarding potential ECB and Fed rate cuts. Meanwhile, gold prices dropped significantly following the resurgence in Treasury yields and a strengthening dollar.
Stock Market Updates
Stocks experienced a dip after a continuous five-week winning streak, raising concerns among investors about potential overvaluation in the market. The Dow Jones Industrial Average closed with a 0.11% drop, the S&P 500 fell by 0.54%, and the Nasdaq Composite declined by 0.84%, attributed to the selling of Big Tech shares, which had been driving the market’s gains. Conversely, Bitcoin surged past $41,000, hitting a 19-month high, while gold reached its highest intraday level ever, leading to gains for companies like Marathon Digital, Riot Platforms, MicroStrategy, and Coinbase.
The pullback was marked by a shift away from sectors that had been driving market growth for almost a year, particularly technology shares. Despite this, the S&P 500 closed at its highest level since March 2022, with year-to-date gains nearing 20%. The Dow and Nasdaq also experienced significant increases in 2023. Speculation about future rate cuts from major central banks persisted, even as Federal Reserve Chairman Jerome Powell attempted to temper these expectations.
In Europe, markets saw a mixed performance, largely lower, reflecting a global pause in the recent rally amid predictions of interest rate cuts from major central banks in 2024. Gold prices surged, hitting a record high, attributed to geopolitical uncertainty, a potentially weaker U.S. dollar, and anticipated interest rate cuts in the coming year. In Asia-Pacific, markets were also mixed as investors awaited upcoming economic data and crucial inflation readings later in the week.
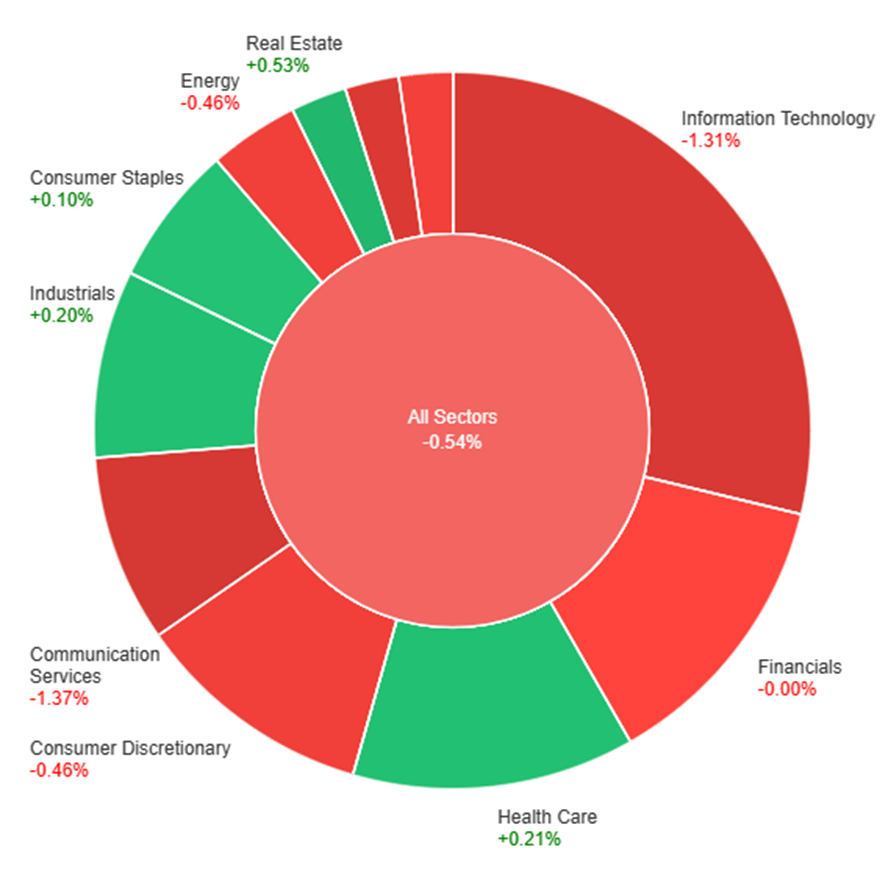
On Monday, the market experienced a slight overall decline of 0.54%. Real Estate stood out with a positive increase of 0.53%, followed by Health Care and Industrials with gains of 0.21% and 0.20%, respectively. Conversely, Materials took a significant hit, dropping by 1.19%, while Information Technology and Communication Services also experienced notable declines of 1.31% and 1.37%, respectively. Financials remained relatively stable, showing no change, and other sectors like Utilities, Energy, and Consumer Discretionary saw moderate decreases ranging from 0.39% to 0.46%.
Currency Market Updates
The currency market experienced significant movements, particularly in the dollar index, which surged by 0.6%. This rise was attributed to the recovery of Treasury yields from their previous substantial decline in October and November. The upcoming release of crucial U.S. data, coupled with the anticipation of the Federal Reserve meeting, heightened market expectations regarding potential rate cuts by the European Central Bank (ECB) in the following year. Concerns persisted around the Eurozone’s largest economy due to a recent court ruling, further contributing to the speculation of potential ECB rate cuts. The dollar’s momentum was primarily driven by the rebound of 2-year Treasury yields, which recovered a portion of their previous decline, alongside market sentiments that favored possible Fed rate cuts in 2024 unless incoming U.S. economic data alters these expectations.
Meanwhile, the euro faced downward pressure, declining by 0.6% against the dollar, as increasing Treasury yields outweighed minimal gains in bund yields. The EUR/USD pair breached key support levels, including the 200-day moving average line, signaling potential further downside. Market indicators highlighted a decrease in overbought positions, but the expansion of speculative long positions in the market indicated a possibility of continued losses unless forthcoming U.S. data supported expectations of swift Federal Reserve intervention. Additionally, other currencies like the pound sterling saw a contrasting outlook compared to the ECB and Fed, with a potential rate cut by the Bank of England not expected until June, projecting a more conservative 2023 monetary policy. Lastly, gold prices experienced a significant drop, plunging from a record high to $2,020, paralleling the resurgence in Treasury yields and the strengthening dollar.
Picks of the Day Analysis
EUR/USD (4 Hours)
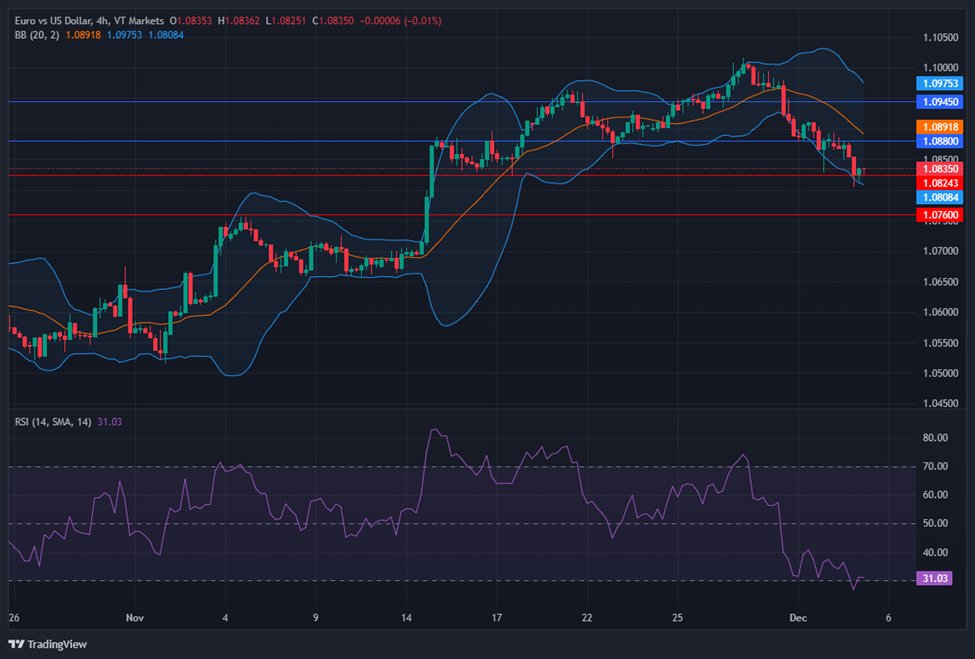
EUR/USD Faces Downward Pressure Amid Rate Cut Speculations and Labor Market Data
The EUR/USD faced its fourth consecutive drop, slipping below the 20-day SMA and hovering above the 1.0800 mark as the US Dollar gained strength before pivotal labor market data. Speculation around the ECB potentially cutting rates before the Fed intensified the downward trend, retracting the Euro from recent highs above 1.1000. Despite the descent, the movement seems somewhat exaggerated, with expected sustained volatility. Market focus shifts to key releases including Eurostat’s PPI and PMIs, alongside US labor reports such as JOLTS, ISM Services PMI, ADP employment data, Jobless Claims, and Nonfarm Payrolls expected later in the week.
On Monday, the EUR/USD experienced a downward movement, creating a push to the lower band of the Bollinger Bands. Currently, the price moving slightly above the lower band, suggesting a potential upward movement, potentially reaching the middle band before goes back lower. Notably, the Relative Strength Index (RSI) maintains its position at 31, signaling a bearish outlook for this currency pair.
Gold spot prices surged to a record high of approximately $2,150, later correcting sharply below $2,040, in a week marked by erratic fluctuations. The upcoming US labor market data, central bank meetings, and Consumer Price Index contribute to the uncertain landscape. Despite a Federal Reserve tone suggesting hawkishness, Gold surged, possibly fueled by expectations of rate cuts. However, the subsequent pullback hints at a potential overestimation of rate cut probabilities. The market’s movements seem more reactive to sentiment shifts than distinct fundamentals, lacking a clear catalyst for its rally or the subsequent sharp decline. The rise in US yields and Dollar strength on Monday only partially explain the magnitude of Gold’s unpredictability.
On Monday, XAU/USD moved lower after reaching an all-time high of $2,150 but subsequently experienced another strong downward movement, returning to around the $2,030 level. This movement resulted in high volatility, pushing the price beyond both the upper and lower bands of the Bollinger Bands. The current movement suggests a potential upward trend, possibly returning to the middle band. The Relative Strength Index (RSI) stands below 43, indicating a bearish yet neutral sentiment for this pair.
Various events are set to impact the markets this week, most notably the rate decisions of major central banks including the Reserve Bank of Australia and the Bank of Canada. Traders are advised to exercise caution and stay informed about the latest developments to ensure a successful week of trading.
Here are the upcoming market highlights for the week:
Reserve Bank of Australia Rate Statement (5 December 2023)
The Reserve Bank of Australia raised its cash rate by 25 bps to 4.35% in November after maintaining it at 4.1% following its previous four meetings.
Analysts predict that the central bank will keep its cash rate at 4.35% after its upcoming meeting on 5 December.
US ISM Services PMI (5 December 2023)
The Institute of Supply Management (ISM) Non-Manufacturing PMI—also known as the US ISM Services PMI—fell to 51.8 in October, the lowest in five months.
Updated figures will be released on 5 December, with analysts expecting an updated PMI of 52.
Australia Quarterly Gross Domestic Product (6 December 2023)
The Australian economy expanded by 0.4% in Q2 2023.
Analysts predict that the data for Q3, scheduled to be released on 6 December, will indicate slower expansion at 0.3%.
Bank of Canada Rate Statement (6 December 2023)
The Bank of Canada kept the target for its overnight rate at 5% following its October 2023 meeting.
Its next rate statement is scheduled to be released on 6 December, with analysts anticipating that the rate will remain at 5%.
US Jobs Report (8 December 2023)
The US economy added 150,000 jobs in October, a decrease from the 297,000 jobs added in September. Meanwhile, the unemployment rate increased to 3.9% in the same period, slightly exceeding the previous month’s figure of 3.8%.
Updated figures will be released on 8 December, with analysts forecasting the addition of 180,000 more jobs and an unemployment rate of 3.9%.
University of Michigan Consumer Sentiment Index (8 December 2023)
The University of Michigan Consumer Sentiment Index for the US was revised to 61.3 in November from a preliminary figure of 60.4, but it still remained at its lowest level since May.
Updated figures will be released on 8 December, with analysts expecting the index to hit 61.8.
As part of our commitment to provide the most reliable service to our clients, there will be server maintenance this weekend.
Maintenance Hours :
2nd of December 2023 (Saturday) 00:00-05:00 (GMT+2)
Please note that the following aspects might be affected during the maintenance:
1. The price quote and trading management will be temporarily disabled during the maintenance. You will not be able to open new positions, close open positions, or make any adjustments to the trades.
2. There might be a gap between the original price and the price after maintenance. The gaps between Pending Orders, Stop Loss and Take Profit will be filled at the market price once the maintenance is completed. If you don’t want to hold any open positions during the maintenance, it is suggested to close the position in advance.
3. Please refer to MT4/MT5 for the latest update on the completion and market opening time. Our services will be back online once the maintenance is completed.
Thank you for your patience and understanding about this important initiative.
If you’d like more information, please don’t hesitate to contact info@vtmarkets.com
Please note that the dividends of the following products will be adjusted accordingly. Index dividends will be executed separately through a balance statement directly to your trading account, and the comment will be in the following format “Div & Product Name & Net Volume ”.
Please refer to the table below for more details:
The above data is for reference only, please refer to the MT4/MT5 software for specific data.
If you’d like more information, please don’t hesitate to contact info@vtmarkets.com.