Notification of Trading Adjustment in Holiday – January 5, 2024

Dear Client,

Affected by international holidays, the trading hours of some VT Markets products will be adjusted. Please check the following link for the remaining affected products:

Notification of Trading Adjustment in Holiday

Note: The dash sign (-) indicates normal trading hours.

Friendly Reminder:
The above data is for reference only, please refer to the MT4/MT5 software for specific data.

If you’d like more information, please don’t hesitate to contact info@vtmarkets.com.

Dividend Adjustment Notice – January 5, 2024

Dear Client,

Please note that the dividends of the following products will be adjusted accordingly. Index dividends will be executed separately through a balance statement directly to your trading account, and the comment will be in the following format “Div & Product Name & Net Volume ”.

Please refer to the table below for more details:

The above data is for reference only, please refer to the MT4/MT5 software for specific data.

If you’d like more information, please don’t hesitate to contact info@vtmarkets.com.

Nasdaq Slides, Dollar Fluctuates Ahead of NFP

The stock market closed with mixed results as the Nasdaq Composite sustained its longest losing streak since October 2022, dropping by 0.56% while the S&P 500 experienced its fourth consecutive decline. Mega-cap tech stocks, especially Apple, faced significant underperformance due to valuation concerns and Federal Reserve uncertainties. Despite this downturn, some analysts remain optimistic about long-term prospects, expecting the S&P 500 to potentially reach 5,000 by year’s end. Meanwhile, in the currency market, the US Dollar Index showed fluctuations, influenced by investor caution ahead of crucial NFP figures and positive ADP readings. Major currency pairs reacted differently to economic data and risk sentiment, shaping their dynamics against the US dollar, while gold and silver regained momentum amidst the shifting landscape.

Stock Market Updates

The stock market closed with mixed results as the Nasdaq Composite sustained its longest losing streak since October 2022, sliding by 0.56% to 14,510.30. This decline reflects a broader trend, with the index losing nearly 4% since its closing on December 27. Conversely, the S&P 500 experienced a fourth consecutive day of declines, dropping by 0.34% to 4,688.68, while the Dow Jones Industrial Average managed a slight gain of 0.03% to close at 37,440.34. Mega-cap tech stocks like Apple faced substantial underperformance due to concerns over inflated valuations and uncertainty about the Federal Reserve’s potential rate cuts. Apple specifically saw a more than 5% decrease in stock value this week, further exacerbated by recent downgrades from Piper Sandler and Barclays.

Despite the recent market downturn, some analysts remain optimistic about the market’s long-term prospects. He downplays the significance of the recent pullback, considering it more of a statistical fluctuation rather than a substantial indicator of market direction. Suggesting the potential for the S&P 500 to reach around 5,000 by the year’s end, indicating a more than 6% upside from the current levels, highlighting his positive outlook amid the present market fluctuations.

Data by Bloomberg

On Thursday, the overall market experienced a slight dip of 0.34%. Among the sectors, Health Care saw a positive uptick of 0.46%, followed by Financials at 0.24% and Industrials at 0.10%. On the downside, Energy suffered the most with a significant decrease of 1.63%, while Consumer Discretionary, Communication Services, and Information Technology also faced notable declines of 0.97%, 0.69%, and 0.64%, respectively. Additionally, Consumer Staples, Real Estate, Utilities, and Materials all experienced minor decreases ranging from -0.15% to -0.33%.

Currency Market Updates

In the latest currency market updates, the US Dollar Index (DXY) showcased a fluctuating performance, hovering around 102.40 following a brief dip to 102.00. Investor caution before the release of crucial NFP figures boosted the dollar amidst mixed risk appetite trends. The positive ADP readings reinforced optimism for December Payrolls, aligning with a rebound in US stocks that revisited the 37700 zone according to the Dow Jones index. The dollar found support from market digestion of the somewhat hawkish tone in the FOMC Minutes and a robust ADP report, while weekly Initial Claims rose by 202K in the week to December 30.

Meanwhile, the EUR/USD pair recovered some ground, touching the 1.0970 zone, and encountering initial resistance despite German flash inflation figures revealing a 3.7% CPI rise in December. GBP/USD initially surged past 1.2700 on upbeat final Services PMI data for December but later retreated to around 1.2660. In contrast, the Japanese yen faced sustained selling pressure, propelling USD/JPY toward the 145.00 barrier amid increased risk appetite and rising US yields. AUD/USD experienced its fifth consecutive drop despite the absence of clear direction in the US dollar and positive readings from China’s Caixin Services PMI. The Canadian dollar, despite weakening, aimed for a retest of two-week highs against the USD ahead of the Canadian labor market report.

Amidst this dynamic landscape, Gold regained momentum, testing the $2040 region per troy ounce, while Silver bounced back from three-week lows, reclaiming the $23.00 per ounce mark despite recent downward trends. The currency market showcased a mix of trends, influenced by economic data, risk sentiment, and fluctuations in key commodities, defining the movement of major currency pairs and their relationship with the US dollar.

Picks of the Day Analysis
EUR/USD (4 Hours)

EUR/USD Rebounds as Bulls Test Resistance Amidst USD Indecision and Hawkish FOMC Minutes

EUR/USD showed signs of recovery, touching the 1.0970/75 level after a bearish streak. The US dollar lacked clear direction around 102.40 amidst three-week high US yields triggered by a hawkish FOMC tilt, hinting at potential rate reductions by 2024. German inflation figures bolstered the euro, suggesting the ECB might maintain interest rates longer. Meanwhile, a robust ADP report in December hinted at strong Nonfarm Payroll readings, further shaping market sentiments. Bullish momentum faced resistance, indicating a potential standoff in the ongoing currency tussle.

Chart EUR/USD by TradingView

On Thursday, the EUR/USD moved slightly higher and reached the middle band of the Bollinger Bands. Currently, the price moving around the middle band, suggesting a potential downward movement. Notably, the Relative Strength Index (RSI) maintains its position at 44, signaling a neutral but bearish outlook for this currency pair.

Resistance: 1.0980, 1.1068

Support: 1.0892, 1.0814

XAU/USD (4 Hours)

XAU/USD Holds Steady Around $2,040 Amidst Mixed US Data and Fed Meeting Minutes

XAU/USD maintained its position near $2,040 on Thursday after initial gains eased during the American session. The US Dollar faced slight pressure following a mix of US data and insights from the FOMC Meeting Minutes. Despite Fed Chair Jerome Powell’s mention of potential rate cuts, the Minutes didn’t unveil a clear timeline, hinting at a probable move in 2024. Concurrently, the ADP survey indicated robust job growth, surpassing expectations with 164K new positions and signaling alignment with pre-pandemic employment levels. With anticipation for Friday’s Nonfarm Payrolls (NFP) report projecting 170K new jobs, gold remains anchored amidst a landscape of nuanced economic signals.

Chart XAU/USD by TradingView

On Thursday, XAU/USD moved in consolidation and tried to reach the middle band of the Bollinger Bands. Currently, the price moving just below the middle band, suggesting a potential upward movement. The Relative Strength Index (RSI) stands at 44, signaling a neutral but bearish outlook for this pair.

Resistance: $2,050, $2,070

Support: $2,030, $2,009

Economic Data
CurrencyDataTime (GMT + 8)Forecast
CADEmployment Change21:3012.2K
CADUnemployment Rate21:305.9%
USDAverage Hourly Earnings m/m21:300.3%
USDNon-Farm Employment Change21:30168K
USDUnemployment Rate21:303.8%
USDISM Services PMI23:0052.5

Dividend Adjustment Notice – January 4, 2024

Dear Client,

Please note that the dividends of the following products will be adjusted accordingly. Index dividends will be executed separately through a balance statement directly to your trading account, and the comment will be in the following format “Div & Product Name & Net Volume ”.

Please refer to the table below for more details:

The above data is for reference only, please refer to the MT4/MT5 software for specific data.

If you’d like more information, please don’t hesitate to contact info@vtmarkets.com.

Gold Trading Strategies: Explore The Methods in Gold Market

Gold Trading: Discovering The Different Strategies

Gold, often referred to as the “yellow metal,” has an enduring allure that spans centuries. Its shimmering beauty and timeless value make it a prized asset for investors worldwide.  

But how can you make the most of your investment in gold? The key lies in having a strategic approach, and that’s precisely what we’ll explore in this article. 

We’ll delve into the world of gold trading strategies, with a focus on three distinct approaches: day trading, swing trading, and long-term investing. 

 Each strategy has its unique characteristics, advantages, and challenges. By the end of this journey, you’ll have a clearer understanding of which path aligns with your financial goals. 

Day Trading Gold

Let’s kick things off with day trading, a strategy that demands quick thinking, sharp analysis, and a taste for fast-paced action.  

Day trading revolves around the concept of buying and selling gold within the same trading day. The objective is to profit from short-term price fluctuations. 

#1. Tools of the Trade 

To embark on your day trading adventure, you’ll need the right tools in your arsenal. They come with: 

Dive into the depths of candlestick patterns, as they reveal crucial insights into price movements. 

#2. Day Trading Strategies 

1. Scalping for Quick Profits: 

Scalpers aim to make numerous small trades throughout the day, each capturing minor price movements. The goal is to accumulate these small gains into a significant profit. 

2. Breakout Trading in Intraday Sessions:

Breakout traders closely watch support and resistance levels. When gold prices break through these key levels, it signals a potential trend reversal or acceleration, making it an opportune moment to trade. 

3. Risk Management in Day Trading:

Day trading can be exhilarating, but it’s not without risks. Establish a risk management strategy that includes setting stop-loss orders to limit potential losses. 

Pros and Cons

  • Advantages of Day Trading Gold:

Quick profits, no overnight risk exposure, and the excitement of rapid trading. 

  • Challenges and Risks:

High stress, the potential for significant losses, and the need for constant attention to the markets. 

Swing Trading Gold

If the fast-paced nature of day trading seems overwhelming, swing trading may be a more suitable option.  

Swing trading involves holding gold for a few days to weeks to capture short to medium-term price swings. It combines elements of both technical and fundamental analysis. 

Identifying Swing Trading Opportunities

Spotting opportunities in swing trading requires a keen eye for trends and reversals.  

Analyze charts and use tools like moving averages to identify potential entry and exit points.  

Support and resistance levels are your guideposts to navigate the market’s twists and turns. 

Building a Swing Trading Strategy

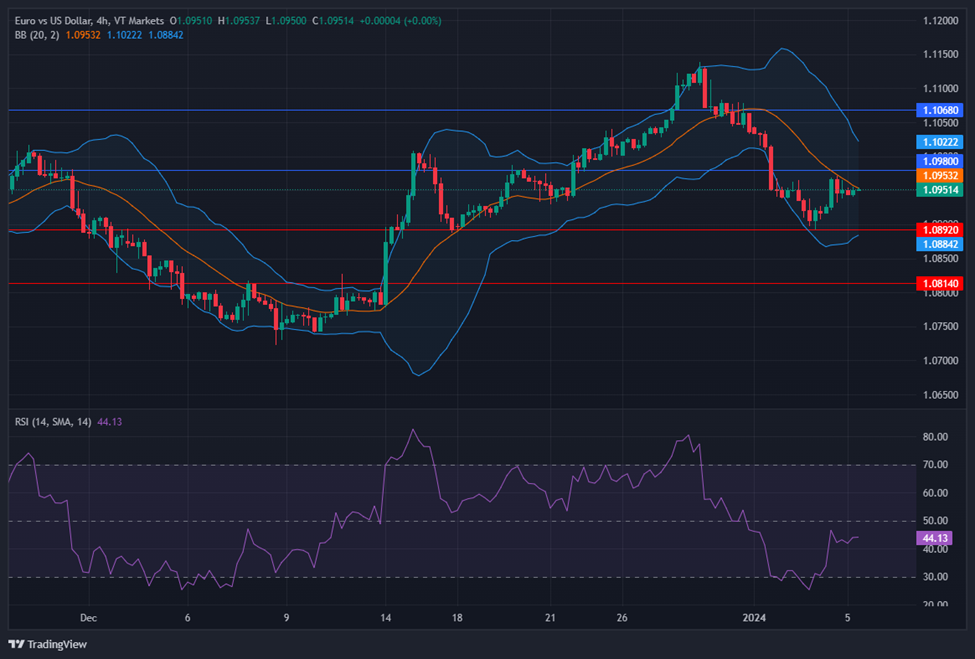
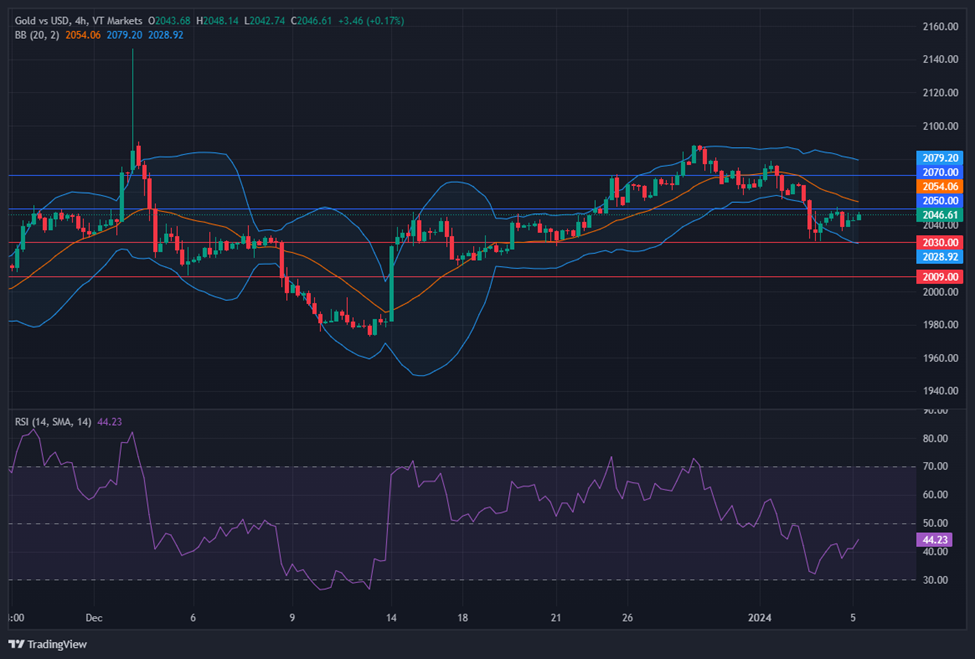
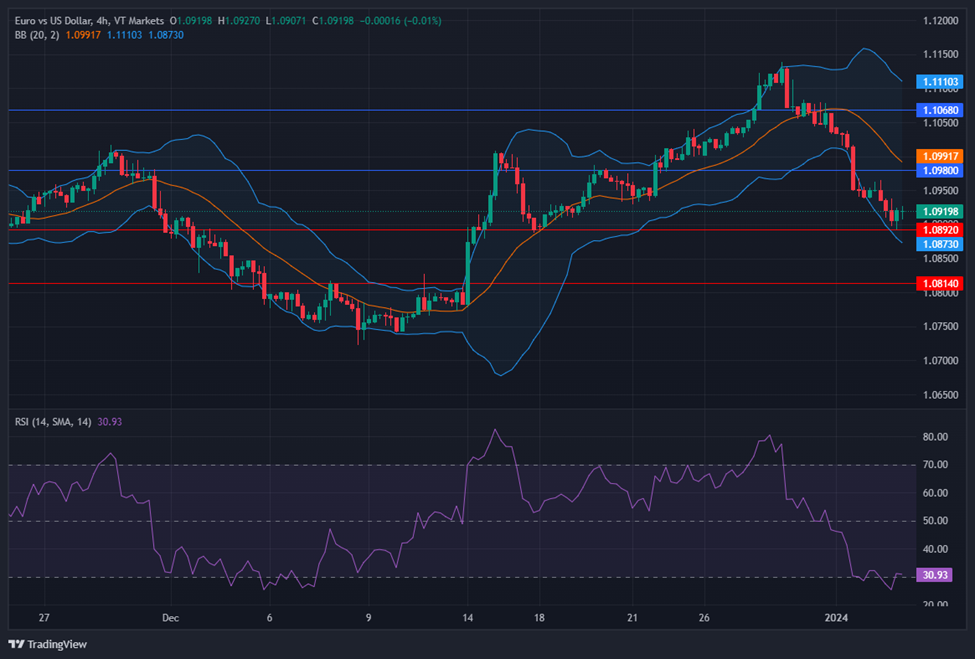
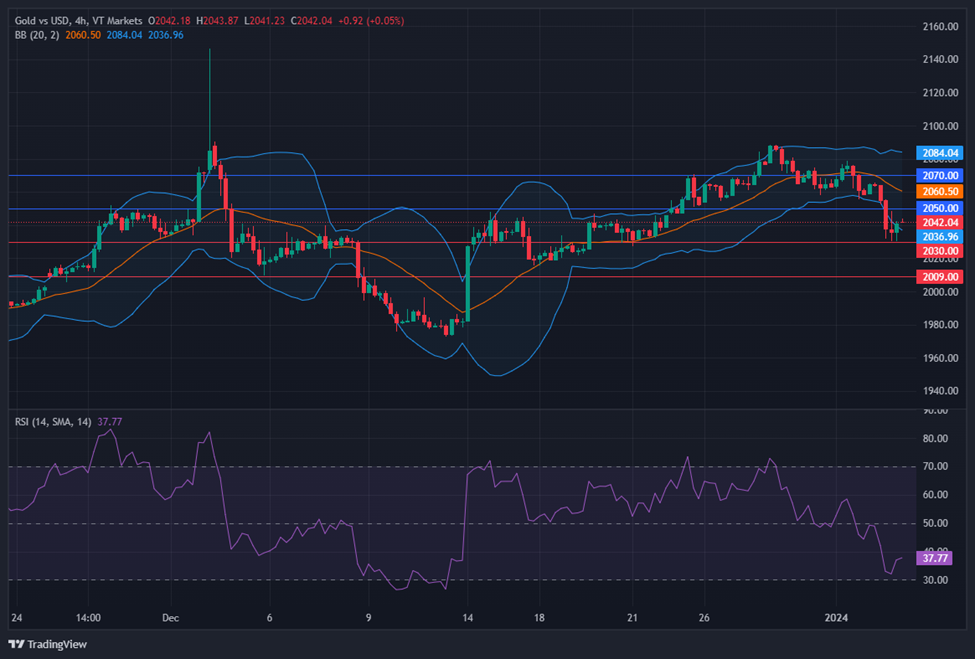
1. The 4-Hour Chart Approach:

Many swing traders find success by using the 4-hour chart as their primary timeframe. This provides a balance between short-term and long-term trends. 

2. Combining Indicators for Confirmation:

To enhance the accuracy of your trades, consider using multiple technical indicators. Popular choices include the Relative Strength Index (RSI) and the Moving Average Convergence Divergence (MACD). 

3. Position Sizing and Risk Management:

Determine the size of your positions based on your risk tolerance and overall portfolio. Setting stop-loss and take-profit levels is crucial to manage risk effectively. 

Advantages and Limitations 

  • Benefits of Swing Trading Gold:

Offers a more relaxed pace compared to day trading, potential for significant gains, and less stress. 

  • Potential Drawbacks:

Requires patience to wait for the right opportunities, overnight risk exposure, and ongoing market analysis. 

Long-Term Investing in Gold

If you prefer a more hands-off approach to gold trading, long-term investing might be your ideal strategy.  

It involves buying and holding gold for an extended period, often years, with the expectation that its value will appreciate over time. 

#1. Fundamental Analysis

Fundamental analysis takes center stage in long-term investing.  

Dive into macroeconomic factors, such as interest rates, inflation rates, and geopolitical events, to make informed decisions. These factors can significantly impact gold prices over the long haul. 

#2. Risk Mitigation in Long-Term Investing

1. Diversification within Your Portfolio:  

While gold can be a reliable asset, it’s essential to diversify your portfolio to spread risk. Combine gold with other investments like stocks and bonds. 

2. Staying Patient Through Market Fluctuations:  

Gold prices can experience significant fluctuations over time. Staying patient during market downturns is crucial to realizing long-term gains. 

3. When to Consider Exiting:  

Define your exit strategy before entering a long-term gold investment. Consider factors like your financial goals, changes in your risk tolerance, and evolving market conditions. 

The Pros and Cons of Long-Term Gold Investing

  • Advantages:

Stability, wealth preservation, and the potential for significant long-term returns. 

  • Challenges:

Requires a long-term commitment, potential for slower returns compared to short-term trading, and exposure to long-term market uncertainties. 

Navigating Gold Trading with VT Markets: Your Strategy for Success

In the dynamic world of gold trading, aligning knowledge with the right strategy is crucial. With VT Markets, whether you prefer the rapid pace of day trading, the measured rhythm of swing trading, or the steady course of long-term investing, you’ll find a platform that supports your aspirations.

Day trading with VT Markets offers the thrill of quick profits, though it requires undivided attention. Swing trading strikes a balance, yielding short to medium-term gains. For those seeking stability and wealth preservation, long-term investing through VT Markets provides a reliable path, though patience is key.

Embark on your gold trading journey with VT Markets, where each strategy aligns with your financial goals and risk appetite. From the rush of day trading to the strategic depth of swing trading, or the enduring approach of long-term investing, your path to gold market success starts here. Explore, engage, and trade confidently with VT Markets. Happy trading!

Tech-Led Nasdaq Downturn Sparks Market Jitters: Fed Uncertainty and Dollar Strength Unsettle Investors

The stock market opened the year with the Nasdaq Composite facing significant losses, marking a 1.18% decrease following the tech giants’ downturn, influenced by Apple’s nearly 4% drop. This decline, paired with the S&P 500 and Dow Jones slipping, reflected a broader tech sell-off. The uncertainty surrounding the Federal Reserve’s rate cut plans triggered this market sentiment, driving the US Dollar Index to a three-week high of around 102.70. While analysts suggest a long-term bullish outlook despite the correction, the Fed’s cautious approach and speculation of rate cuts in 2023 continued to unsettle investors, impacting currency and precious metal markets as the dollar surged further.

Stock Market Updates

The stock market kicked off the year on a rough note, with the Nasdaq Composite leading the downturn. It faced a second consecutive session of losses, closing at 14,592.21, marking a 1.18% decrease. This decline followed the index’s worst day since October, influenced by major tech stocks like Apple, which experienced a nearly 4% drop after a downgrade from Barclays. The S&P 500 slipped by 0.80%, while the Dow Jones Industrial Average slid 0.76%, closing at 4,704.81 and 37,430.19 points, respectively. This downward trend was mirrored by tech giants like Nvidia, Tesla, and Meta, further affected by the U.S. 10-year Treasury yield briefly surpassing the 4% mark, settling around 3.91%. The market sentiment appeared to shift due to uncertainties surrounding the Federal Reserve’s rate cut plans resulting in a sell-off of last year’s high-flying tech winners.

Despite the short-term pessimism, some analysts maintain a long-term bullish outlook, highlighting the current market correction as part of the natural cycle, especially after the remarkable highs of the previous year. However, the release of the Fed’s meeting minutes reinforced the uncertainty, indicating the central bank’s cautious approach to policy changes and the expectation of three-quarter-percentage point cuts sometime during the year. Last year’s market performance, with the S&P 500 surging over 24% and the Nasdaq climbing 43%, marked a substantial rebound from the challenges of 2022 but set the stage for a more cautious and uncertain beginning to the new year.

Data by Bloomberg

On Wednesday, across all sectors, the market experienced a general decline of 0.80%. Energy and utilities saw modest gains, with energy rising by 1.52% and utilities by 0.39%. Communication services and health care showed slight positive movements of 0.10% and -0.14%, respectively. However, the majority of sectors faced losses: consumer staples (-0.71%), financials (-0.81%), information technology (-1.02%), materials (-1.11%), industrials (-1.51%), consumer discretionary (-1.88%), and real estate (-2.35%). The day marked a mixed performance with select sectors in the positive but a notable downturn in most others.

Currency Market Updates

The currency market experienced notable movements amid a strengthening US Dollar Index (DXY), which surged to a three-week high of around 102.70. This uptrend was propelled by persistent risk aversion in the market and a concurrent increase in US yields across various maturities, reinforcing a bullish sentiment around the dollar. The EUR/USD pair dipped below the 1.0900 mark for the first time since mid-December, reflecting the greenback’s strength and broader weakness in risky assets. Meanwhile, GBP/USD bucked the trend, reclaiming ground above 1.2600 after enduring three consecutive sessions of losses. The USD/JPY pair climbed to approximately 143.70 due to the ongoing uptrend in US yields and a lack of direction in Japan’s JGB 10-year yields. Additionally, AUD/USD faced continued pressure, sliding for the fourth consecutive session amid overall bearish sentiment in high-beta currencies and the commodity complex.

Amidst these fluctuations, the Canadian dollar weakened for the fifth consecutive session, propelling USD/CAD to a two-week high near the 1.3370 zone. The surge in the greenback and US yields impacted precious metals negatively, driving gold prices to multi-day lows around $2030 per ounce and causing silver to breach the $23.00 mark per ounce, reaching a new two-week low. The absence of impactful revelations in the FOMC Minutes sustained the positive momentum for the US Dollar, despite the committee’s indication that rates might reach their peak cycle soon and projections hinting at a potential rate reduction by 2024, a move already anticipated by the market. Some members expressed the possibility of maintaining the policy rate at its current level for an extended period beyond initial expectations, contributing to the ongoing dollar strength.

Picks of the Day Analysis
EUR/USD (4 Hours)

EUR/USD Dips Below 1.0900 Amidst Resilient USD Strength: Weekly Insights

Throughout the week, the EUR/USD maintained a bearish trajectory, extending its decline below the 1.0900 mark due to a robust US dollar surge, driven by a resurgence in the USD Index to three-week highs around 102.70/75. Despite a positive German job report, the euro struggled against the dollar’s dominance, remaining susceptible to US economic dynamics. Factors contributing to the dollar’s strength included a recovering US yield curve, lower-than-expected JOLTs Job Openings, and surprising upward movement in the ISM Manufacturing PMI. The absence of new information from the FOMC Minutes, which hinted at a potential slowing of interest rate hikes, coupled with remarks from Richmond Fed’s T. Barkin supporting a soft landing for the US economy, further bolstered the greenback’s position midweek.

Chart EUR/USD by TradingView

On Wednesday, the EUR/USD moved lower creating a lower push to the lower band of the Bollinger Bands. Currently, the price moving slightly above the lower band, suggesting a potential upward movement. Notably, the Relative Strength Index (RSI) maintains its position at 30, signaling a bearish outlook for this currency pair.

Resistance: 1.0980, 1.1068

Support: 1.0892, 1.0814

XAU/USD (4 Hours)

XAU/USD Slides Amid USD Strength: FOMC Minutes Awaited for Fed’s Rate Cut Signals

XAU/USD experienced a continued decline, hovering near $2,031.20 during the mid-US afternoon as the US Dollar maintained its upward momentum against major currencies. The boost in the USD stemmed from positive US news, including a better-than-expected ISM Manufacturing PMI and steady job openings reported by the BLS. These indicators hint at a stabilizing labor market, influencing the Federal Reserve’s stance. As the market anticipates the FOMC Minutes, expected to offer insights into rate cut discussions and potential timing, traders await cues on the Fed’s trajectory, currently pricing in a potential rate cut by May.

Chart XAU/USD by TradingView

On Wednesday, XAU/USD moved lower and reached the lower band of the Bollinger Bands. Currently, the price moving just above the lower band, suggesting a potential upward movement. The Relative Strength Index (RSI) stands at 37, signaling a bearish outlook for this pair.

Resistance: $2,050, $2,070

Support: $2,030, $2,009

Economic Data
CurrencyDataTime (GMT + 8)Forecast
EURGerman Prelim CPI m/mAll Day0.2%
USDADP Non-Farm Employment Change21:15120K
USDUnemployment Claims21:30217K

Modifications on All Shares – January 3, 2024

Dear Client,

To provide a favorable trading environment to our clients, VT Markets will modify the trading setting of all share CFDs on Jan 8 , 2024:

1. All US Shares products leverage will be adjusted to 20:1 .

2. MT5 All Shares products: New positions opened within 30 minutes before market closing and after market opening will start with leverage of 5:1 . After the mentioned period, the leverage will be resumed to original leverage and will not be adjusted back to 5:1 .

The above data is for reference only; please refer to the MT4 and MT5 software for specific data.

Friendly reminders:

1. All specifications for Shares CFD stay the same except leverage during the mentioned period.

2. The margin requirement of the trade may be affected by this adjustment. Please make sure the funds in your account are sufficient to hold the position before this adjustment.

If you’d like more information, please don’t hesitate to contact info@vtmarkets.com.

Dividend Adjustment Notice – January 3, 2024

Dear Client,

Please note that the dividends of the following products will be adjusted accordingly. Index dividends will be executed separately through a balance statement directly to your trading account, and the comment will be in the following format “Div & Product Name & Net Volume ”.

Please refer to the table below for more details:

The above data is for reference only, please refer to the MT4/MT5 software for specific data.

If you’d like more information, please don’t hesitate to contact info@vtmarkets.com.

Slight Bearish Start to 2024 Amid Tech Leader Struggles and Defensive Stocks’ Rise

The new year began with a mild downturn in the stock market, seeing the S&P 500 drop by 0.57% after an impressive 2023. Tech giants like Apple faced setbacks, while defensive stocks supported the Dow Jones. Despite this, the market enjoyed a bullish run in 2023 due to a strong economy and Fed signals. Analysts maintain optimism, anticipating a potential rebound during the earnings season. In currency markets, the dollar rebounded by 0.8% after a dovish Fed stance, influencing various pairs like EUR/USD and USD/JPY. The focus shifts to upcoming U.S. economic indicators and FOMC minutes for insights into potential market shifts.

Stock Market Updates

The stock market kicked off the new year on a slightly bearish note, with the S&P 500 falling by 0.57%, marking its first decline after a strong 2023. The Nasdaq Composite experienced its worst day since October, dropping by 1.63%, while the Dow Jones Industrial Average managed a slight gain of 0.07%. Apple faced a significant setback, sliding over 3% due to a downgrade from Barclays, impacting the performance of the Magnificent Seven market leaders basket. However, defensive stocks like Johnson & Johnson and Merck supported the Dow’s positive momentum.

In 2023, the stock market saw a remarkable surge, with the S&P 500 climbing for nine consecutive weeks, ending the year on a high note—its best streak since 2004. The bullish run was fueled by a resilient economy, cooled inflation, the Federal Reserve signaling an end to rate hikes, and an anticipation of future rate cuts. Tech giants like Apple, Microsoft, and Nvidia led the charge, with the Nasdaq Composite registering its best year since 2020. Despite the initial decline in the new year, analysts like Hatfield remain optimistic about equities, foreseeing a potential rebound during the upcoming earnings season.

Data by Bloomberg

On Tuesday, across all sectors, the market experienced a slight decline of 0.57%. Health Care, Utilities, and Energy sectors showed positive gains, with Health Care leading at +1.76%, followed by Utilities at +1.38% and Energy at +1.19%. Conversely, Information Technology took a significant hit, dropping by -2.58%. Sectors like Consumer Discretionary, Communication Services, and Industrials also experienced declines ranging from -0.91% to -0.95%. Meanwhile, Financials and Real Estate showed modest gains, while Materials faced a small decrease of -0.20%.

Currency Market Updates

The currency markets witnessed a resurgence of the dollar index by 0.8% following profit-taking on short trades that ensued after a more dovish stance from the Fed in mid-December. This unexpected turn led to a tumble in Treasury yields and rate expectations, prompting a surge in risk-taking behavior. The focus now hovers around the upcoming key U.S. labor market data, ISM releases, and the scrutiny of FOMC meeting minutes as market participants gauge the impact of these factors on the dollar’s recent slide and the potential for a reversal.

EUR/USD experienced an 0.82% decline, approaching the 50% retracement level of December’s surge, while USD/JPY rose 0.8%, seeking to breach resistance around 142 to push towards 143. Sterling mirrored the pressures faced by EUR/USD, dropping by 0.77%, largely influenced by lagging gilt treasury yield spreads. Concurrently, USD/CAD ascended by 0.63%, propelled by Canada’s PMI hitting a 3-1/2-year low at 45.4. Market sentiment hinges on upcoming crucial U.S. economic indicators that are expected to confirm a cooling labor market with receding inflationary pressures, yet still shy of the Fed’s 2% target. The interplay of these data releases will likely shape the trajectory of major currency pairs in the coming days.

Picks of the Day Analysis
EUR/USD (4 Hours)

EUR/USD Declines as Dollar Gains Ground Amidst Economic Contractions

The EUR/USD pair experienced a significant downturn, touching lows of 1.0940 amidst a stronger US Dollar driven by a gloomy market sentiment due to persistent economic contraction signals at the close of 2023. S&P Global’s released PMI data for both the Eurozone and the US showcased a slight improvement in the EU’s manufacturing index while the US saw a contraction, aligning with a risk-averse atmosphere that pushed stocks downward and lifted Treasury yields. Eyes are now on upcoming data, particularly the December US ISM Manufacturing PMI and FOMC Meeting Minutes, as Chairman Jerome Powell hinted at potential rate cuts, prompting curiosity about policymakers’ official discussions.

Chart EUR/USD by TradingView

On Tuesday, the EUR/USD moved lower and reached the lower band of the Bollinger Bands. Currently, the price moving slightly above the lower band, suggesting a potential upward movement. Notably, the Relative Strength Index (RSI) maintains its position at 32, signaling a bearish outlook for this currency pair.

Resistance: 1.0980, 1.1068

Support: 1.0892, 1.0814

XAU/USD (4 Hours)

XAU/USD Holds Steady Amidst Market Caution and Dollar Strength

Spot Gold maintained a steady stance, lingering around its daily opening without a definitive trajectory, recuperating slightly from an intraday dip to $2,055.82. The US Dollar gained traction throughout the European trading session, bolstered by Wall Street’s subdued performance. Investor apprehension loomed after the long weekend, accentuated by the forthcoming pivotal US employment data and a lineup of significant economic indicators. The sentiment downturn followed the disappointing US S&P Global Manufacturing PMI, overshadowing the better-than-expected European Manufacturing PMIs. This cautionary atmosphere was compounded by US stocks dipping and government bond yields edging upwards, indicating renewed market apprehension regarding projected rate cuts across major economies. Eyes remain fixed on the imminent US employment reports and upcoming European inflation updates, shaping the short-term technical outlook for XAU/USD.

Chart XAU/USD by TradingView

On Tuesday, XAU/USD moved lower and reached the lower band of the Bollinger Bands. Currently, the price moving just above the lower band, suggesting a potential upward movement. The Relative Strength Index (RSI) stands at 46, signaling a neutral outlook for this pair.

Resistance: $2,070, $2,090

Support: $2,048, $2,024

Economic Data
CurrencyDataTime (GMT + 8)Forecast
USDISM Manufacturing PMI23:0047.2
USDJOLTS Job Openings23:008.84M

What Is Leverage & How Can You Use It With VT Markets

Understanding Forex Leverage & The Benefits

Within the Forex market, leverage is a strategy that holds significant sway, offering a potent tool for amplifying potential gains. Whether it’s a trader’s first or 100th day within the Forex market, understanding leverage is paramount to navigating the markets effectively.

VT Market is a multi-asset broker that specialises in catering to the needs of Forex traders. With leverage up to 500:1, traders have great flexibility in terms of market exposure. This article aims to discuss the concept of leverage, particularly the offerings provided by VT Markets, and provide insightful strategies for its effective use.

What is leverage, and how can it be used with VT Markets?

Leverage is the ability to control a larger position in the market with a relatively smaller amount of capital. It acts as a multiplier, enabling traders to potentially magnify both profits and losses. While leverage is a strategy that traders of all levels can adopt, beginner traders with little capital may find it particularly useful, as they are able to open larger positions with small budgets. 

VT Markets recognises the power of leverage and provides traders with the tools to harness this potential strategically, offering a ratio of up to 500:1. The broker also offers competitive leverage ratios that vary across different asset classes, from forex to indices, precious metals and energies. 

Five strategies for using leverage effectively and strategically

Leverage is a double-edged sword, one that traders must learn how to balance to unlock online financial success. VT Markets encourages traders to assess their risk appetite and only employ leverage in a manner that is consistent with their comfort level. 

  • Asset diversification

Rather than concentrating leverage on a single trade, traders can spread their exposure across multiple assets. VT Markets provides a diverse range of trading instruments, enabling traders to diversify their portfolios strategically. It’s important for traders to select assets that align with their trading style and strategy to prevent major losses. 

  • Utilising risk management tools 

Among the educational resources and tools offered by VT Markets, the broker also offers risk management tools such as stop-loss orders. Traders can use these tools to define predetermined levels at which a position will be automatically closed, helping to mitigate potential losses.

  • Ongoing market monitoring

In a market that never sleeps, vigilance is key. Traders must stay informed about market developments, economic indicators and geopolitical events that may impact their trades. VT Markets provides real-time market data to facilitate informed decision-making and support traders as they learn to navigate the market. 

  • Establish realistic targets 

As leverage allows traders to aim for larger profits, setting realistic profit targets is crucial, particularly for traders new to the market. VT Markets emphasises the importance of aligning profit expectations with market conditions and the chosen leverage ratio for responsible trading.

  • Exercise patience in position sizing 

Rather than succumbing to the temptation of maximising every opportunity, traders may want to consider a more measured approach to position sizing. This not only aligns with risk management principles but also allows for a more sustainable and controlled use of leverage. 

  • Pursue educational resources 

Like any aspect of online markets, there is a lot to learn with leverage trading, so traders are encouraged to delve into educational resources provided by the VT Markets platform, such as webinars, blog posts, tutorials and market analyses, to enhance their understanding of leverage dynamics. 

By taking the time to immerse themselves in the wealth of knowledge provided by VT Markets, traders can only expect to further enhance their skill set. Traders can then try their hand at leverage by using leading Forex platforms, such as MetaTrader 4 (MT4) or MetaTrader 5 (MT5).

Discover the true potential of leverage with VT Markets

The power of leverage, when combined with precision and informed decision-making, becomes a transformative force. VT Markets remains committed to providing traders with the knowledge, tools and support to harness leverage effectively. 

The broker empowers traders to navigate the markets strategically by providing diverse assets, risk management tools and flexible leverage ratios. With this, traders can feel more bold when developing their trading strategies. 

VT Markets has simplified the trading experience, from its user-friendly interface to its revolutionary trading app. Joining the VT Markets platform can be achieved in three steps: create an account, link a preferred payment method and select an asset to begin trading. 

About VT Markets

VT Markets is a regulated multi-asset broker with a presence in over 160 countries. The broker has won many international accolades, including Best Multi-Asset Broker and Fastest Growing Broker. Its mission is to make trading an easy, accessible and seamless experience for everyone.

For more information, please visit www.vtmarkets.net or email info@vtmarkets.com.

Back To Top
server

Hello there 👋

How can I help you?

Chat with our team instantly

Live Chat

Start a live conversation through...

  • Telegram
    hold On hold
  • Coming Soon...

Hello there 👋

How can I help you?

telegram

Scan the QR code with your smartphone to start a chat with us, or click here.

Don’t have the Telegram App or Desktop installed? Use Web Telegram instead.

QR code