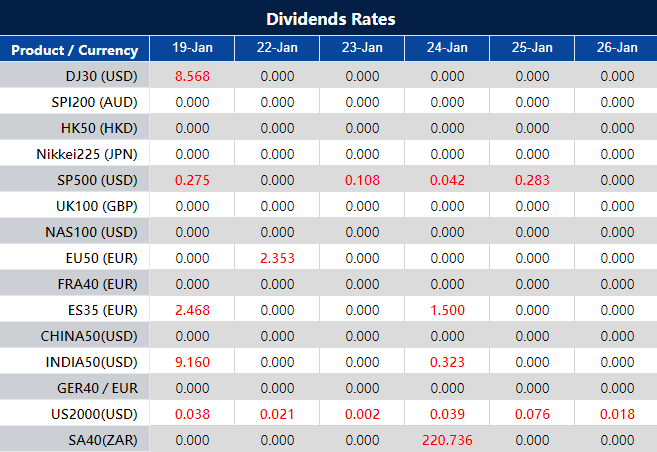
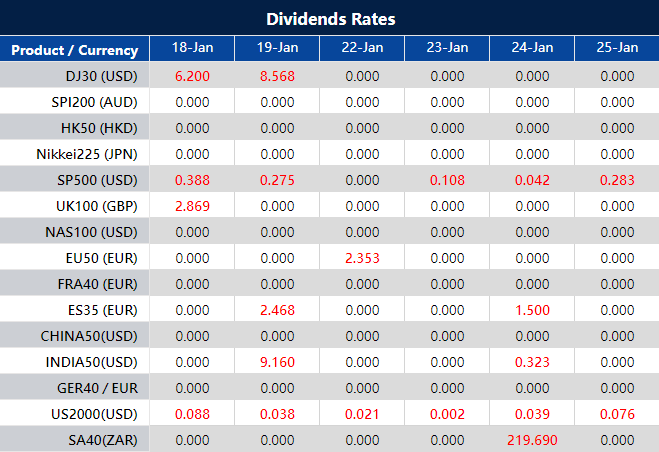
Please note that the dividends of the following products will be adjusted accordingly. Index dividends will be executed separately through a balance statement directly to your trading account, and the comment will be in the following format “Div & Product Name & Net Volume ”.
Please refer to the table below for more details:
The above data is for reference only, please refer to the MT4/MT5 software for specific data.
If you’d like more information, please don’t hesitate to contact info@vtmarkets.com.
On Thursday, a positive turnaround in the stock market was driven by strong performances from tech companies, notably Apple, following a buy rating upgrade from Bank of America. The Dow Jones Industrial Average gained 201.94 points, the Nasdaq surged by 1.35%, and the S&P 500 climbed 0.88%. The 10-year Treasury yield rose to 4.14% amid tight labor market conditions, leading to concerns about fewer expected rate cuts by the Federal Reserve. In currency markets, the USD index rebounded, affecting pairs like EUR/USD and USD/JPY. GBP/USD held gains, supported by robust UK data. Commodity-centric currencies rose, while Bitcoin declined 2.75% due to higher global yields, contrasting its recent high on January 11.
Stock Market Updates
On Thursday, the stock market experienced a positive turnaround, with tech companies, particularly Apple, leading the way. The Dow Jones Industrial Average rebounded from an earlier loss, gaining 201.94 points or 0.54%, closing at 37,468.61. The Nasdaq Composite surged by 1.35%, reaching 15,055.65, while the S&P 500 climbed 0.88% to end at 4,780.94, just 0.33% away from its closing record. Apple’s shares saw a significant increase of around 3.3% after Bank of America upgraded the stock to a buy rating, predicting over 20% upside over the next 12 months. Other tech-related stocks, such as Taiwan Semiconductor Manufacturing Co., also contributed to the positive momentum, with the VanEck Semiconductor ETF reaching an all-time high, boosted by strong earnings and revenue results.
Additionally, the 10-year Treasury yield rose to 4.14% as fresh jobs data indicated tightness in the labor market, with first-time unemployment insurance filings coming in at 187,000 for the week ended Jan. 13. This stronger-than-expected labor market, combined with robust consumer spending, has raised concerns among investors about potential fewer rate cuts from the Federal Reserve than anticipated. The market is currently pricing in a roughly 56% chance of a quarter percentage point rate cut in March, according to the CME FedWatch Tool. Atlanta Fed President Raphael Bostic’s statement that he expects the central bank to start reducing rates in the third quarter contributed to the market’s uncertainty, as it deviates from the market’s expectations for a faster rate cut.
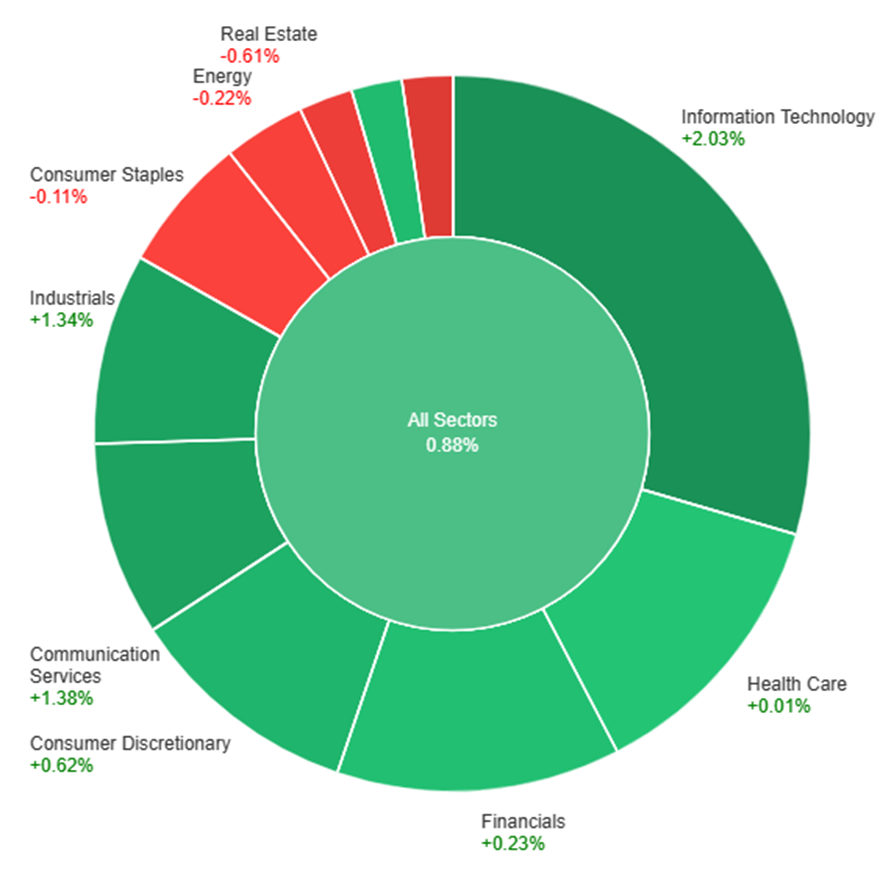
On Thursday, the overall market showed positive performance with a gain of 0.88%. The Information Technology sector led the way with a notable increase of 2.03%, followed by Communication Services and Industrials, which rose by 1.38% and 1.34%, respectively. Consumer Discretionary and Materials also saw modest gains at 0.62% and 0.39%. However, some sectors experienced declines, including Consumer Staples (-0.11%), Energy (-0.22%), Real Estate (-0.61%), and Utilities (-1.05%). Health Care showed minimal movement with a marginal increase of 0.01%. Overall, the day reflected a mixed performance across various sectors in the market.
Currency Market Updates
In the currency markets, the USD index rebounded from early lows during the North American trading session, gaining 0.23% in the U.S. afternoon. The surge came after jobless claims data came in below expectations, reducing the likelihood of a March rate cut by the Federal Reserve to 60%. This development suggested that the U.S. economy might not be slowing as initially thought. Meanwhile, the EUR/USD pair fell by 0.22% to 1.0858, with traders closely monitoring declining eurozone growth. USD/JPY reversed its overnight low-yield-related weakness, rising to 148.30 after the positive claims data, although it fell short of breaking Wednesday’s high of 148.53. Traders adopted a defensive stance ahead of Japan’s CPI release on Friday, lightening recent long positions in anticipation, even though expectations for the data prompting a shift to higher rates by the Bank of Japan remained low.
In contrast, GBP/USD held a slight gain, increasing by 0.14% to 1.2692 during New York afternoon trading. Despite facing resistance around the 1.27 level, the inability of bears to build on gains above this threshold hinted at an underlying bid near 1.26. The diminished expectations of a Fed rate cut were underscored by UK data, including Wednesday’s CPI, which exceeded forecasts, indicating that the Bank of England was unlikely to pivot to rate cuts in the near term. Other currency pairs, such as AUD/USD, rose by 0.15% to 0.6561, while USD/CAD remained flat at 1.3504. The latter was supported by rising oil and copper prices, benefiting commodity-centric currencies. In the cryptocurrency space, Bitcoin experienced a 2.75% decline, reaching a new one-month low at $41.3k, following its 21-month high at $49k on January 11. The dip in Bitcoin’s value was attributed to higher global yields, which did not bode well for crypto holders despite the coin being only down 1% year-to-date.
Picks of the Day Analysis
EUR/USD (4 Hours)
EUR/USD Holds Near Year-to-Date Lows as Greenback Gains Momentum Amidst Robust US Economic Indicators and Fed Uncertainty
On Thursday, the EUR/USD pair maintained a selling bias, settling around year-to-date lows near 1.0840 before experiencing a slight recovery. The uptrend in the US dollar was fueled by strong labor market results and a rebound in the Philly Fed Manufacturing Index. The USD Index (DXY) retained its bullish stance, supported by comments from Atlanta Fed President R. Bostic, hinting at potential rate cuts before July if inflation slows more rapidly than anticipated. Despite a baseline plan for rate reductions in the third quarter, caution is emphasized to avoid premature cuts. The market currently places a 55% probability of a Fed rate cut in March.
Meanwhile, ECB President C. Lagarde hinted at possible rate reductions in the summer. As US yields retreated slightly on the short end, German 10-year bund yields rose beyond 2.30%.
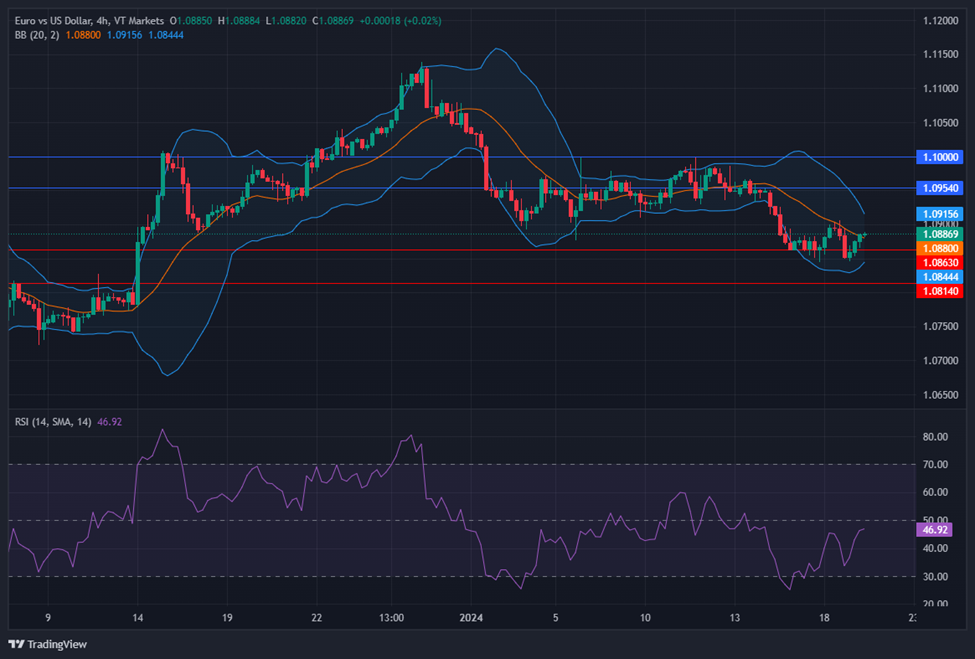
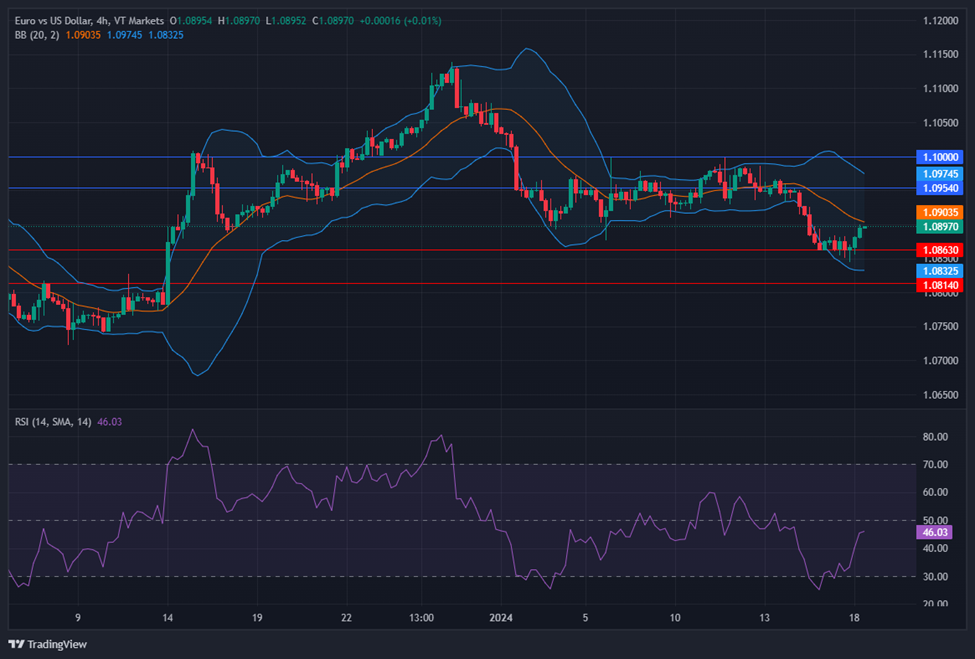
On Thursday, the EUR/USD moved slightly higher, able to reach the middle band of the Bollinger Bands. Currently, the price moving just above the middle band, suggesting a potential upward movement to reach the upper band. Notably, the Relative Strength Index (RSI) maintains its position at 46, signaling a neutral outlook for this currency pair.
Resistance: 1.0954, 1.1000
Support: 1.0863, 1.0814
XAU/USD (4 Hours)
XAU/USD Stabilizes Above $2,000 Amid Economic Uncertainties and Mixed Data
Gold (XAU/USD) has found a foothold around $2,015 per troy ounce after hitting a multi-week low of $2,001.68 earlier in the week. The precious metal rebounded as market sentiment improved slightly, countering the impact of a positive US Dollar driven by concerns over the housing sector and lackluster growth-related data. Despite initial pessimism from Asian shares, optimism grew on Wall Street with better-than-expected US data, including housing starts, building permits, and lower-than-anticipated jobless claims. Federal Reserve officials provided no fresh insights into future monetary policy, leaving investors navigating a landscape of economic uncertainties.
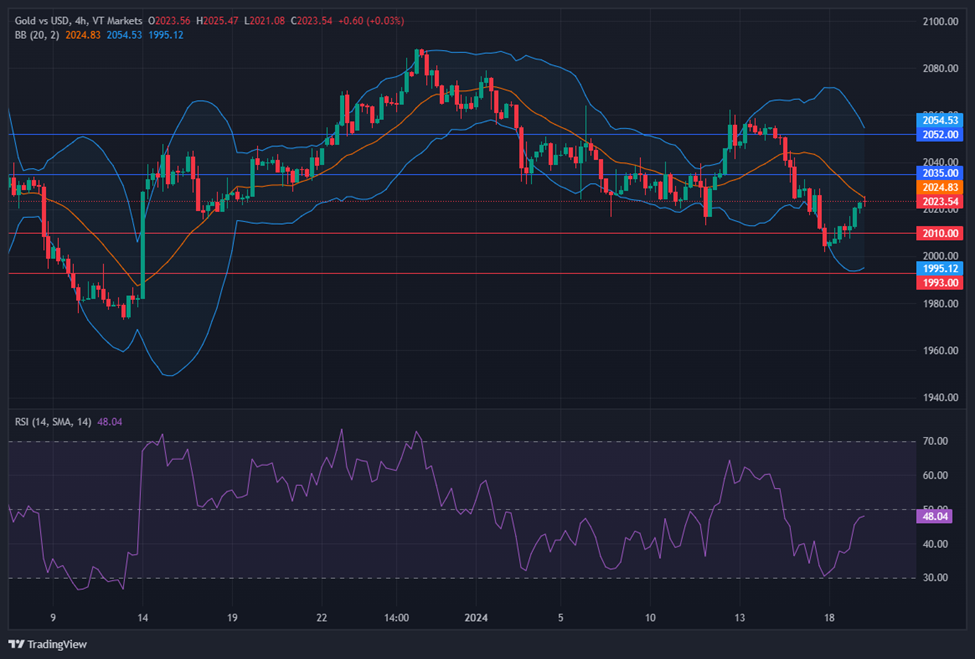
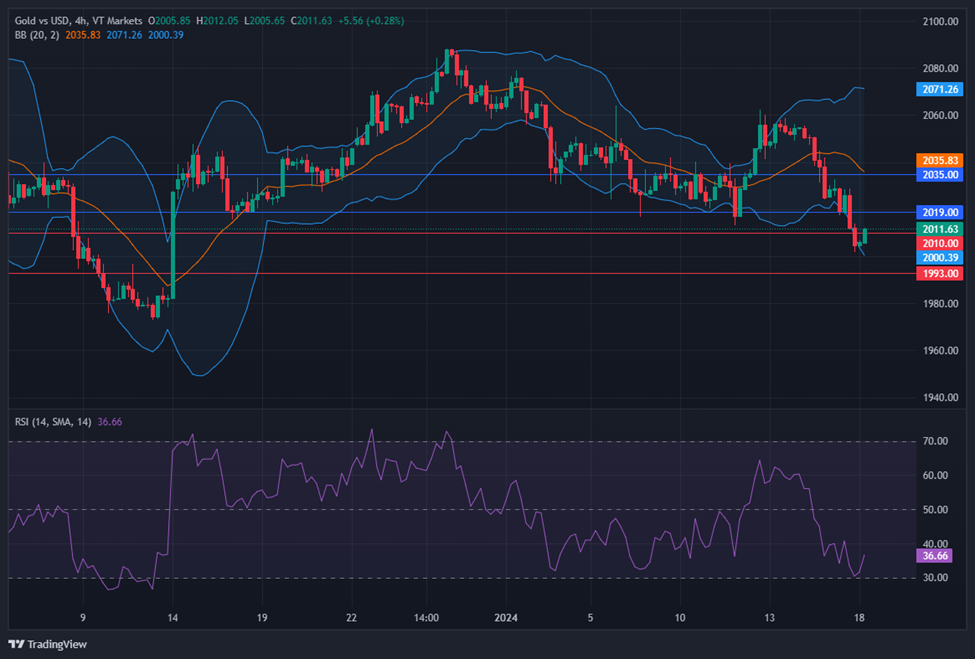
On Thursday, XAU/USD moved higher and reached the middle band of the Bollinger Bands. Currently, the price moving just below the middle band suggesting a potential upward movement to reach above the middle band. The Relative Strength Index (RSI) stands at 48, signaling a neutral outlook for this pair.
As part of our commitment to provide the most reliable service to our clients, there will be server maintenance this weekend.
Maintenance Hours :
20th of January 2024 (Saturday) 02:00-00:00 (GMT+2)
Please note that the following aspects might be affected during the maintenance:
1. The price quote and trading management will be temporarily disabled on MT5 during the maintenance. You will not be able to open new positions, close open positions, or make any adjustments to the trades.
2. There might be a gap between the original price and the price after maintenance. The gaps between Pending Orders, Stop Loss and Take Profit will be filled at the market price once the maintenance is completed. If you don’t want to hold any open positions during the maintenance, it is suggested to close the position in advance.
3. Please refer to MT5 for the latest update on the completion and market opening time. Our services will be back online once the maintenance is completed.
Thank you for your patience and understanding about this important initiative.
If you’d like more information, please don’t hesitate to contact info@vtmarkets.com
Please note that the dividends of the following products will be adjusted accordingly. Index dividends will be executed separately through a balance statement directly to your trading account, and the comment will be in the following format “Div & Product Name & Net Volume ”.
Please refer to the table below for more details:
The above data is for reference only, please refer to the MT4/MT5 software for specific data.
If you’d like more information, please don’t hesitate to contact info@vtmarkets.com.
Gold trading is an excellent way to diversify your investment portfolio and hedge against inflation. For beginners, starting out in this market can seem daunting. We’ve distilled the essence of gold trading into the top 10 strategies that are ideal for those new to the trading scene.
#1. Buy and Hold:
This long-term strategy involves purchasing gold and holding onto it. It suits investors who believe gold’s value will rise over time. For example, if you buy gold at $1,500 per ounce and it climbs to $2,000 per ounce over five years, you could make a profit of $500 per ounce.
#2. Dollar-Cost Averaging:
This strategy involves regularly investing a fixed amount in gold, regardless of its fluctuating price, to mitigate the risk of market timing. For instance, if you invest $100 monthly, you buy more when prices are low and less when they’re high, potentially lowering your average cost over time.
Here’s a simple computation example:
Imagine you decide to invest $100 in gold every month for a year.
Month 1: Gold price is $1,800/oz. You buy 0.055 oz of gold ($100/$1,800).
Month 2: Gold price drops to $1,600/oz. You buy 0.0625 oz of gold ($100/$1,600).
Month 12: Gold price rises to $2,000/oz. You buy 0.05 oz of gold ($100/$2,000).
By the end of the year, you own 0.7475 oz of gold at an average purchase price of $1,744.28 per oz. This might be lower than the average gold price over the year, which could potentially increase your overall return.
#3 Technical Analysis
Analyzing charts and using technical indicators can predict the future price of gold. It’s a great strategy for those who are comfortable with technical analysis.
For instance, if you notice that the price of gold is forming a “cup and handle” pattern, you could buy gold in anticipation of a price increase.
#4. Gold Trading Fundamental Analysis
This strategy involves analyzing economic and financial data to predict the future price of gold. For those who are comfortable with fundamental analysis, this strategy works best.
If you’re aware that the US dollar is weakening, you could buy gold in anticipation of a price increase.
#5. Swing Trading
This strategy is about buying and selling gold within a short period of time, usually a few days to a few weeks. This strategy is excellent for investors looking to capitalize on short-term price fluctuations.
Let’s say, if you know the price of gold has increased by 5% in the past week, you could buy gold in anticipation of a further price increase.
#6. Scalping Strategy
This is a high-paced strategy where traders or investors buy and sell gold within a short period of time, usually a few seconds to a few minutes. The scalping technique is preferred by those aiming to profit from minor price movements.
For example, if you notice that the price of gold has increased by 0.1% in the past minute, you could buy gold in anticipation of a further price increase.
#7. Options Trading
Options trading allows investors to speculate on gold’s price with the potential for high leverage. For example, by buying a call option, you bet on the price rising above a certain level within a predetermined period.
Here’s how it works.
a. Buying a Call Option:
Scenario: You believe the price of gold will rise significantly in the next few months.
Action: You buy a call option with a specific strike price (e.g., $2,000 per oz) and expiration date (e.g., 3 months).
Cost: You pay a premium upfront for the option contract (let’s say $100).
Outcome:
Gold price rises above strike price: You can exercise your option to buy gold at the strike price ($2,000) even if the market price is higher. You can then sell the gold at the higher market price for a profit, minus the option premium.
Gold price falls below strike price: The option expires worthless, and you lose the premium.
Simple computation:
Profit = (Market price of gold at expiry – Strike price) – Option premium
For example, if the gold price reaches $2,200 at expiry, your profit would be:
Profit = ($2,200 – $2,000) – $100 = $100
b. Selling a Covered Call:
Scenario: You already own gold and expect its price to stay the same or increase slightly in the short term.
Action: You sell a call option with the same strike price and expiration as your gold holdings.
Income: You receive the option premium upfront (e.g., $100).
Outcome:
Gold price rises above strike price: You lose the opportunity to sell your gold at the higher market price, but you keep the premium and your original gold holdings.
Gold price falls below strike price or stays within a small range: You keep both the premium and your gold, potentially benefiting from a slight price increase.
#8. Spread Trading
When buying and selling two different gold contracts at the same time happens, it’s called spread trading. For traders or investors who want to take advantage of price differences between two different gold contracts, this strategy works well.
For example, if you notice that the price of gold is lower in the US than in Europe, you could buy gold in the US and sell gold in Europe.
#9. Pair Trading
This strategy involves buying and selling two different assets at the same time, usually gold and another commodity. This is a great strategy for investors who want to take advantage of price differences between two different assets.
For instance, if you notice that the price of gold is increasing while the price of oil is decreasing, you could buy gold and sell oil.
#10. Algorithmic Trading
This is where traders use computer programs to buy and sell gold automatically. For those interested in leveraging the speed and precision of computer algorithms, this strategy is particularly appealing.
Let’s say, if you notice that the price of gold is increasing, you could program your computer to buy gold automatically.
Key Takeaways and Final Insights on Gold Trading
Gold trading offers a lucrative opportunity for traders at all levels, from beginners to seasoned professionals. By employing the top 10 strategies outlined in this guide, you significantly enhance your prospects for success in the gold market. It’s essential to conduct thorough research and utilize demo accounts for practice, ensuring a solid understanding and application of these strategies before transitioning to real-money investments.
Maximizing Gold Trading Potential with VT Markets
Embarking on your gold trading journey with a broker that deeply understands the gold market’s intricacies and provides comprehensive tools and support is crucial. VT Markets is dedicated to empowering traders, enabling you to fully leverage market trends and employ advanced trading strategies with confidence.
With our cutting-edge platforms, detailed market analysis, and educational resources, we equip you for success. Explore VT Markets today and take the first step towards mastering gold trading with an ally committed to your growth and success.
On Wednesday, the stock market saw a downturn driven by increasing Treasury yields influenced by robust U.S. economic data. The Dow Jones Industrial Average posted its third consecutive day of losses, dropping by 0.25%, while the S&P 500 and Nasdaq Composite slid 0.56% and 0.59%, respectively. Notable stock movements included a 1.3% drop for Charles Schwab and a 1.3% gain for Boeing. The market reaction was shaped by stronger-than-expected December retail sales data, casting doubt on the need for aggressive rate cuts by the Federal Reserve. The 10-year Treasury yield rose to 4.102%, and traders are estimating a 57% chance of rate cuts in March. In the currency market, the Greenback showed strength, impacting currency pairs like EUR/USD, GBP/USD, and USD/JPY. Gold and Silver prices declined due to the intense dollar rally, while WTI prices rose above $72.00 per barrel amid OPEC’s optimistic report. Traders are eagerly anticipating the EIA’s weekly report on U.S. crude oil inventories for further market cues.
Stock Market Updates
Stocks experienced a decline on Wednesday, influenced by rising Treasury yields following robust U.S. economic data. The Dow Jones Industrial Average marked its third consecutive day of losses, falling by 0.25%, while the S&P 500 and Nasdaq Composite slid 0.56% and 0.59%, respectively. Notable stock movements included a 1.3% drop for Charles Schwab due to mixed quarterly results, while Boeing saw a 1.3% gain, countering recent losses and positioning itself as one of the Dow’s leading gainers.
The market reaction was partly shaped by stronger-than-expected December retail sales data, suggesting a resilient consumer and casting doubt on the need for aggressive rate cuts by the Federal Reserve. Retail sales increased by 0.6% from November, exceeding economist estimates, potentially influencing the Fed’s monetary policy decisions. The 10-year Treasury yield rose to 4.102%, driven by Federal Reserve Governor Christopher Waller’s caution about a slower-than-anticipated easing of monetary policy. Traders, as reflected in CME Group’s FedWatch tool, are currently estimating a 57% chance of the Federal Reserve initiating rate cuts in March.
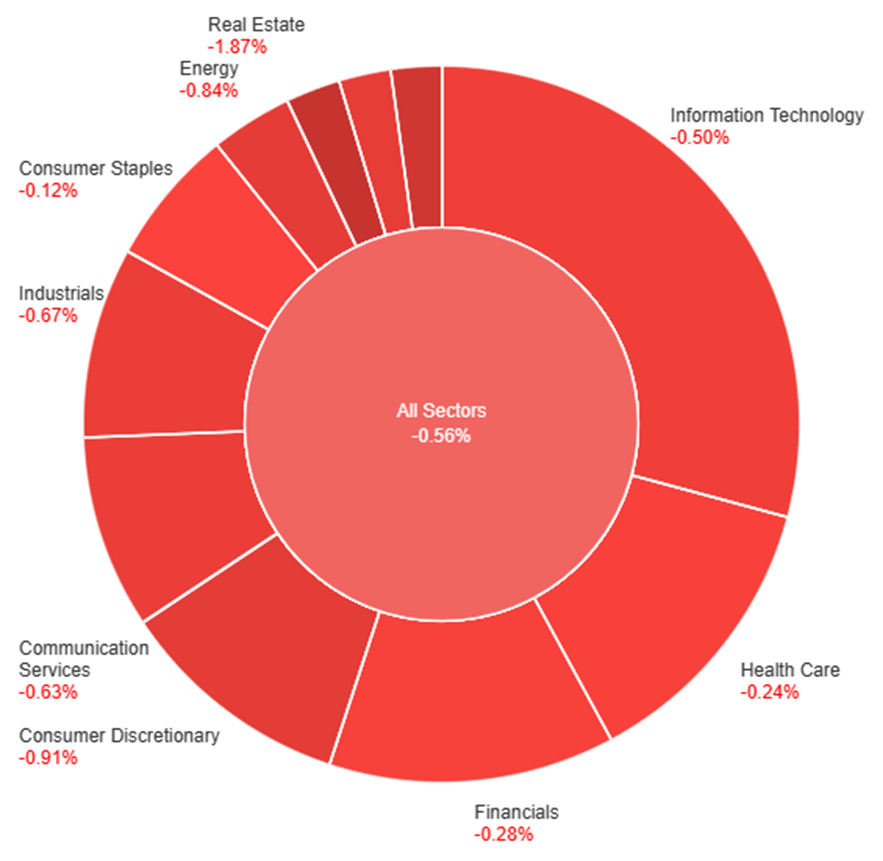
On Wednesday, across various sectors, the market experienced a downward trend, with the overall performance showing a decline of 0.56%. Notably, Utilities and Real Estate were the hardest hit, witnessing substantial decreases of 1.52% and 1.87%, respectively. Other sectors, including Consumer Discretionary, Energy, and Materials, also faced notable declines ranging from 0.80% to 0.91%. The weakest performers among the major sectors were Communication Services (-0.63%), Industrials (-0.67%), and Information Technology (-0.50%). The day saw a broad-based negative impact on the market, reflecting a cautious sentiment across various industries.
Currency Market Updates
In the currency market updates, the Greenback exhibited notable strength, propelling the USD Index to new 2024 peaks around 103.70, fueled by rising US yields across various maturities. The EUR/USD pair faced downward pressure, reaching multi-week lows near 1.0840, influenced by persistent dollar strength and ECB officials downplaying expectations of interest rate cuts in H1 2024. Meanwhile, GBP/USD saw support from higher-than-expected UK inflation figures, leading to decent gains, while USD/JPY surpassed the 148.00 barrier, driven by the dollar’s upward momentum and robust US yields. However, the Australian dollar faced continued selling pressure, with AUD/USD sinking to six-week lows near 0.6520, impacted by general dollar dynamics and discouraging results from the Chinese docket.
In the broader market, the intense dollar rally, coupled with rising US yields, adversely affected both Gold and Silver prices. The negative sentiment around Silver was exacerbated by disappointing Chinese data releases. On the energy front, WTI prices rose above $72.00 per barrel, partially reversing recent weakness following an optimistic report from OPEC. Despite challenges from China and a stronger dollar, traders are attentively awaiting the EIA’s usual weekly report on US crude oil inventories for further market cues.
In Wednesday’s trading session, EUR/USD encountered downward pressure, briefly touching multi-week lows before rebounding. The prevailing uptrend in the US dollar, fueled by robust December Retail Sales, tempered expectations of a Fed rate cut in March. CME Group’s FedWatch Tool indicated a shift, with the probability dropping to just above 50%. Meanwhile, ECB officials, including Knot and Vasle, highlighted market expectations for rate cuts, emphasizing alignment for a 2% inflation target by 2025. Lagarde hinted at a potential rate cut in the summer. Bond yield increases globally, particularly German 10-year bunds and rising US yields, contributed to the euro’s weakness. Poor Chinese fundamentals added to concerns about delayed economic recovery.
On Wednesday, the EUR/USD moved slightly higher, trying to reach the middle band of the Bollinger Bands. Currently, the price moving just below the middle band, suggesting a potential upward movement to reach above the middle band. Notably, the Relative Strength Index (RSI) maintains its position at 46, signaling a neutral outlook for this currency pair.
Resistance: 1.0954, 1.1000
Support: 1.0863, 1.0814
XAU/USD (4 Hours)
XAU/USD Slumps to Mid-December Lows as Dollar Surges Amidst Global Stock Decline
Spot gold, represented by XAU/USD, experiences a downturn, reaching its lowest point since mid-December. The decline is attributed to the strengthening US Dollar, which advances as global stocks continue to fall. Investors are scaling back expectations for a Federal Reserve rate cut in March, evident in the decreasing probability from 70% to 52% according to the CME FedWatch Tool. Mixed US data, including positive Retail Sales and Industrial Production figures, alongside hawkish sentiments from Fed officials, contribute to the diminishing likelihood of a March cut. Rising government bond yields and a continued slump in Wall Street further compound the challenges for gold in this market environment.
On Wednesday, XAU/USD moved lower and was able to create a lower push to the lower band of the Bollinger Bands. Currently, the price moving just above the lower band suggesting a potential downward movement to create another lower push to the lower band. The Relative Strength Index (RSI) stands at 36, signaling a bearish outlook for this pair.
In the shadows of the 17th-century Amsterdam, a groundbreaking financial experiment unfolded, forever altering the course of economic history. The year 1602 saw the birth of the Amsterdam Stock Exchange, a brainchild of the Dutch East India Company, marking the world’s inaugural official stock exchange.
The Amsterdam Stock Exchange source: The Low Countries
Under the canopy of a buttonwood tree on Wall Street, 24 stockbrokers laid the groundwork for organised securities trading, introducing the novel concept of issuing shares to the public.
Fast forward to today, where the once humble origins have burgeoned into a global financial behemoth. With a staggering size surpassing $100 trillion, the modern stock market stands as a testament to the enduring legacy of those early investors and the evolution of financial markets through centuries.
Whether you’re a novice or a seasoned investor, understanding the basics is key to navigating the complexities of the stock market. In this comprehensive guide, we’ll delve into the essentials of stocks and Share CFDs, with a special focus on popular trading strategies.
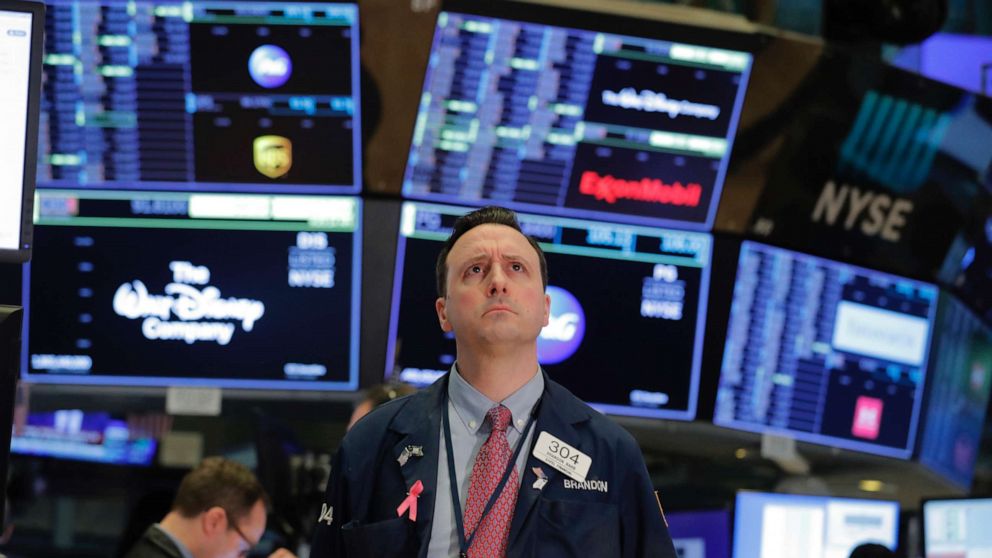
source: ABC News
Stocks: Unlocking Ownership and Dividend Potential
At its core, a stock symbolises ownership in a company, with popular names like Apple (AAPL), Microsoft (MSFT), Amazon (AMZN), and Google’s Alphabet (GOOGL) exemplifying this ownership’s profound impact. Investors holding these stocks actively participate in globally influential companies.
Beyond theoretical ownership, shareholders hold significant rights. This includes voting on corporate decisions and attending pivotal annual shareholder meetings, allowing active engagement in corporate governance.
Stock ownership’s allure extends to the potential for dividends, a feature prominent in dividend-paying stocks like Johnson & Johnson (JNJ), Coca-Cola (KO), Procter & Gamble (PG), and McDonald’s (MCD). These stocks appeal to investors seeking a steady income stream, enhancing the overall return on investment.
In essence, owning stocks aligns investors with a company’s success and prosperity. It’s not just financial; it’s a connection to brands and businesses shaping our daily lives. Investors in these well-known companies become integral contributors to ongoing success and innovation in the business world.
Stock Exchanges: The Pulsating Heart of Global Trading
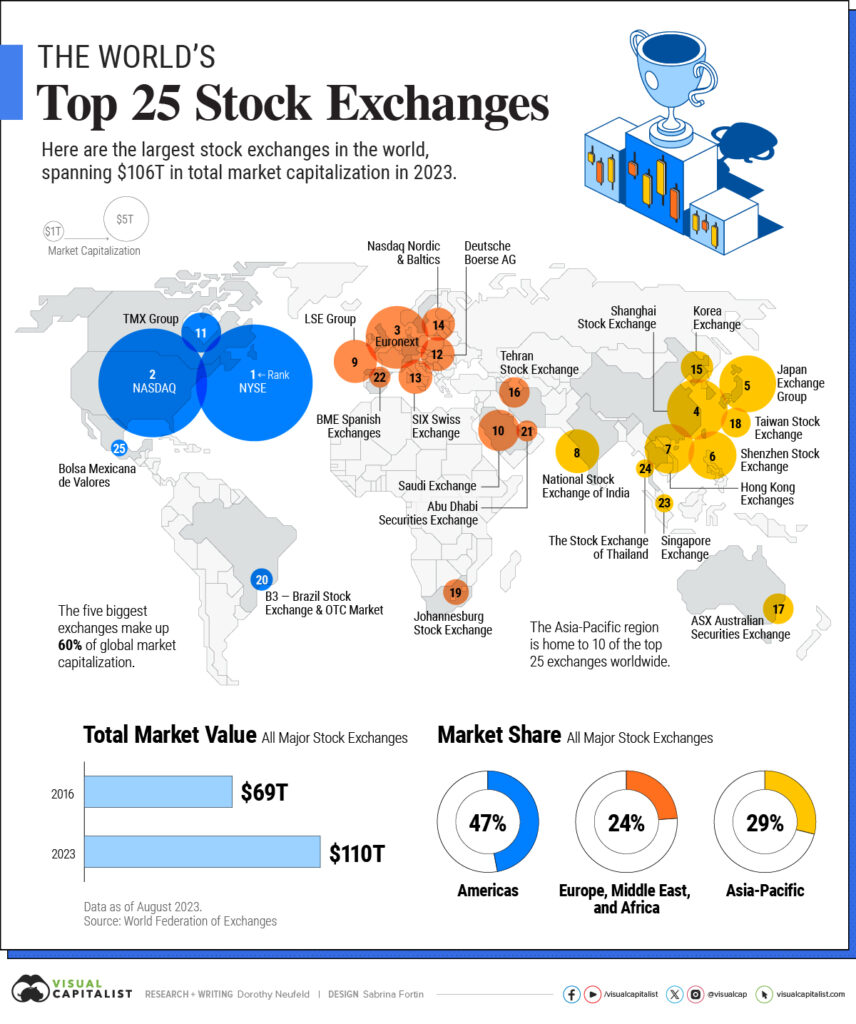
Major stock exchanges worldwide serve as the epicentres where the world’s most influential stocks are bought and sold, shaping the landscape of global finance. Two giants stand out in this domain – the New York Stock Exchange (NYSE) and NASDAQ.
The Largest Stock Exchanges in the World 2023 source: Visual Capitalist
The New York Stock Exchange (NYSE), located on Wall Street in New York City, is the largest and most prestigious stock exchange globally. It boasts a rich history dating back to 1792, providing a platform for some of the most prominent and established companies.
NASDAQ, on the other hand, is renowned for its technology-focused listings and electronic trading platform. Born in 1971, it has become synonymous with innovation and hosts many of the world’s leading technology companies.
In Europe, the London Stock Exchange (LSE) stands as a financial powerhouse, hosting a diverse array of companies. Meanwhile, the Euronext group, spanning Amsterdam, Brussels, Dublin, Lisbon, Milan, and Paris, plays a pivotal role in European trading.
Turning our attention to Asia, the Tokyo Stock Exchange (TSE) in Japan and the Hong Kong Stock Exchange (HKEX) command significant influence. These exchanges contribute to the vibrancy and dynamism of the Asian financial markets.
These exchanges are more than mere facilitators; they are the driving forces shaping stock prices globally. The dynamic interplay of supply and demand on these platforms directly influences the valuation of stocks.
Understanding the mechanics of stock exchanges, particularly the NYSE and NASDAQ, is essential for investors seeking to decipher the intricate forces that shape market trends and individual stock prices. As investors, being attuned to the activities on these exchanges equips us to navigate the complexities of the global financial arena.
Stocks and other financial instruments: Navigating the financial landscape
In the expansive realm of financial instruments, it’s vital to differentiate between various assets. Beyond stocks, investors encounter bonds and Exchange-Traded Funds (ETFs), each with its unique characteristics.
Bonds, in contrast to stocks, represent debt rather than ownership. When an investor buys a bond, they are essentially lending money to a company or government entity. In return, the bondholder receives periodic interest payments and the eventual return of the principal amount.
Exchange-Traded Funds (ETFs), on the other hand, are investment funds that trade on stock exchanges. ETFs offer a diversified investment approach by bundling together a collection of stocks, bonds, or other assets. They provide investors with a way to gain exposure to a broad market or sector without directly owning individual securities.
Understanding these financial instruments allows investors to tailor their portfolios to match their risk tolerance, investment goals, and preferences.
Stocks vs Share CFDs: Navigating investment avenues
Share CFDs, or Contracts for Difference, are financial derivatives that allow traders to speculate on the price movements of underlying stocks without actually owning the shares.
Unlike traditional stock trading, where investors physically buy and own shares in a company, CFDs are contracts between traders and brokers.
The derivative nature of CFDs lies in their ability to derive their value from the underlying asset, in this case, stocks. This derivative structure opens up a world of advantages for traders, enabling them to profit from both rising and falling markets.
Advantage 1: Leverage
One of the key advantages of share CFDs is the ability to trade with leverage. Leverage allows traders to control a larger position size with a smaller amount of capital. While this magnifies potential profits, it’s crucial to note that it also amplifies potential losses. This feature makes CFDs an attractive choice for traders seeking to maximise their market exposure without the need for a substantial upfront investment.
Advantage 2: Short Selling
Share CFDs provide a unique opportunity for traders to profit from falling prices through short selling. In traditional stock trading, short selling is often complex and may involve borrowing shares, but with CFDs, this process is streamlined. Traders can take advantage of market downturns by selling CFDs on stocks they anticipate will decline in value, potentially yielding profits even in bearish market conditions.
Advantage 3: Diversification
Diversification is a cornerstone of sound investment strategy, and share CFDs offer a compelling way to achieve it. With CFDs, traders can access multiple assets with a smaller capital requirement compared to traditional stock trading. This not only enhances risk management but also provides the flexibility to explore diverse markets and sectors.
If you’re an active, short-term trader seeking flexibility and leverage, share CFDs are ideal. Designed for day and swing traders comfortable with increased risk, CFDs allow you to profit in both rising and falling markets. With 24/5 trading, global market exposure, and lower transaction costs, they suit those wanting diverse opportunities.
Share CFDs Trading Tips: A Strategic Approach
Engaging in share CFDs trading demands a strategic mindset. To streamline your approach, focus on these five essential tips:
1. Thorough Research: Prioritise in-depth research on underlying assets, staying informed about market trends, company performance, and global economic factors.
2. Effective Risk Management: Set clear stop-loss and take-profit levels to manage risks diligently. Discipline in risk management is crucial in the unpredictable world of CFD trading.
3. Understand Leverage: Use leverage judiciously, considering its impact on both profits and potential losses. Avoid excessive leverage to mitigate significant financial risks.
4. Stay Informed: Regularly check economic calendars and major market events. Earnings reports, economic indicators, and geopolitical developments can significantly influence asset prices.
5. Continuous Learning: Embrace ongoing education to stay current on market trends, trading strategies, and industry developments. A commitment to learning enhances trading proficiency and adaptability over time.
Incorporating these key tips into your trading strategy will provide a solid foundation for navigating the dynamic landscape of Share CFDs with confidence.
Trading Share CFDs with VT Markets
Discover a wealth of share CFDs trading opportunities with VT Markets, offering access to over 800 leading companies from the US, UK, EU, and Hong Kong.
Leverage up to 20:1 to maximise your trading potential, taking both long and short positions for as low as $0 per trade. This flexibility empowers you to profit from fluctuations in share prices, whether they rise or fall.
Ready to embark on live trading? Open a live trading account with VT Markets for real-time market access. If you’re still refining your strategies, take advantage of the risk-free demo account. Test your approaches and get acquainted with the platform before committing real capital.
VT Markets provides a user-friendly experience for traders of all levels, ensuring you have the tools needed to navigate the dynamic world of share CFDs with confidence.
In conclusion, success in trading stocks and share CFDs demands a strategic approach, disciplined risk management, and continuous learning. Whether you prefer traditional stocks or the flexibility of CFDs, confidence stems from knowledge and a well-crafted strategy. Happy trading!
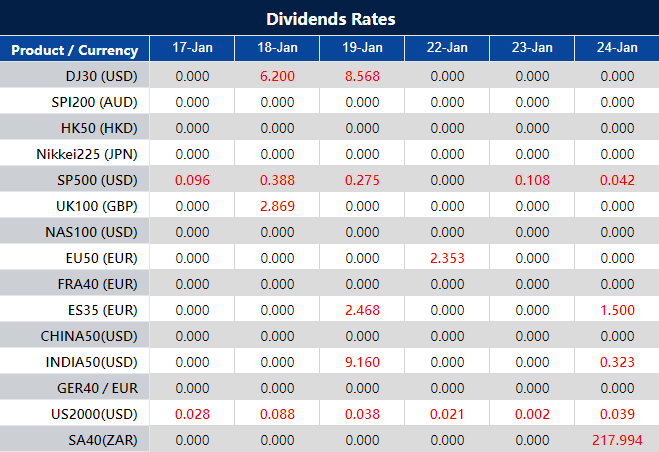
Please note that the dividends of the following products will be adjusted accordingly. Index dividends will be executed separately through a balance statement directly to your trading account, and the comment will be in the following format “Div & Product Name & Net Volume ”.
Please refer to the table below for more details:
The above data is for reference only, please refer to the MT4/MT5 software for specific data.
If you’d like more information, please don’t hesitate to contact info@vtmarkets.com.