Dividend Adjustment Notice – January 26, 2024

Dear Client,

Please note that the dividends of the following products will be adjusted accordingly. Index dividends will be executed separately through a balance statement directly to your trading account, and the comment will be in the following format “Div & Product Name & Net Volume ”.

Please refer to the table below for more details:

The above data is for reference only, please refer to the MT4/MT5 software for specific data.

If you’d like more information, please don’t hesitate to contact info@vtmarkets.com.

S&P 500 Hits New Record, Nasdaq Resilient Despite Tesla Slump

In a week marked by mixed market performance, the S&P 500 soared to a new closing record, while the Nasdaq faced challenges due to Tesla’s post-earnings decline. Positive economic indicators, including robust U.S. GDP growth and encouraging inflation data, influenced market optimism. Despite the Federal Reserve’s interest rate hikes, a healthy balance of non-inflationary growth was observed. Notably, IBM’s stellar performance offset Tesla’s impact. In the currency market, the dollar index strengthened amid evidence of the U.S. outperforming Europe economically.

Stock Market Updates

The stock market exhibited mixed performance as the S&P 500 rose for the sixth consecutive day, setting another all-time closing record at 4,894.16. The Dow Jones Industrial Average also climbed by 0.64%, reaching 38,049.13 points. However, the Nasdaq Composite only increased by 0.18%, hindered by a post-earnings decline in Tesla shares. Despite the overall positive trend, Tesla’s disappointing fourth-quarter results led to a more than 12% drop in its stock, impacting the broader market. The technology-heavy Nasdaq, nevertheless, outperformed with a 1.3% weekly gain, while the S&P 500 and Dow posted increases of 1.1% and 0.5%, respectively.

The market was influenced by positive economic indicators, including the U.S. economy’s robust 3.3% growth rate in the fourth quarter, surpassing economists’ expectations of 2%. Additionally, encouraging data on inflation, with a 2% gain in the personal consumption expenditures price index (excluding food and energy), contributed to market optimism. Despite the Federal Reserve’s interest rate hikes, the data reflected a healthy mix of non-inflationary growth. Notably, IBM’s strong performance, with a more than 9% jump in its stock after beating analysts’ predictions for adjusted earnings and revenue, counterbalanced the negative impact of Tesla’s decline on the overall market. With over one-fifth of S&P 500 companies reporting financials this earnings season, nearly 74% have surpassed Wall Street expectations, according to FactSet.

Data by Bloomberg

On Thursday, the overall market showed a positive trend with a gain of 0.53%. The Energy sector experienced the highest increase, surging by 2.23%, followed by Communication Services with a rise of 1.84%, and Utilities registering a gain of 1.79%. Real Estate also contributed to the upward movement, advancing by 1.31%, while Materials and Industrials increased by 1.09% and 0.97%, respectively. Consumer Staples and Financials showed modest gains of 0.92% and 0.54%, while Information Technology and Health Care had more conservative increases of 0.38% and a slight decrease of -0.23%, respectively. However, Consumer Discretionary recorded a decline of -1.05% on Thursday.

Currency Market Updates

In the currency market updates, the dollar index demonstrated strength, advancing by 0.3% as fresh evidence emerged showcasing the robust performance of the U.S. economy compared to Europe’s. The U.S. Q4 GDP growth exceeded expectations at 3.3%, while Germany’s Ifo data hinted at a lingering recession, and the UK experienced a significant decline in retail sales. The EUR/USD pair fell by 0.43%, despite the European Central Bank (ECB) opting to delay a rate cut, providing no clear guidance on unwinding its substantial rate-hiking cycle. The lack of clarity on when the eurozone inflation downtrend will prompt a shift in ECB policy raises concerns, especially if the economic situation worsens.

Amidst the data-driven decisions of central banks, the focus on Friday will be on the Federal Reserve’s preferred core Personal Consumption Expenditures (PCE) update. As the ECB, Fed, and Bank of England (BoE) navigate their monetary policies based on economic data, the currency market is witnessing fluctuations. USD/JPY rose by 0.14% as the Bank of Japan (BoJ) meeting on Tuesday left the potential for a rate hike in April. However, the Federal Reserve’s March decision remains uncertain. Other economic indicators, such as Tokyo CPI and U.S. core PCE, are anticipated to influence market dynamics, while geopolitical factors continue to impact oil prices and European natural gas trends.

Picks of the Day Analysis
EUR/USD (4 Hours)

EUR/USD Stays Steady Amid ECB News and Strong US Economy

The EUR/USD pair held its ground near 1.0900 as important events unfolded. The European Central Bank (ECB) decided not to change interest rates, sticking to its goal of reaching a 2% inflation target. However, the accompanying document didn’t provide new insights, keeping the pair in its usual range. In the US, the economy surprised with a strong 3.3% growth in Q4, beating the expected 2%. While the US Dollar initially got stronger, mixed data and positive stock market trends made its position varied across currencies. The upcoming press conference by ECB President Christine Lagarde might give more clues about the central bank’s plans and impact the direction of EUR/USD.

Chart EUR/USD by TradingView

On Thursday, the EUR/USD moved lower, reaching the lower band of the Bollinger Bands. Currently, the price is moving just above the lower band, suggesting a potential upward movement to reach the middle band. Notably, the Relative Strength Index (RSI) maintains its position at 41, signaling a neutral but bearish outlook for this currency pair.

Resistance: 1.0890, 1.0954

Support: 1.0814, 1.0745

XAU/USD (4 Hours)

XAU/USD Steady Amid Economic Boost and Dovish Signals

Gold prices stayed steady even as the US Dollar got stronger due to the US economy growing by a better-than-expected 3.3%. This positive news made stocks rise, but interest rates stayed low. In Europe, the central bank didn’t change key interest rates, and its president, Christine Lagarde, shared a cautious message, making the US Dollar even stronger. People are now thinking that interest rates might go down soon. We’re waiting for the release of the December inflation numbers to see what might happen next.

Chart XAU/USD by TradingView

On Thursday, XAU/USD moved lower and was able to reach the lower band of the Bollinger Bands. Currently, the price is moving higher near the middle band suggesting a potential upward movement to reach above the middle band. The Relative Strength Index (RSI) stands at 48, signaling a neutral outlook for this pair.

Resistance: $2,035, $2,052

Support: $2,010, $1,993

Economic Data
CurrencyDataTime (GMT + 8)Forecast
USDCore PCE Price Index m/m21:300.2%

Notification of Server Upgrade – January 25, 2023

Dear Client,

As part of our commitment to provide the most reliable service to our clients, there will be server maintenance this weekend.

Maintenance Hours :
27th of January 2024 (Saturday) 01:30-03:30 (GMT+2)

Please note that the following aspects might be affected during the maintenance:

1. Client portal and VT Markets App will be unavailable. In addition, all their functions will be limited.

2. The price quote and trading management on MT4 and MT5 will be temporarily disabled during the maintenance. You will not be able to open new positions, close open positions, or make any adjustments to the trades.

3. There might be a gap between the original price and the price after maintenance. The gaps between Pending Orders, Stop Loss and Take Profit will be filled at the market price once the maintenance is completed. If you don’t want to hold any open positions during the maintenance, it is suggested to close the position in advance.

4. Please refer to MT4/MT5 for the latest update on the completion and market opening time. Our services will be back online once the maintenance is completed.

Thank you for your patience and understanding about this important initiative.

If you’d like more information, please don’t hesitate to contact info@vtmarkets.com

Dividend Adjustment Notice – January 25, 2024

Dear Client,

Please note that the dividends of the following products will be adjusted accordingly. Index dividends will be executed separately through a balance statement directly to your trading account, and the comment will be in the following format “Div & Product Name & Net Volume ”.

Please refer to the table below for more details:

The above data is for reference only, please refer to the MT4/MT5 software for specific data.

If you’d like more information, please don’t hesitate to contact info@vtmarkets.com.

Tech Surge Propels S&P 500 to Record Highs, but Mixed Performance for Dow Jones

On Wednesday, the stock market exhibited a blend of movements as the S&P 500 set a new record high, driven by a technology stock rally led by Netflix. While the S&P 500 and Nasdaq Composite saw positive gains, the Dow Jones Industrial Average faced a slight decline due to notable drops in Verizon and 3M following earnings reports. Netflix’s remarkable 10% surge, supported by an all-time high subscriber count, contributed to the broader tech sector’s strength in 2024. Microsoft and Meta also made significant gains, pushing the S&P 500 to record levels and confirming a new bull market. However, not all companies shared in the positive momentum, with AT&T and DuPont De Nemours facing setbacks. In the currency market, the dollar index declined, influenced by China’s stimulus measures, impacting pairs like USD/JPY and EUR/USD. The article concludes with a look ahead at upcoming economic data releases, central bank meetings, and geopolitical factors influencing the dynamic currency market.

Stock Market Updates

The stock market experienced mixed movements on Wednesday, with the S&P 500 reaching a new record high, driven by a rally in technology stocks led by Netflix. The S&P 500 edged up 0.08% to close at 4,868.55, establishing a fresh all-time closing record, while the Nasdaq Composite gained 0.36%, marking the fifth consecutive day of positive performance for both indices. However, the Dow Jones Industrial Average slipped 0.26% to 37,806.39, impacted by notable declines in Verizon and 3M following their earnings reports. Netflix saw a significant surge of over 10% after announcing an all-time high subscriber count of 260.8 million and surpassing analysts’ revenue estimates, contributing to the broader tech sector’s strong performance in 2024.

In addition to Netflix’s positive impact, Microsoft’s shares rose nearly 1%, briefly pushing its market value above $3 trillion for the first time, while Meta advanced 1.4%, surpassing a $1 trillion market cap. These gains, along with the strong performance of communication services and information technology stocks, propelled the S&P 500 to record highs and confirmed a new bull market. However, not all companies shared in the positive momentum, with AT&T slipping about 3% due to lower-than-expected earnings, and DuPont De Nemours tumbling 14% after preannouncing weak fourth-quarter results and issuing disappointing first-quarter guidance. Traders continued to focus on earnings reports, with Tesla, Las Vegas Sands, and IBM scheduled to release results after the market close. As of the current earnings season, more than 71% of S&P 500 companies that have reported quarterly financials have exceeded Wall Street expectations, according to FactSet.

Data by Bloomberg

On Wednesday, the overall market saw a marginal increase of 0.08%. Notable positive performances were observed in the Energy sector, which gained 1.43%, followed by Communication Services at 1.17%, and Information Technology at 0.77%. Conversely, the

Consumer Staples, Real Estate, Utilities, and Materials sectors experienced declines of -1.23%, -1.36%, -1.38%, and -1.40%, respectively. The Consumer Discretionary sector also saw a modest decrease of -0.24%. Sectors such as Industrials and Health Care reported larger declines of -0.64% and -0.91%, respectively.

Currency Market Updates

In the currency market updates, the dollar index experienced a 0.45% decline, driven by risk-on sentiments influenced by China’s stimulus measures. The USD/JPY pair saw a significant drop due to rising Japanese Government Bond (JGB) yields in response to the Bank of Japan’s somewhat hawkish meeting earlier in the week. However, a rebound in U.S. flash Purchasing Managers’ Index (PMI) numbers contributed to lifting Treasury yields and helping the dollar recover from its lows. The EUR/USD pair rose by 0.38%, reaching a high of 1.0930 before the U.S. PMI release. The positive impact of the U.S. manufacturing and service sector readings beating forecasts was tempered by a cooling price received index.

Looking ahead, attention in the currency market is shifting to upcoming hard U.S. data ahead of the Federal Reserve meeting next week. Key events include Q4 GDP and jobless claims on Thursday, followed by core Personal Consumption Expenditures (PCE), income, and spending on Friday. Additionally, post-European Central Bank (ECB) meeting events on Thursday may provide hints regarding the timing of the first rate cut, which is currently favored for April. Tokyo CPI data on Friday will also be closely monitored amid speculation about a Bank of Japan rate hike, with April’s BoJ meeting seen as the earliest potential venue for such a move. The article also notes the market’s modest preference for a March Fed rate cut in futures. Overall, the currency market remains dynamic, responding to a combination of economic data releases, central bank meetings, and geopolitical developments.

Picks of the Day Analysis
EUR/USD (4 Hours)

EUR/USD Surges as Intense Greenback Sell-Off and Positive Economic Indicators Overpower Rate Cut Speculations

In a surprising turn of events, the intense sell-off in the greenback allowed EUR/USD to overcome recent weaknesses, pushing past the 1.0900 hurdle and reaching new multi-day highs. The USD Index (DXY) faced headwinds in the risk-friendly environment, dropping below 103.00 despite an uptick in US yields. Speculation shifted away from a Fed rate cut in March, favoring a reduction in May. Contributing to the Euro’s strength were robust PMIs in Germany and the eurozone for January, suggesting a potential soft landing for the regional economy. As the ECB event approaches, market participants are weighing in on potential rate cuts, with debates arising on the timing of the central bank’s decision, further fueled by President Lagarde’s hints at a move during the summer.

Chart EUR/USD by TradingView

On Wednesday, the EUR/USD moved higher, able to reach the upper band of the Bollinger Bands. Currently, the price is moving back lower to reach below the middle band, suggesting a potential downward movement to reach the lower band. Notably, the Relative Strength Index (RSI) maintains its position at 47, signaling a neutral outlook for this currency pair.

Resistance: 1.0890, 1.0954

Support: 1.0814, 1.0745

XAU/USD (4 Hours)

US Dollar Strengthens as Upbeat Data Pushes Gold (XAU/USD) to Weekly Low

In the American session, the US Dollar gained momentum, driving Gold (XAU/USD) down to $2,011.72, marking a fresh weekly low. The surge was fueled by optimistic US economic data, particularly the January Producer Manager Indexes (PMIs) released by S&P Global. Manufacturing output improved to 50.3, surpassing the previous 47.9 and reaching the highest reading in over a year. The Services PMI also exceeded expectations at 52.9, indicating the sharpest business activity growth in seven months. While the Bank of Canada (BoC) left its key rate unchanged at 5%, the statement was slightly more hawkish, reducing the likelihood of an April rate cut. Despite this, stock markets maintained a positive tone, with Wall Street resuming its record rally on better-than-anticipated earnings reports, signaling overall economic health.

Chart XAU/USD by TradingView

On Wednesday, XAU/USD moved lower and was able to reach the lower band of the Bollinger Bands. Currently, the price moving around the lower band suggesting a potential upward movement to reach the middle band. The Relative Strength Index (RSI) stands at 43, signaling a neutral outlook for this pair.

Resistance: $2,035, $2,052

Support: $2,010, $1,993

Economic Data
CurrencyDataTime (GMT + 8)Forecast
EURMain Refinancing Rate21:154.50%
EURMonetary Policy Statement21:15 
USDAdvance GDP q/q21:302.0%
USDUnemployment Claims21:30199K
EURECB Press Conference21:45 

Dividend Adjustment Notice – January 24, 2024

Dear Client,

Please note that the dividends of the following products will be adjusted accordingly. Index dividends will be executed separately through a balance statement directly to your trading account, and the comment will be in the following format “Div & Product Name & Net Volume ”.

Please refer to the table below for more details:

The above data is for reference only, please refer to the MT4/MT5 software for specific data.

If you’d like more information, please don’t hesitate to contact info@vtmarkets.com.

Netflix’s Record-Breaking Subscribers Propel Tech Stocks, Nasdaq Futures Surge in 2024

After Netflix’s stellar fourth-quarter performance, Nasdaq 100 futures experienced a significant boost in Tuesday evening trading. Fueled by Netflix’s impressive subscriber growth of 13 million, reaching a record 260.8 million, tech-heavy Nasdaq 100 futures rose by 0.28%, contributing to the broader strength of mega-cap tech stocks and propelling the S&P 500 to record highs. While the Dow Jones Industrial Average futures showed a more restrained response, Netflix’s positive performance extended beyond subscriber gains, with an 8.6% surge in extended trading. The article delves into the factors driving Netflix’s success and the resilience of tech stocks amid mixed market performances, offering insights into currency market dynamics and the potential impact on various economies, particularly Japan, as they navigate higher rates and potential rate cuts. The narrative also previews upcoming economic data, emphasizing the market’s focus on the European Central Bank meeting, U.S. Q4 GDP, and core PCE readings for further guidance on Fed and dollar pricing.

Stock Market Updates

In the wake of Netflix’s strong fourth-quarter performance, futures linked to the Nasdaq 100 experienced a notable uptick during Tuesday evening trading. The tech-heavy Nasdaq 100 futures rose by 0.28%, driven by Netflix’s robust results, which revealed a record-breaking subscriber count of 260.8 million, an increase of over 13 million in the last quarter. The streaming giant’s impressive gains contributed to the broader strength of mega-cap tech stocks in 2024, propelling the S&P 500 to record highs and confirming the onset of a new bull market. However, the Dow Jones Industrial Average futures only edged up by 0.05%, with a marginal increase of 19 points, reflecting a more subdued response possibly influenced by disappointing earnings and guidance from certain blue-chip companies during the main trading session.

Netflix’s positive performance extended beyond subscriber growth, as its shares surged by 8.6% in extended trading. The company not only exceeded revenue expectations but also provided optimistic earnings guidance for the current quarter, surpassing Wall Street forecasts. Analysts attribute Netflix’s success to the strength of its ad-tier business scaling, particularly in the latter part of the previous year, and its efforts to curb password sharing. As traders keep an eye on upcoming economic data, including U.S. manufacturing and services statistics for January and fourth-quarter gross domestic product figures, the broader market dynamics underscore the resilience of tech stocks amid mixed performances in other sectors, as exemplified by the Dow’s slight retreat during the main trading session.

Data by Bloomberg

On Tuesday, the overall market experienced a modest gain of 0.29%. Noteworthy performances were observed in the Consumer Staples (+1.08%), Communication Services (+1.00%), and Information Technology (+0.45%) sectors, contributing positively to the overall uptrend. However, the healthcare sector showed a slight decline with -0.05%, while Industrials (-0.06%), Consumer Discretionary (-0.14%), and Real Estate (-0.51%) sectors exhibited marginal losses, indicating a mixed day for different segments of the market. The Financials (+0.14%), Energy (+0.34%), and Materials (+0.32%) sectors also contributed to the overall positive sentiment with modest gains.

Currency Market Updates

In Tuesday’s currency market updates, the dollar index exhibited a 0.36% increase, recovering from earlier losses spurred by a brief yen rise following a somewhat more hawkish Bank of Japan (BoJ) meeting. The EUR/USD pair broke below key support from the previous week as Treasury yields outpaced bund yields. Despite the BoJ expressing confidence in ending its negative rates policy later in the year and the market leaning towards a 10-basis point June hike to zero, 2-year Japanese Government Bond (JGB) yields only rose to 0.06%. The article highlights how various economies, particularly Japan, can manage higher rates or a gradual retreat from previous rate hikes. The U.S. appears more resilient, having raised rates more than other major central banks, with futures markets not fully pricing in a Federal Reserve rate cut until May.

EUR/USD experienced a 0.45% decline, breaking key technical supports such as the daily cloud top and the 200-day moving average. USD/JPY initially dropped to 146.99 lows in response to the BoJ meeting but found support near the 10-day moving average and 147, leading to a 0.3% increase on the day. The article points out the potential challenge of testing the Ministry of Finance’s desire to prevent the yen from falling below 2022/23 lows at 151.94/92 if U.S. data continues to suggest fewer Fed rate cuts. Meanwhile, sterling fell 0.35%, despite rising Gilt-Treasury yield spreads, and is closely watched ahead of the Bank of England’s meeting on February 1. The focus for the rest of the week includes the European Central Bank meeting, U.S. Q4 GDP, and Friday’s core PCE for further Fed and dollar pricing guidance, with the flash January PMI readings as a key data feature on Wednesday.

Picks of the Day Analysis
EUR/USD (4 Hours)

EUR/USD Hits Multi-Week Lows as Greenback Gains Strength Amid ECB Caution

On Tuesday, the EUR/USD pair extended its decline, reaching fresh multi-week lows in the 1.0820 zone as the selling bias persisted in the risk complex. The USD Index (DXY) soared to a new yearly high of 103.80, driven by a robust buying bias in the greenback, higher US yields, and an overarching risk-off sentiment. The upcoming ECB event is marked by a growing debate between market participants and rate-setters regarding the timing of potential rate cuts, with President Lagarde hinting at a possible move in the summer. Despite inflation surpassing the ECB target, cautious policymaking in the face of weak economic fundamentals continues to limit the Euro’s potential for strengthening.

Chart EUR/USD by TradingView

On Tuesday, the EUR/USD moved lower, able to reach the lower band of the Bollinger Bands. Currently, the price is moving just above the lower band, suggesting a potential upward movement to reach the middle band. Notably, the Relative Strength Index (RSI) maintains its position at 41, signaling a neutral but bearish outlook for this currency pair.

Resistance: 1.0890, 1.0954

Support: 1.0814, 1.0745

XAU/USD (4 Hours)

XAU/USD Holds Steady Above $2,020 Amidst Market Volatility and Economic Indicators

Gold (XAU/USD) maintained a tight trading range just above $2,020 per troy ounce on Tuesday, propelled initially by a weakening US Dollar in response to record highs in the S&P 500 and Dow Jones Industrial Average. The precious metal’s rally in the first half of the day was influenced by market optimism regarding a potential interest rate cut by the Federal Reserve. However, the USD regained strength later in the day as equities faced losses, driven by caution ahead of earnings reports and concerns about macroeconomic events in the coming days. Despite disappointing US data, gold remained resilient, with attention turning to the Bank of Canada’s upcoming monetary policy decision.

Chart XAU/USD by TradingView

On Tuesday, XAU/USD moved higher and was able to reach the upper band of the Bollinger Bands. Currently, the price is moving just above the middle band suggesting a potential upward movement to reach the upper band. The Relative Strength Index (RSI) stands at 50, signaling a neutral outlook for this pair.

Resistance: $2,035, $2,052

Support: $2,010, $1,993

Economic Data
CurrencyDataTime (GMT + 8)Forecast
EURFrench Flash Manufacturing PMI16:1542.5
EURFrench Flash Services PMI16:1546.1
EURGerman Flash Manufacturing PMI16:3043.7
EURGerman Flash Services PMI16:3049.3
GBPFlash Manufacturing PMI17:3046.7
GBPFlash Services PMI17:3053.1
CADBOC Monetary Policy Report22:45 
CADBOC Rate Statement22:45 
CADOvernight Rate22:455.00%
USDFlash Manufacturing PMI22:4547.6
USDFlash Services PMI22:4551.4
CADBOC Press Conference23:30 

How to Master Technical Analysis Indicators for Gold Trading

A Comprehensive Guide to Technical Analysis Indicators

If you are interested in trading gold, you might have heard of technical analysis indicators. These are tools that help you analyze the price movements of gold and make better trading decisions.  

But what are they and how do you use them? In this blog post, we will explain the basics of gold technical analysis today and show you some of the best mt4 indicator for gold trading. 

What is technical analysis?

Technical analysis is a method of studying the past and present price patterns of an asset, such as gold, to predict its future direction.  

Technical analysts use various indicators, such as trend lines, support and resistance levels, moving averages, oscillators, and more, to identify the trend, momentum, volatility, and strength of the market. 

Technical analysis assumes that the price reflects all the available information and that history tends to repeat itself. By using technical analysis indicators, you can spot potential entry and exit points for your trades, as well as manage your risk and reward. 

What are the best mt4 indicator for gold trading?

 MT4 is one of the most popular trading platforms for forex and CFDs, including gold. It offers a wide range of technical analysis indicators that you can customize and apply to your charts.  

Here are some of the best mt4 indicator for gold trading that you can use: 

  • Moving Average Convergence Divergence (MACD):  

This is a trend-following and momentum indicator that shows the relationship between two moving averages of the price. The MACD consists of a MACD line, a signal line, and a histogram.  

When the MACD line crosses above the signal line, it indicates a bullish trend. When it crosses below the signal line, it indicates a bearish trend.  

The histogram shows the difference between the two lines and reflects the strength of the trend. You can use the MACD to identify trend reversals, as well as overbought and oversold conditions. 

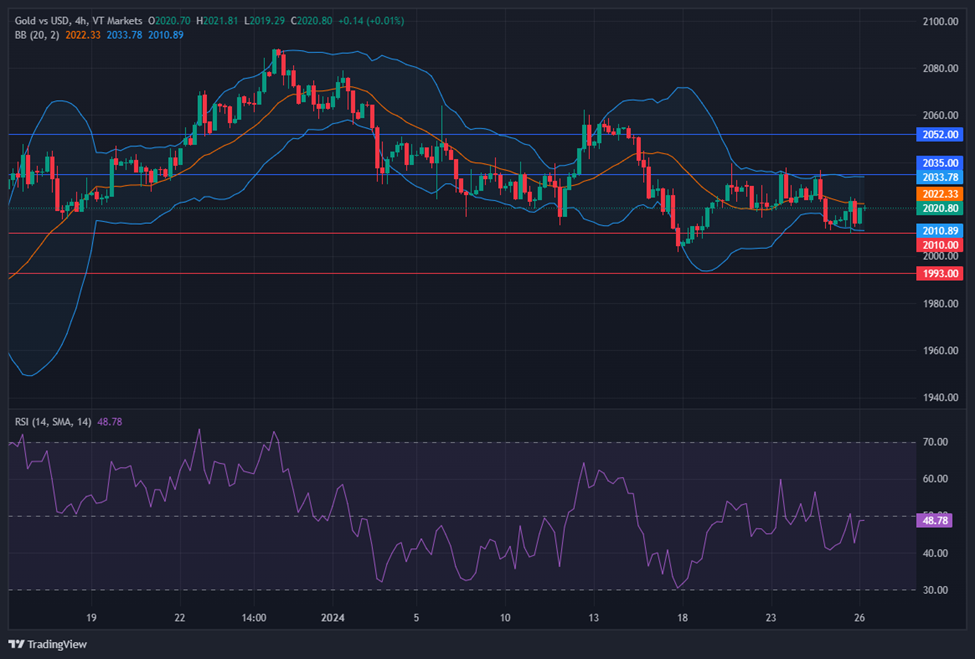
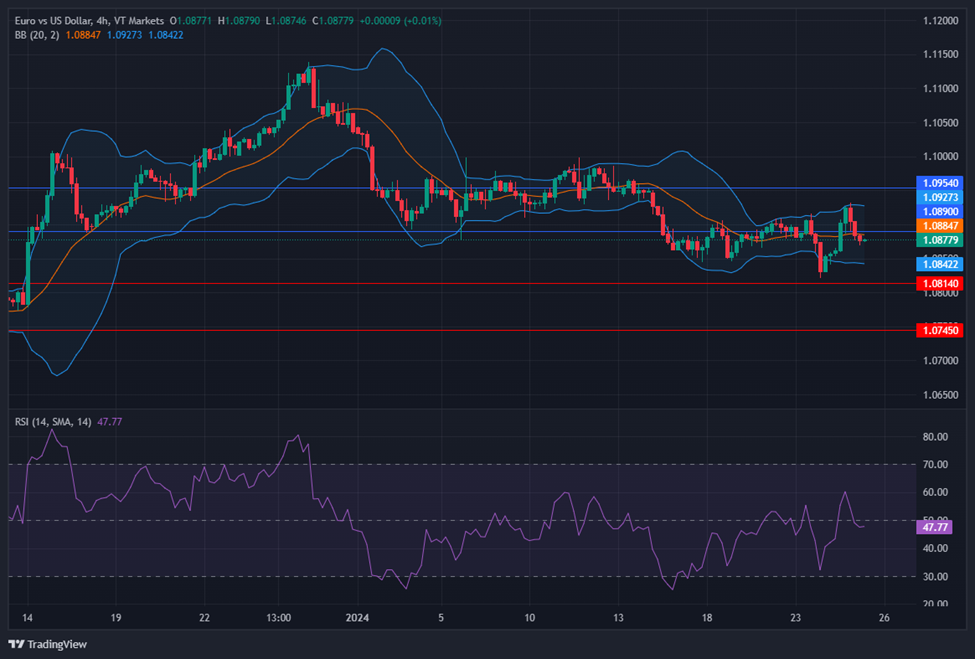
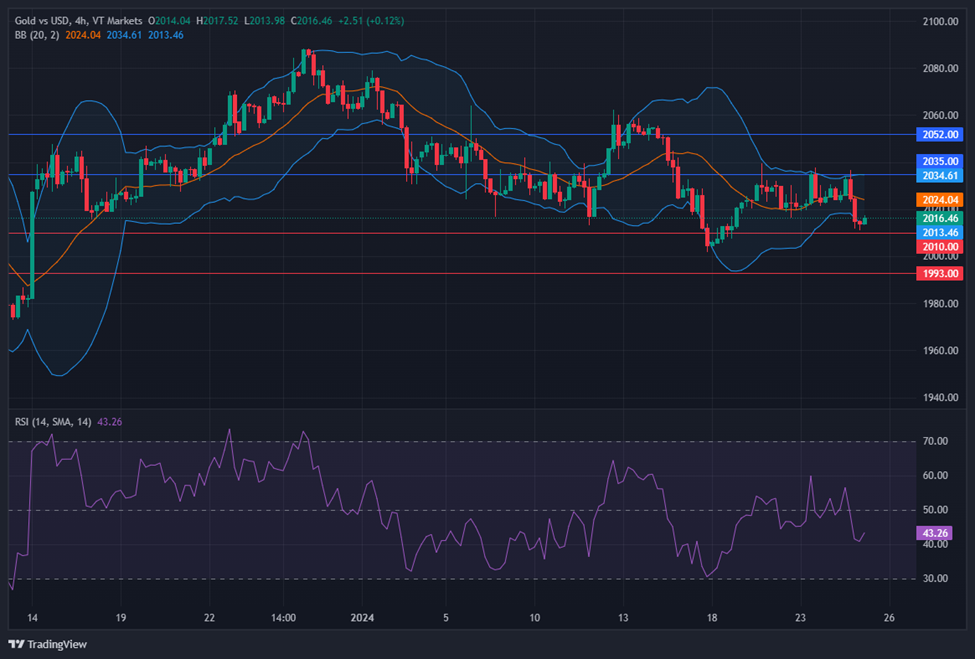
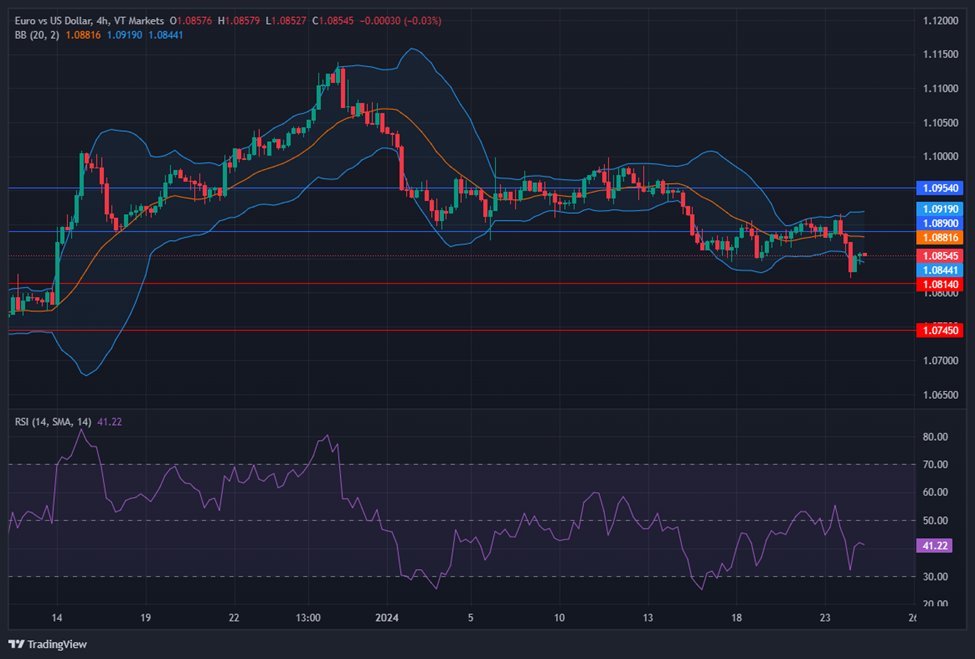
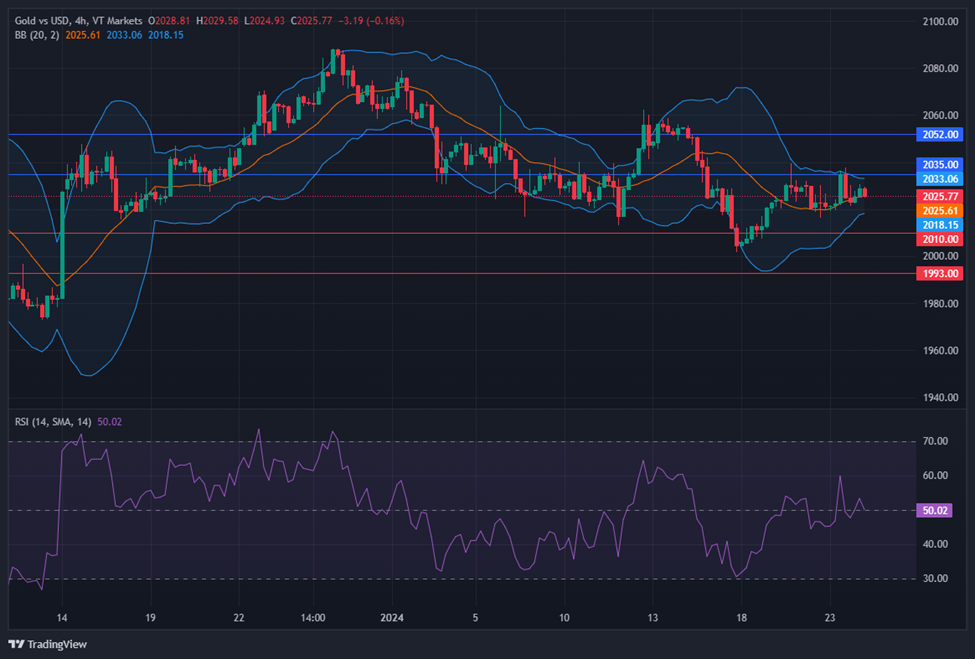
  • Relative Strength Index (RSI):  

This is an oscillator that measures the speed and change of price movements. The RSI ranges from 0 to 100, with 30 and 70 being the typical thresholds for oversold and overbought levels, respectively.  

When the RSI is above 70, it means that the price is overbought and may reverse soon. When the RSI is below 30, it means that the price is oversold and may bounce back. You can use the RSI to confirm trend direction, as well as spot divergence signals. 

  • Bollinger Bands:  

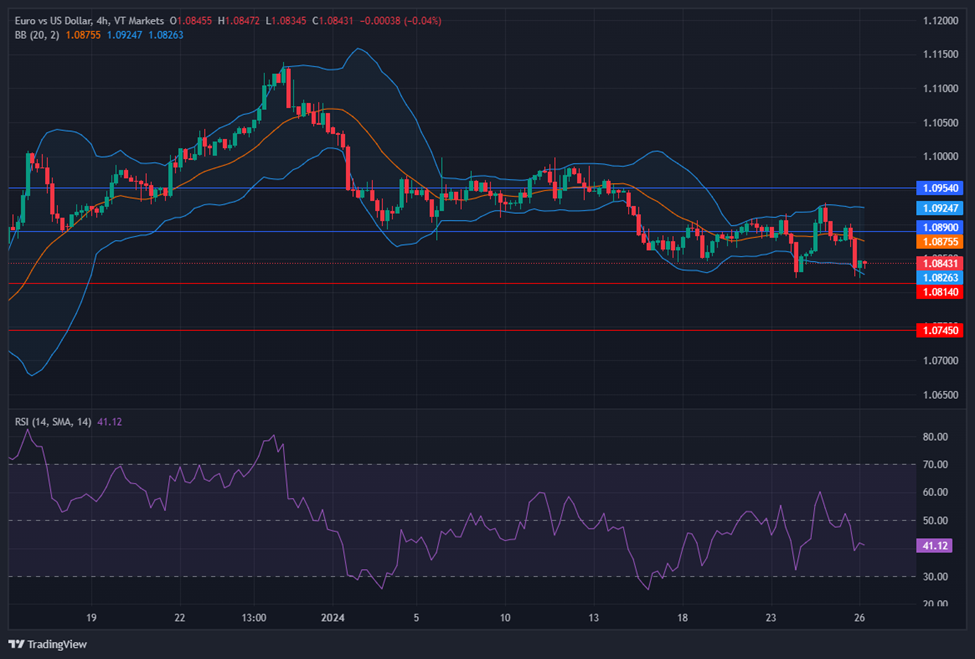
These are volatility bands that consist of a simple moving average (SMA) and two standard deviations above and below it.  

The bands widen when the volatility increases and narrow when the volatility decreases. The SMA acts as a dynamic support and resistance level, while the upper and lower bands indicate extreme price movements.  

You can use Bollinger Bands to identify breakout opportunities, as well as squeeze situations. 

Technical analysis indicators for gold trading

To use technical analysis indicators for gold trading, you need to follow these steps: 

#1. Choose your time frame:  

Depending on your trading style and objectives, you can choose a time frame that suits you best. For example, if you are a day trader, you might use a 15-minute or an hourly chart. If you are a swing trader, you might use a daily or a weekly chart. 

#2. Choose your indicators:  

Depending on your trading strategy and preferences, you can choose one or more indicators that complement each other.  

For example, if you want to trade with the trend, you might use MACD and RSI together. If you want to trade volatility, you might use Bollinger Bands and RSI together. 

#3. Apply your indicators:  

Once you have chosen your indicators, you need to apply them to your chart and adjust their settings according to your needs.  

For example, if you are using MACD, you might change its parameters from 12, 26, 9 to 5, 34, and 5 for faster signals. 

#4. Interpret your indicators:

After applying your indicators, you need to interpret their signals and act accordingly.  

Let’s say, if you are using MACD and RSI together, you might look for a bullish crossover of the MACD line above the signal line accompanied by an RSI reading above 50 to enter a long position. 

#5. Manage your trade: 

Once you have entered a trade based on your indicators, you need to manage it by setting your stop loss and take profit levels, as well as monitoring your indicators for exit signals. 

For instance, if you are using MACD and RSI together, you might exit your long position when the MACD line crosses below the signal line or when the RSI drops below 50. 

Wrapping up: Enhancing Your Gold Trading Strategy with Key MT4 Indicators

Technical analysis indicators are powerful tools that can help you trade gold more effectively. By using some of the best mt4 indicator for gold trading, such as MACD, RSI, and Bollinger Bands, you can identify the trend, momentum, volatility, and strength of the market and make better trading decisions.  

However, you should always remember that indicators are not infallible and that you should combine them with other factors, such as fundamental analysis, risk management, and trading psychology. 

 If you want to practice trading gold with technical analysis indicators, you can open a demo account with us and trade without any money. You can also access our educational resources and learn more about gold trading and technical analysis. Start your trading journey today! 

Start Your Trading Journey with VT Markets

Enhance your gold trading strategy with VT Markets. Open a demo account to practice using technical analysis indicators like MACD, RSI, and Bollinger Bands. Access our educational resources and start trading confidently today!

Dividend Adjustment Notice – January 23, 2024

Dear Client,

Please note that the dividends of the following products will be adjusted accordingly. Index dividends will be executed separately through a balance statement directly to your trading account, and the comment will be in the following format “Div & Product Name & Net Volume ”.

Please refer to the table below for more details:

The above data is for reference only, please refer to the MT4/MT5 software for specific data.

If you’d like more information, please don’t hesitate to contact info@vtmarkets.com.

Back To Top
server

Hello there 👋

How can I help you?

Chat with our team instantly

Live Chat

Start a live conversation through...

  • Telegram
    hold On hold
  • Coming Soon...

Hello there 👋

How can I help you?

telegram

Scan the QR code with your smartphone to start a chat with us, or click here.

Don’t have the Telegram App or Desktop installed? Use Web Telegram instead.

QR code