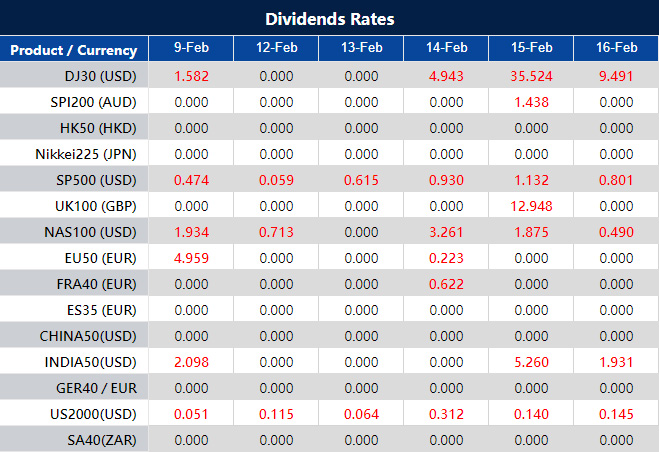
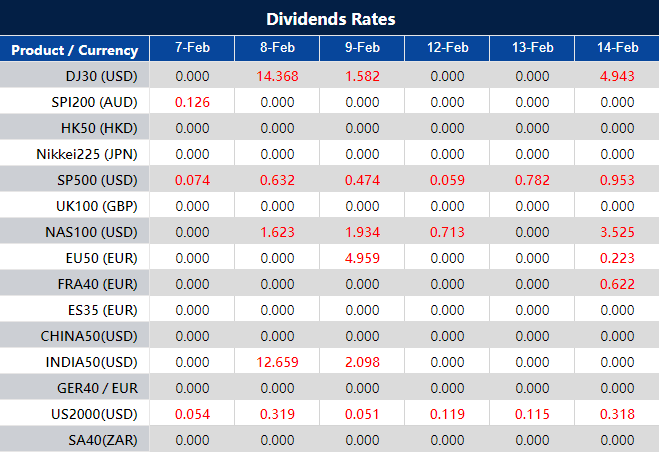
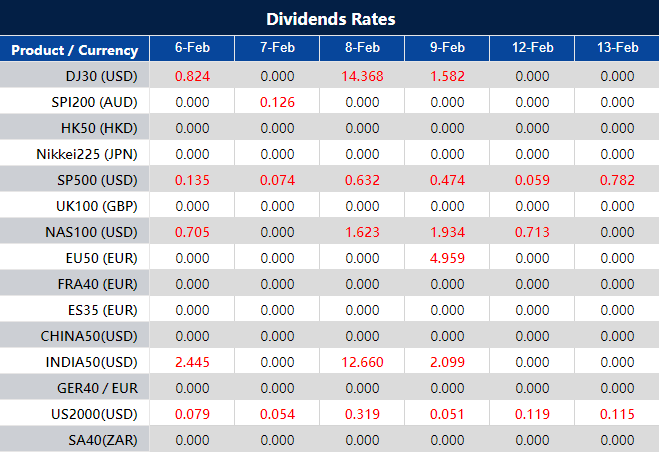
Please note that the dividends of the following products will be adjusted accordingly. Index dividends will be executed separately through a balance statement directly to your trading account, and the comment will be in the following format “Div & Product Name & Net Volume ”.
Please refer to the table below for more details:
The above data is for reference only, please refer to the MT4/MT5 software for specific data.
If you’d like more information, please don’t hesitate to contact info@vtmarkets.com.
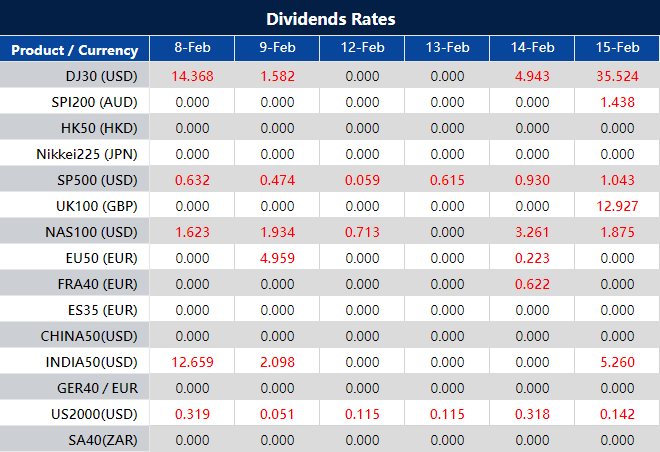
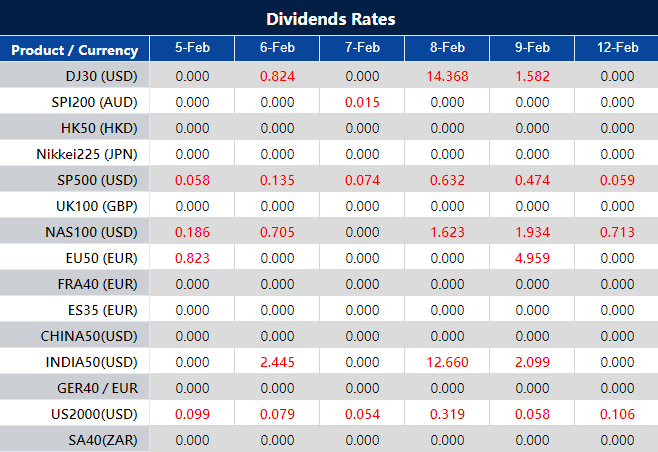
Mastering Gold Day Trading: Strategies for Optimal Entry and Exit Points
Gold is one of the most popular precious metals to trade, especially in times of uncertainty and volatility. But how do you know when to buy and sell gold to maximize your profits?
In this blog post, we will show you how to use a simple gold day trading strategy that can help you find the best entry and exit points for your trades.
What is Gold Day Trading Strategy?
Gold intraday trading strategy is a method of trading gold within the same day, using technical analysis and indicators to identify the price movements and trends of gold.
The goal is to capture the short-term fluctuations of gold and profit from them, rather than holding gold for a long time.
The main advantage of gold intraday trading strategy is that it can reduce the risk of overnight price gaps. This means such gaps can occur when the market is closed or when there are major news events that affect the price of gold.
On the flipside, the main disadvantage is that it requires more attention and discipline, as you need to monitor the market closely and exit your trades before the end of the day.
How to Apply this Strategy on Gold Day Trading?
To apply gold intraday trading strategy today, you need to follow these steps:
1) Choose a time frame for your chart.
Depending on your trading style and preference, you can use any time frame from 1-minute to 4-hour. However, a common choice for intraday traders is the 15-minute chart, as it can provide enough details and signals without being too noisy or lagging.
2) Apply technical analysis tools to your chart.
You can use any tools that you are familiar with, such as:
Trend lines,
Support and resistance levels,
Fibonacci retracements,
Moving averages, etc.
The key is to identify the trend’s direction and strength and potential reversal points.
3) Use indicators to confirm your signals.
Indicators are mathematical calculations. They can help you measure various aspects of the price action, such as momentum, volatility, volume, etc. Some of the popular indicators for gold intraday trading strategy are:
Relative Strength Index (RSI):
This indicator measures the speed and change of price movements on a scale from 0 to 100. Generally, a reading above 70 indicates that the price is overbought and may reverse soon, while a reading below 30 indicates that the price is oversold and may bounce back.
Stochastic Oscillator:
The Stochastic Oscillator indicator compares the closing price of a period to the range of prices over a certain number of periods.
It also has two lines: %K and %D. Generally, a crossover of these lines indicates a change in momentum, while divergence between these lines and the price indicates a possible reversal.
Moving Average Convergence Divergence (MACD):
This indicator consists of two moving averages that converge and diverge as the trend changes. It also has a histogram that shows the difference between these moving averages.
Generally, a crossover of these moving averages indicates a change in trend direction, while a crossover of the histogram and the zero line indicates a change in trend strength.
4) Enter and exit your trades based on your signals.
Once you have applied your technical analysis tools and indicators to your chart, you can look for entry and exit points for your trades. For example:
If you are in an uptrend, you can look for buying opportunities when the price retraces to a support level or a Fibonacci level, or when the RSI is oversold or the MACD histogram crosses above zero.
If you are in a downtrend, you can look for selling opportunities when the price rallies to a resistance level or a Fibonacci level, or when the RSI is overbought or the MACD histogram crosses below zero.
You can exit your trades when you reach your target profit or when you see signs of reversal, such as a trend line break or an indicator divergence.
Unlocking Success of Gold Day Trading with Demo Account
Open a demo account with us and practice trading without risking any money. A demo account is a free and risk-free way to test your skills and strategies in a simulated environment, with real-time market data and prices.
To open a demo account today, click here and fill out the form. You will receive an email with your login details and instructions on how to start trading.
On Wednesday, the stock market experienced notable gains, propelling the S&P 500 tantalizingly close to the 5,000 mark, thanks to strong quarterly results underscoring a robust economy. The index rose by 0.82%, setting a new closing high of 4,995.06, while the Nasdaq Composite and Dow Jones also posted gains, driven by upbeat corporate earnings and the growth of tech giants like Nvidia and Microsoft. Despite the Federal Reserve’s cautious stance on interest rate cuts, investor optimism remained buoyed by signs of resilient consumer spending and positive corporate guidance. Additionally, the currency market saw adjustments ahead of key U.S. economic data, with the dollar index slightly retreating as markets await the upcoming CPI report, potentially influencing future Fed policy decisions.
Stock Market Updates
On Wednesday, the stock market witnessed significant gains, with the S&P 500 inching closer to the coveted 5,000 mark, achieving a new closing high as a result of strong quarterly results that suggest a thriving economy. The index saw a 0.82% rise, closing at 4,995.06, and even touched 4,999.89 at its peak during the session. Similarly, the Nasdaq Composite and the Dow Jones Industrial Average experienced increases, with the Nasdaq up by 0.95% to 15,756.64 and the Dow Jones rallying 156 points or 0.4%, to close at an all-time high of 38,677.36. These gains were propelled by optimistic corporate earnings and significant growth in major technology companies like Nvidia, Microsoft, Meta Platforms, Alphabet, and Amazon.
The market’s robust performance is attributed to a better-than-expected earnings season, strong corporate guidance, and signs of resilient consumer spending despite high-interest rates. This optimism persisted even as the Federal Reserve and its officials, including Chair Jerome Powell and Minneapolis Fed President Neel Kashkari, suggested a more cautious approach towards rate cuts, potentially delaying them longer than investors had anticipated. In addition, the stock market’s advance reflects a growing comfort among investors with the prospect of delayed rate cuts. Meanwhile, other notable movements included a significant rise in Enphase Energy’s stock following positive comments on its inventory situation, Ford’s surge after surpassing fourth-quarter expectations, and New York Community Bancorp’s volatile performance after Moody’s downgrade. The market is also anticipating earnings reports from major companies like Walt Disney, PayPal, and Arm Holdings.
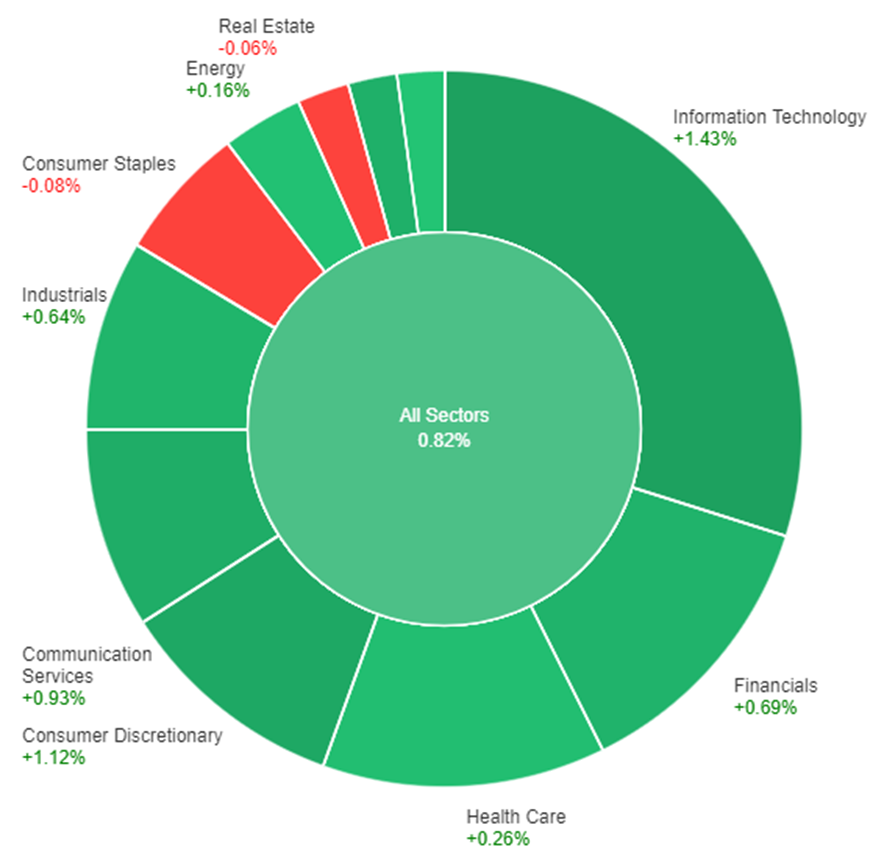
On Wednesday, the stock market showed a positive trend across most sectors, with the overall sectors seeing an increase of 0.82%. Information Technology led the gains with a 1.43% rise, followed closely by Consumer Discretionary and Communication Services, which went up by 1.12% and 0.93%, respectively. Other sectors such as Materials, Financials, Industrials, and Health Care also saw increases, albeit at a slower pace, with gains ranging from 0.26% to 0.81%. The Energy and Utilities sectors experienced minimal growth, with increases of 0.16% and 0.05%, respectively. However, not all sectors fared well; Real Estate and Consumer Staples saw declines of 0.06% and 0.08%, marking them as the only sectors to experience a downturn on Wednesday.
Currency Market Updates
In the currency market, the dollar index saw a minor decline on Wednesday, entering a period of consolidation after experiencing significant gains fueled by robust U.S. employment figures and ISM data. This pause in momentum comes as the market anticipates further disinflationary data before the Federal Reserve considers any rate cuts. The focus now shifts to the upcoming U.S. CPI data scheduled for February 13, which could play a crucial role in shaping future Fed policy decisions. Despite a decrease in the likelihood of a March Fed rate cut, from previously higher probabilities, the market still anticipates substantial easing throughout the year, a scenario that remains more aggressive than the Fed’s own projections.
Currency pairs reacted to these developments, with the EUR/USD pair showing some resilience by posting a modest gain of 0.14%, despite facing resistance at key technical levels. This movement reflects ongoing market adjustments ahead of significant Treasury auctions and amidst mixed signals from Fed officials regarding the pace of future rate cuts. Meanwhile, the USD/JPY pair edged higher, influenced by the dynamics of Treasury yields in comparison to Japan’s relatively stable and low yields. Other currencies, such as the British pound and the Swiss franc, also experienced movements influenced by speculation around monetary policy adjustments and interventions, respectively. As markets brace for the U.S. annual CPI revisions and January’s CPI report, currency traders remain vigilant, gauging the potential impact of these releases on Fed policy and consequently on currency valuations.
Picks of the Day Analysis
EUR/USD (4 Hours)
EUR/USD Rises Amid USD Weakness and Central Bank Signals
As the US Dollar experiences a corrective decline, dipping back to the 104.00 area due to lower US yields and speculations around the Federal Reserve’s potential easing in its May or June meetings, the EUR/USD pair found the opportunity to climb back to the 1.0780 level. This move is further supported by Fed Chair Jerome Powell’s remarks on a cautious approach to interest rate adjustments and Minneapolis Fed Neel Kashkari’s openness to evaluating data before rate cuts, hinting at 2-3 adjustments this year. Meanwhile, the European Central Bank (ECB) Board member Isabel Schnabel highlights the critical phase of monetary policy adjustment in the EU, advocating for prudence amidst challenging economic signals. This juxtaposition of the Fed’s easing potential and the ECB’s cautious stance contributes to the current dynamics of the EUR/USD exchange rate.
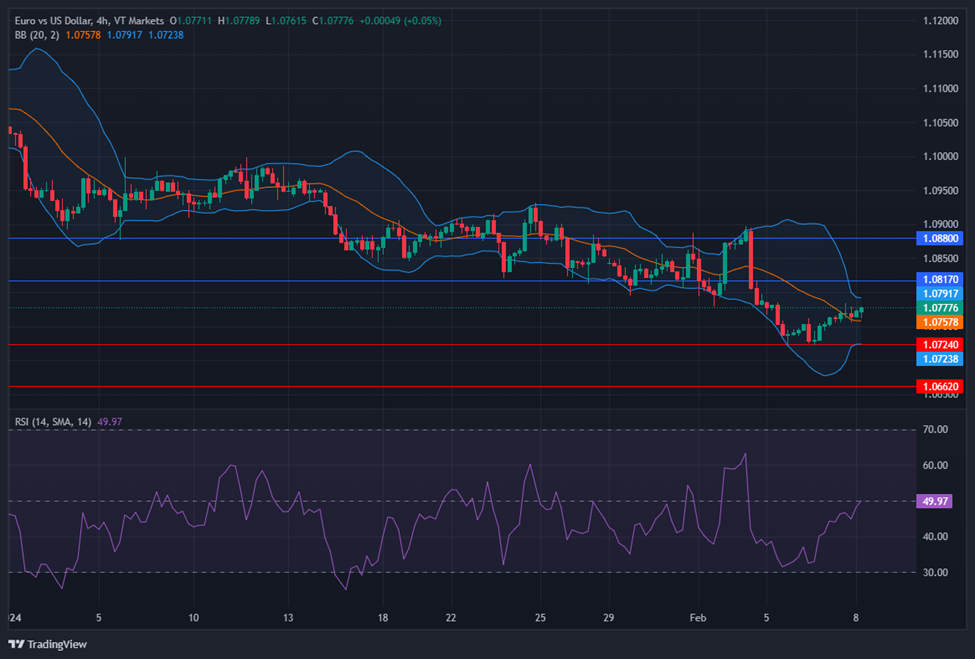
On Wednesday, the EUR/USD moved higher and able to reach above the middle band of the Bollinger Bands. Currently, the price is moving just above the middle band with narrower bands, suggesting a potential slightly upward movement to reach the upper band. Notably, the Relative Strength Index (RSI) maintains its position at 49, signaling a neutral outlook for this currency pair.
Resistance: 1.0817, 1.0880
Support: 1.0724, 1.0662
XAU/USD (4 Hours)
XAU/USD Rise Amid Weakening US Dollar and Static Treasury Yields
Gold (XAU/USD) experienced a notable increase, reaching $2,044.64, driven by a combination of Wall Street’s positive momentum and a weakening US Dollar, which struggled throughout the day due to a lack of significant market events. This shift came as investors adjusted their positions following recent announcements from major central banks, which tempered expectations for rate cuts. Despite optimistic remarks from Federal Reserve officials on inflation trends, caution was advised against premature policy adjustments. Concurrently, a decrease in early gains for US Treasury yields, with the 10-year note dropping slightly to 4.09%, contributed to the Dollar’s underperformance, further bolstering gold’s appeal.
On Wednesday, XAU/USD moved higher and was able to reach the upper band of the Bollinger Bands. Currently, the price is moving slightly above the middle band, suggesting a potential upward movement to reach back to the upper band. The Relative Strength Index (RSI) stands at 52, signaling a neutral outlook for this pair.
Sydney, Australia, February 7, 2024 – VT Markets, a leading global multi-asset broker, is proud to announce Financial Commission (FC) approval, marking a robust start to the year 2024. By achieving the status of an Approved Broker Member of the Financial Commission, VT Markets elevates its commitment to providing clients with enhanced services, including protection by the Commission’s Compensation Fund for up to €20,000 per case. The Financial Commission, recognized as a renowned independent external dispute resolution (EDR) forum, specializes in addressing concerns within the FX and CFD trading sphere.
The Financial Commission serves as a vital platform, offering unbiased third-party mediation for broker member firms and traders, particularly in situations where direct resolution is challenging. Highlighting its commitment to delivering a fair and efficient dispute resolution process, the Financial Commission facilitates prompt resolution for both approved members and their clients engaged in CFDs, forex, and cryptocurrency markets.
VT Markets, with a steadfast dedication to offering the highest level of service, is excited about the new opportunities this membership brings. The recognition as an Approved Broker Member, effective from January 30, 2024, underscores VT Markets’ commitment to upholding industry standards and ensuring that traders receive services of the highest quality.
In addition to solidifying its position with the Financial Commission, VT Markets continues to innovate and expand its offerings. The company is poised for further growth in 2024, with plans to explore and extend services to additional markets. Traders can expect continued excellence and a broadened range of opportunities with VT Markets.
About VT Markets:
VT Markets is a regulated multi-asset broker with a presence in over 160 countries. To date, it has won numerous international accolades including Best Customer Service and Fastest Growing Broker.
In line with its mission to make trading accessible to all, VT Markets currently offers unfettered access to over 1,000 financial instruments and a seamless trading experience via its award-winning mobile app.
For more information, please visit the official VT Markets website or email them at info@vtmarkets.com. Alternatively, follow VT Markets on Facebook, Instagram, or LinkedIn.
For media enquiries and sponsorship opportunities, please email media@vtmarkets.com.
Please note that the dividends of the following products will be adjusted accordingly. Index dividends will be executed separately through a balance statement directly to your trading account, and the comment will be in the following format “Div & Product Name & Net Volume ”.
Please refer to the table below for more details:
The above data is for reference only, please refer to the MT4/MT5 software for specific data.
If you’d like more information, please don’t hesitate to contact info@vtmarkets.com.
Smart Vision Summit Oman 2024, the largest conference on investment in the Middle East, unites leaders in finance, investment, and fintech. With keynotes, panels, workshops, and networking, it’s a platform for sharing insights, exploring trends, and exchanging ideas. Open to investors, professionals, entrepreneurs, and enthusiasts, the event covers topics like investment strategies, market trends, technology, risk management, and regulatory updates. Attendees gain insights, discover opportunities, and stay ahead in this dynamic industry.
On Tuesday, the stock market witnessed modest gains, driven by positive corporate earnings and the investors’ assessment of future Federal Reserve rate cuts. The S&P 500, Nasdaq Composite, and Dow Jones Industrial Average all saw increases, with standout performances from Palantir Technologies and Spotify Technology after reporting strong quarterly revenues. Despite the optimism from earnings, Federal Reserve Chair Jerome Powell’s remarks have cooled expectations for an immediate rate cut, hinting at a possible delay. This cautious optimism was mirrored in the currency market, where the dollar dipped slightly amidst varying signals from Fed officials and global economic updates. Notably, Treasury yields corrected after a recent surge, influencing currency movements and reflecting the market’s nuanced reaction to inflation concerns, Fed policy expectations, and international economic indicators.
Stock Market Updates
On Tuesday, the stock market experienced gains as investors weighed the latest corporate earnings against expectations for future interest rate cuts by the Federal Reserve. The S&P 500 saw a slight increase of 0.23%, closing at 4,954.23, while the Nasdaq Composite edged up 0.07% to 15,609.00. The Dow Jones Industrial Average experienced a more notable rise, adding 141.24 points or 0.37% to finish at 38,521.36. Significant movements were observed in individual stocks, with Palantir Technologies soaring nearly 31% after reporting a revenue beat for the fourth quarter. Similarly, Spotify Technology’s shares climbed almost 4% following its earnings report, which exceeded expectations and showed an increase in Premium subscribers.
Despite the positive momentum from robust earnings among technology giants, recent comments from Federal Reserve Chair Jerome Powell have tempered expectations for an imminent rate cut. Powell suggested that any potential rate reductions might occur later than the market had hoped, pushing back against the anticipation of a March rate cut. This adjustment in expectations comes as the market sees narrow leadership, raising concerns about the sustainability of the current rally without broader market participation. As the earnings season reaches its midpoint, notable companies such as Amgen, Chipotle Mexican Grill, and Ford are poised to release their financial results after the market closes, potentially influencing future market movements.
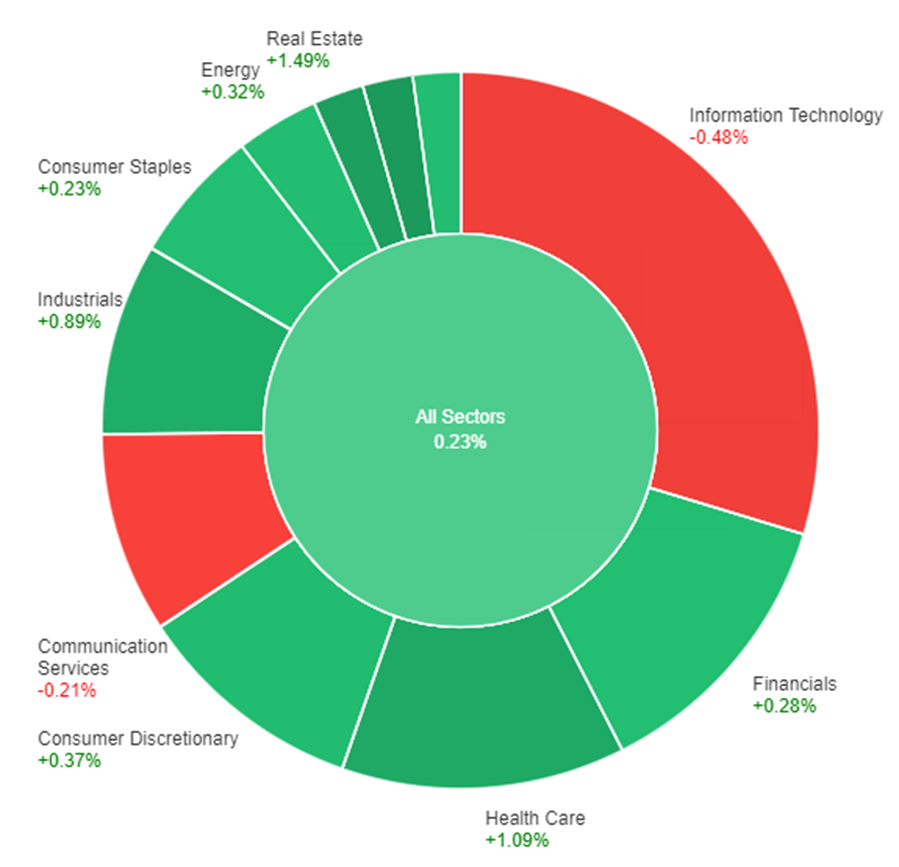
On Tuesday, the overall market saw a modest increase, with all sectors combined going up by 0.23%. The Materials sector led the gains with a notable rise of 1.71%, closely followed by Real Estate and Health Care, which went up by 1.49% and 1.09%, respectively. Industrials also saw a healthy increase, up by 0.89%. Other sectors such as Consumer Discretionary, Energy, Utilities, Financials, and Consumer Staples saw more modest increases, ranging from 0.37% to 0.23%. In contrast, Communication Services and Information Technology experienced declines, down by 0.21% and 0.48% respectively, indicating a mixed performance across different market areas.
Currency Market Updates
In the recent currency market updates, the dollar experienced a slight decline, losing 0.25% against a basket of currencies. It marked a correction following its sharp gains fueled by inflationary pressures evident in U.S. jobs and ISM services reports. This movement in the dollar index was accompanied by a retreat in Treasury yields, which had previously surged but encountered resistance, leading to a correction. The EUR/USD pair managed to recover from early losses, finding support at December’s lows, as the correction in Treasury yields eased the upward pressure on the dollar. This shift comes amid a backdrop of no significant U.S. economic releases, except for the New York Fed’s report on Q4 Household Debt and Credit, which highlighted increasing credit stress among the less creditworthy, even as overall delinquency rates remained lower than pre-pandemic levels.
Further influencing the currency markets, Treasury Secretary Janet Yellen expressed manageable concerns over commercial real estate, while Federal Reserve Bank of Cleveland President Loretta Mester indicated a possibility of gradual rate cuts if inflation continues to decline. The EUR/USD pair also received a boost from a significant rise in German industrial orders, notably influenced by a surge in aircraft orders, despite the broader data suggesting a more nuanced picture. Other currencies like the Sterling saw gains against the dollar, buoyed by improved UK PMI figures and a more risk-friendly market atmosphere, partly due to positive movements in Chinese equities. Meanwhile, the USD/JPY pair corrected after a rapid rise, influenced by Treasury yield adjustments and shifting expectations regarding Fed rate cuts and potential monetary policy adjustments by the Bank of Japan, highlighting the global interconnectedness of currency movements and monetary policies.
Picks of the Day Analysis
EUR/USD (4 Hours)
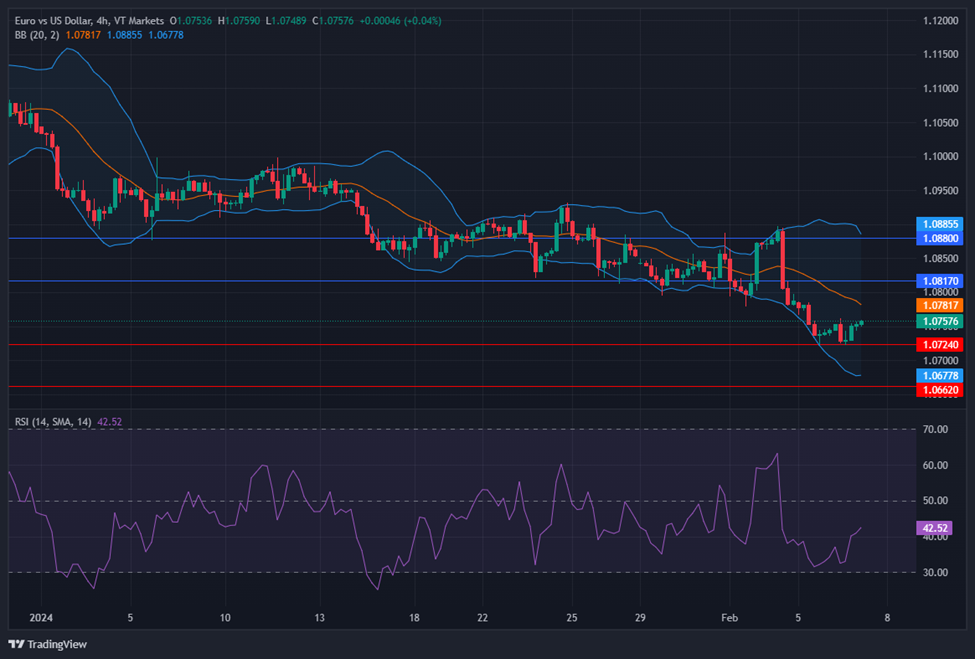
EUR/USD Outlook Amidst US Dollar Fluctuations and Central Bank Decisions
As the US Dollar’s demand declines, the EUR/USD pair may see fluctuations influenced by recent central bank decisions and US economic data. With the Reserve Bank of Australia maintaining a cautious stance and the possibility of delayed rate cuts by the Federal Reserve, investor sentiment shifts, impacting bond yields and the USD’s appeal. Additionally, remarks from Federal Reserve officials, including Loretta Mester, could further influence market dynamics and the EUR/USD trajectory, amidst a lack of significant macroeconomic releases.
On Tuesday, the EUR/USD moved flat between the lower and middle bands of the Bollinger Bands. Currently, the price is moving just below the middle band with wider bands, suggesting a potential upward movement to reach the middle band. Notably, the Relative Strength Index (RSI) maintains its position at 42, signaling a neutral but bearish outlook for this currency pair.
Resistance: 1.0817, 1.0880
Support: 1.0724, 1.0662
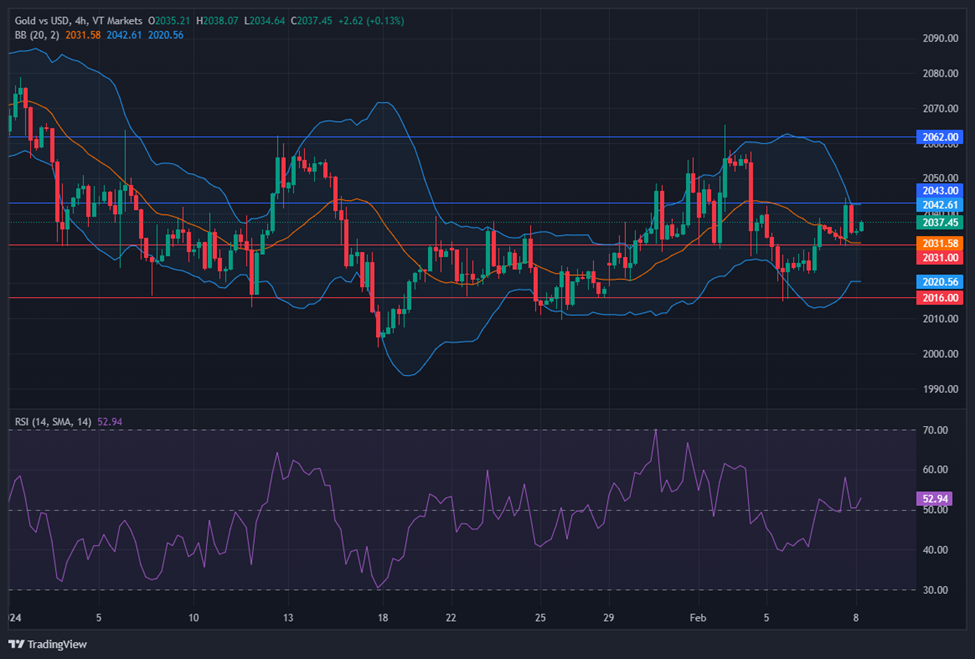
XAU/USD (4 Hours)
XAU/USD Recovers as US Dollar Demand Weakens Amid Central Bank Caution
Spot Gold (XAU/USD) experienced a recovery on Monday, trading near an intraday high of $2,038.17, as demand for the US Dollar waned following global central bankers’ hints at maintaining current monetary policies, contrary to earlier investor expectations for tighter monetary conditions. This shift came after the Reserve Bank of Australia signaled a possible continuation of rate hikes if necessary, aligning with cautious sentiments from other central banks. Despite strong US macroeconomic data supporting the Dollar and boosting government bond yields, a subsequent rally in bonds and a retreat in yields by Tuesday signaled a market repositioning that favored Gold. This adjustment occurs in a week’s light on macroeconomic announcements but with anticipated comments from Federal Reserve officials, including Loretta Mester.
On Tuesday, XAU/USD moved higher and was able to reach the middle band of the Bollinger Bands. Currently, the price is moving slightly below the middle band, suggesting a potential upward movement to reach the upper band. The Relative Strength Index (RSI) stands at 51, signaling a neutral outlook for this pair.
Please note that the dividends of the following products will be adjusted accordingly. Index dividends will be executed separately through a balance statement directly to your trading account, and the comment will be in the following format “Div & Product Name & Net Volume ”.
Please refer to the table below for more details:
The above data is for reference only, please refer to the MT4/MT5 software for specific data.
If you’d like more information, please don’t hesitate to contact info@vtmarkets.com.