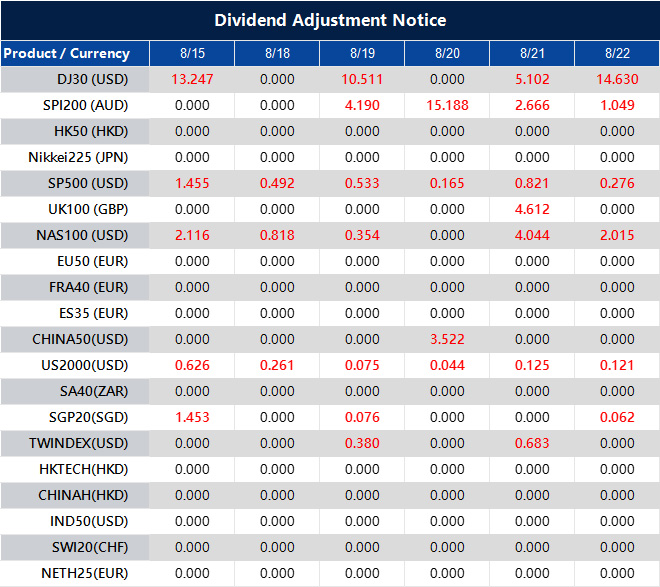
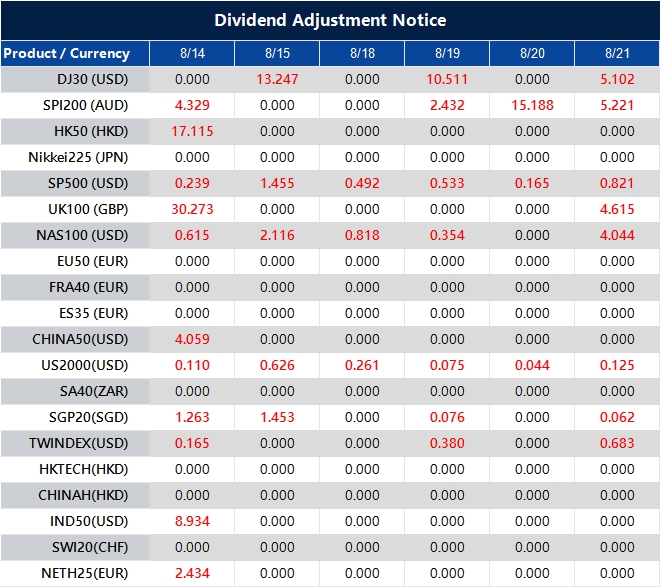
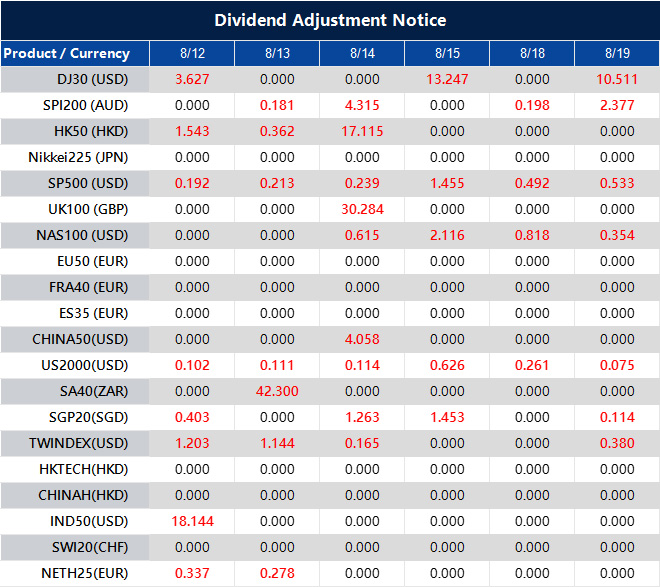
Please note that the dividends of the following products will be adjusted accordingly. Index dividends will be executed separately through a balance statement directly to your trading account, and the comment will be in the following format “Div & Product Name & Net Volume”.
Please refer to the table below for more details:
The above data is for reference only, please refer to the MT4/MT5 software for specific data.
If you’d like more information, please don’t hesitate to contact info@vtmarkets.com.
When traders talk about the big names in global stock markets, the DAX 40 is often near the top of the list. Known as Germany’s leading index, it represents the strength of Europe’s largest economy and is closely watched by investors around the world.
Whether you are completely new to trading or already exploring global indices, understanding the DAX 40 can open up exciting opportunities.
What is the DAX 40?
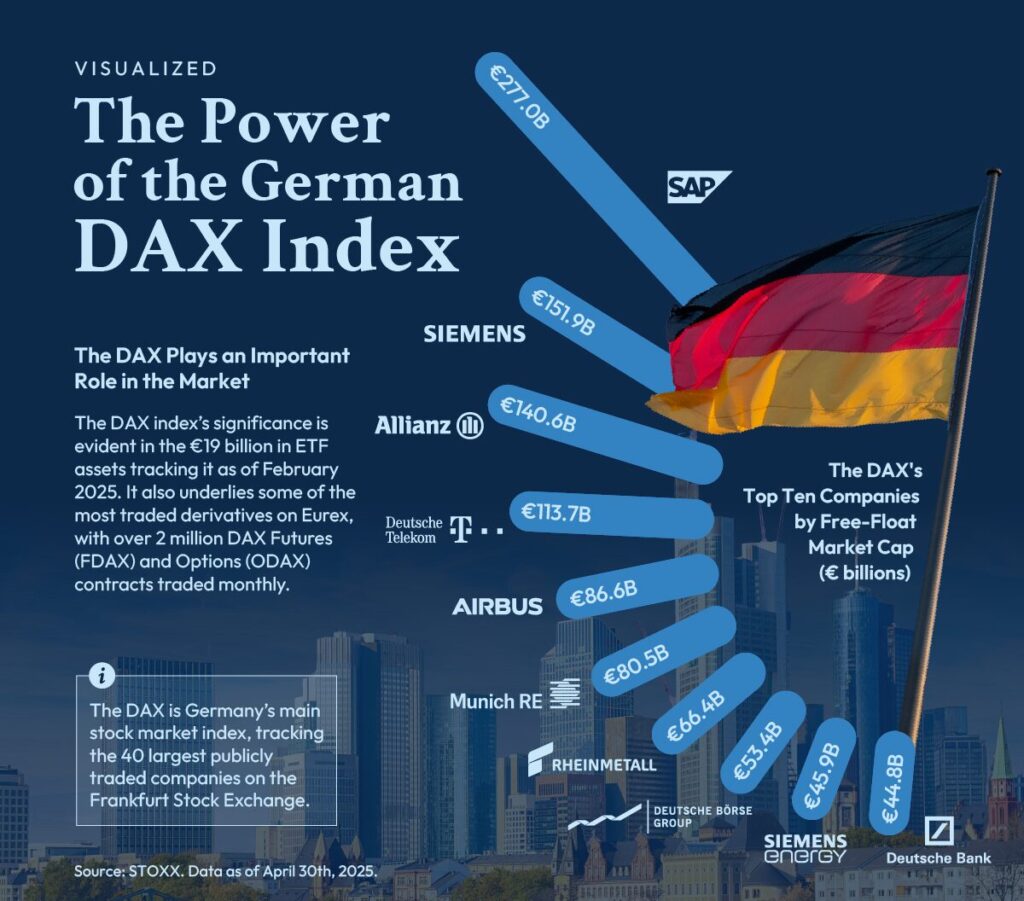
The DAX 40, short for Deutscher Aktienindex, is Germany’s benchmark stock index. It tracks the performance of the 40 largest and most actively traded companies listed on the Frankfurt Stock Exchange.
These companies represent a wide cross-section of industries – from automotive and finance to technology and chemicals.
Household names such as Siemens, BMW, Allianz, and SAP are all part of the DAX. As such, it provides a clear snapshot of how Germany’s corporate giants are performing.
To put the DAX into context, you can think of it as Europe’s equivalent of the S&P 500 in the United States or the FTSE 100 in the United Kingdom. Like those indices, it is not only a measure of economic strength but also a tradable instrument in its own right.
Why traders pay attention to the DAX 40
There are two key reasons why traders worldwide keep a close eye on the DAX: volatility and influence.
Firstly, the DAX is known for its volatility. This means prices can move significantly within a single trading session, creating opportunities for both short- and medium-term traders. Liquidity is also strong, which makes it easier to enter and exit positions without large price slippage.
Secondly, the index reflects more than just German companies. Germany is the largest economy in Europe, so the DAX acts as a proxy for European economic health. It often responds not only to local data but also to global events.
For instance, an interest rate decision by the European Central Bank (ECB) or a policy shift by the US Federal Reserve can send the DAX moving sharply in either direction.
How the DAX 40 is traded
Unlike buying a single company’s stock, trading the DAX means speculating on the overall direction of the index. There are several ways to do this:
Contracts for Difference (CFDs): The most accessible route for retail traders. With CFDs, you can go long (buy) if you expect the DAX to rise, or go short (sell) if you expect it to fall.
Futures and options: More advanced financial instruments, often used by institutional or experienced traders.
Exchange-traded funds (ETFs): A simpler option for longer-term investors who want to track the index without active trading.
For example, imagine that Germany reports stronger-than-expected car manufacturing data, boosting confidence in BMW and Volkswagen. A trader could speculate that the DAX will rise and open a long CFD position. Conversely, if weak industrial output is reported, the same trader might choose to short the index.
Factors influencing the DAX 40
The DAX is sensitive to a wide range of factors. For new traders, understanding what drives its movements is crucial:
Economic data: German GDP growth, unemployment figures, and manufacturing PMI reports can all affect the index.
European Central Bank policy: Decisions on interest rates or bond-buying programmes often have a direct impact on European equities.
Global events: As a highly industrialised economy, Germany is vulnerable to changes in energy prices, trade tensions, and geopolitical risks.
Company earnings: Results from large firms such as Siemens, Volkswagen, or SAP can move the index noticeably.
For instance, a sharp rise in oil and gas prices could weigh heavily on energy-dependent German industries, dragging down the DAX overall. On the other hand, positive quarterly results from several leading companies can lift the index, even in the face of broader economic uncertainty.
Practical strategies for trading the DAX 40
When it comes to trading the DAX, beginners should focus on simple, structured strategies that balance opportunity with risk control.
Trend following: Many traders use moving averages, such as the 50-day or 200-day, to identify the overall direction. If the index is trading above a moving average, it may suggest a bullish trend; below it may suggest bearish momentum.
Breakout trading: The DAX often respects clear support and resistance levels. Traders can look for price to “break out” of these ranges, signalling a potential strong move.
News-based trading: Given its sensitivity to announcements, trading around ECB meetings, major corporate earnings, or global economic updates can present opportunities.
Risk management is non-negotiable. Stop-loss orders should always be used to protect against sudden reversals. Position sizes should remain small enough that a single losing trade does not damage your account significantly.
Finally, practising on a demo account before moving to live trading is strongly recommended. It allows beginners to learn how the DAX behaves without putting real money at risk.
Risks and things to keep in mind
The DAX’s volatility makes it exciting, but also risky. Price moves can be sharp and sudden, particularly during economic announcements.
Leverage – a feature of CFDs – can magnify gains but also magnify losses. Traders should therefore use it cautiously.
The index is most active during European and US trading hours, which is when liquidity and volatility are at their peak.
Above all, discipline and emotional control are vital. Sticking to a clear plan helps prevent impulsive decisions.
Conclusion
The DAX 40 is more than just Germany’s leading stock index – it is a powerful reflection of European economic health and a dynamic trading instrument in its own right. For new traders, it offers exposure to multiple sectors, regular price movement, and plenty of opportunities to learn.
The key is to start small, practise diligently, and always manage risk. Ready to put your knowledge into action? Open a live account with VT Markets today and experience trading the DAX 40 with professional tools, competitive spreads, and dedicated support.
Written on August 14, 2025 at 11:22 am, by valerie
Gold is treading carefully as investors favour equities over safe havens, keeping its momentum in check. This analysis looks at the forces behind gold’s range-bound trade, key technical levels, and the factors that could spark its next decisive move.
Equity markets draw investor attention
Gold eased on Thursday as investors redirected capital towards equities, lifting US stock indices and reducing demand for traditional safe-haven assets.
US stocks ended higher, with the S&P 500 and Nasdaq hitting record closing highs for the second straight day, buoyed by increasing confidence that the Fed was getting closer to cutting interest rates https://t.co/UzdBHHEXsLpic.twitter.com/DVtsfbJ0U0
Fresh US CPI figures showed no change in consumer prices for the month, reinforcing market expectations for a 25-basis-point interest rate cut in September – now fully priced in by traders.
Federal Reserve Bank of Atlanta President Raphael Bostic said he continues to see one interest-rate cut as appropriate in 2025 if the labor market remains solid https://t.co/UpE1piPDqH
According to our research desk, even as US Treasury yields edge lower, the rotation into risk assets has limited bullion’s upside potential.
Earlier-year strength, fuelled by economic uncertainty and elevated inflation fears, has faded as markets turn towards higher-growth opportunities.
Technical analysis
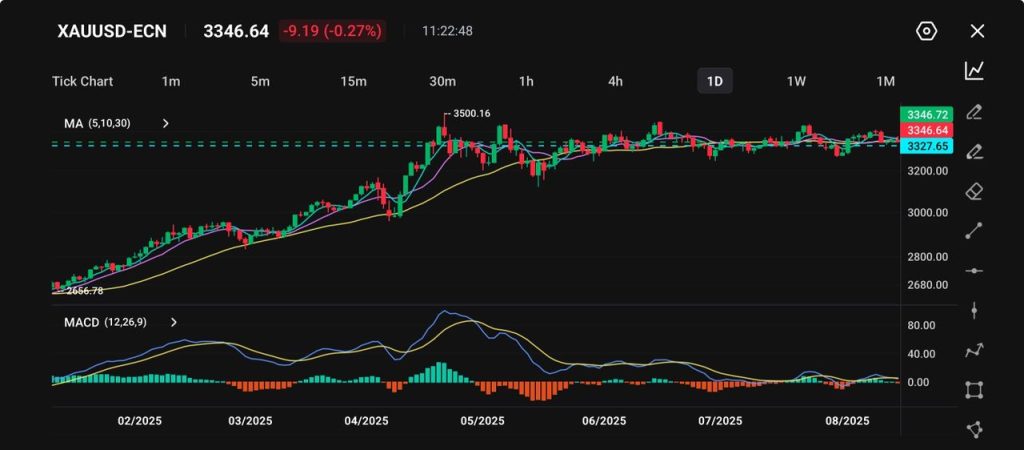
Gold (XAU/USD) remains locked in a sideways range between roughly $3,250 and $3,400, repeatedly testing both support and resistance but showing no decisive breakout.
Picture: XAU/USD trades around 3,346, holding in a tight range after months of sideways movement, shown on the VT Markets app.
Short-term moving averages have flattened, signalling a lack of directional bias, while the MACD remains close to the zero line, underlining market indecision.
In the near term, a sustained close above $3,400 could open the way for a retest of the $3,500 high, while a drop below $3,250 would bring the $3,150 region into focus.
Until either level is breached, gold is likely to continue consolidating, with traders closely tracking US inflation updates and shifts in interest rate expectations for a potential breakout trigger.
Cautious forecast
A decisive break above $3,400 would strengthen the technical case for a move back towards $3,500, particularly if supported by dovish central bank signals or a resurgence in safe-haven demand.
However, without a new macroeconomic driver, gold faces the risk of remaining range-bound or slipping towards the $3,300 mark.
Risk-on sentiment in equities continues to be the primary obstacle to an upside breakout. This is reinforced by investor appetite for higher-yielding opportunities, which reduces the urgency to hold non-yielding assets like gold.
Unless geopolitical tensions flare up or economic data sparks renewed uncertainty, XAU/USD is more likely to drift sideways, with only short-lived rallies emerging on market dips.
Please note that the dividends of the following products will be adjusted accordingly. Index dividends will be executed separately through a balance statement directly to your trading account, and the comment will be in the following format “Div & Product Name & Net Volume”.
Please refer to the table below for more details:
The above data is for reference only, please refer to the MT4/MT5 software for specific data.
If you’d like more information, please don’t hesitate to contact info@vtmarkets.com.
Ethereum is back in the spotlight as renewed optimism lifts the cryptocurrency market. Strong institutional interest, upbeat sentiment, and supportive technical trends are fuelling momentum, with traders watching for the next breakout that could shape the weeks ahead.
Market overview
The cryptocurrency market started the week on solid ground, supported by strong capital inflows and a noticeable improvement in investor sentiment.
Spot Ether ETFs recorded an impressive $1.01 billion in daily net inflows, while Ethereum’s total value locked (TVL) climbed past $90 billion – both clear signals of growing institutional interest in ETH. This momentum mirrors a bullish positioning trend across multiple asset classes, reinforcing a risk-on mood.
$BTC topped $120,000 on Monday, trading near record highs.
Investor enthusiasm and momentum around crypto grew amid Trump's recent Fed nomination and executive order allowing crypto investment in 401(k) retirement plans. https://t.co/7szfB2N6nY
Bitcoin is trading at $119,335, with high-profile forecasts suggesting a potential year-end target of $150,000.
Given the historical Bitcoin-Ethereum correlation, traders and analysts expect ETH price action to follow suit.
Currently, ETH/USD is steady at $4,622.06, marking a modest daily rise of $3.36 (0.07%) and staying within striking distance of its November 2021 high at $4,878.
This rally builds on the April low of $1,399.39 and gained additional momentum after the early-August breakout above the $4,300 resistance zone.
The bullish narrative was further boosted by news that BitMine Immersion Technologies plans to raise up to $20 billion for Ethereum acquisitions.
Historically, Ethereum’s market capitalisation has averaged 30%–35% of Bitcoin’s during previous crypto bull runs. If Bitcoin reaches the $150,000 mark, that ratio would project ETH towards $8,656.
Even a more conservative 21.7%–30% correlation would still suggest an Ethereum price range of $5,376–$7,420 in the current market cycle.
Technical analysis
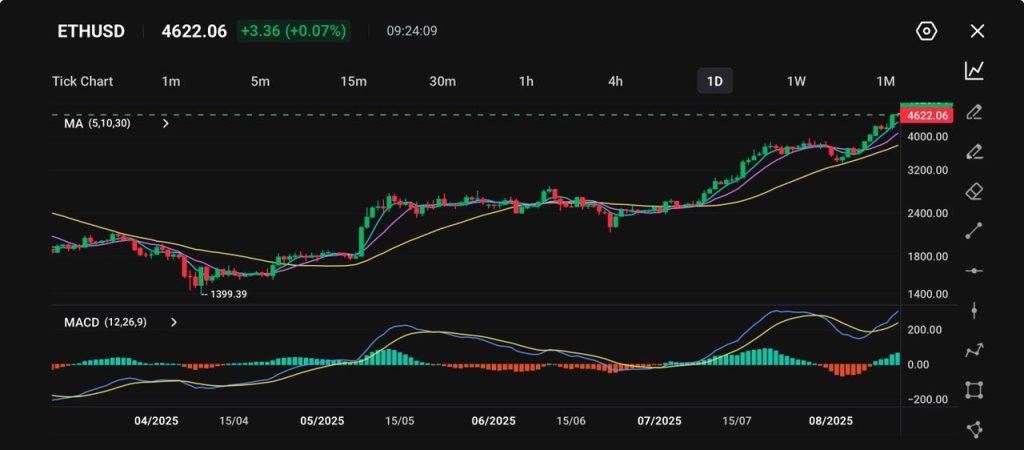
Ethereum (ETH/USD) has staged a strong recovery since its April through near $1,399, breaking through multiple resistance levels and recently reaching $4,622.
Picture: ETH/USD holds near 4,622 as bullish momentum builds, shown on the VT Markets app.
The ETH chart shows a pattern of consistent higher highs and higher lows, with price action firmly above both short-term and medium-term moving averages – a classic bullish structure in crypto technical analysis.
The MACD indicator supports this positive trend, with a widening gap between the MACD and signal lines, signalling sustained buying pressure.
In the near term, the $4,620–$4,650 range acts as the immediate resistance zone to watch. A confirmed breakout could pave the way for a test of the psychologically important $5,000 level.
On the downside, initial Ethereum support sits near $4,200, with a stronger support level around $3,800.
Overall, the bias remains bullish as long as ETH price holds above its rising 30-day moving average, maintaining upward momentum in the broader cryptocurrency market.
Cautious forecast
A decisive daily close above $4,878 would likely serve as a strong bullish breakout signal for Ethereum, opening the door to a test of the psychological $5,000 level.
If positive sentiment persists in the cryptocurrency market, Bitcoin price momentum continues towards $150,000, and spot Ether ETF inflows remain solid, ETH/USD could extend its rally into the $5,376–$7,420 range.
This projection aligns with historical Ethereum-to-Bitcoin market capitalisation ratios observed during previous crypto bull cycles.
Sustained institutional demand and increased retail participation could further fuel buying pressure, pushing Ethereum price action closer to a potential all-time high.
However, if ETH fails to reclaim the 2021 peak, the bullish outlook may weaken. A slowdown in ETF inflows, shifting Bitcoin-Ethereum correlation, or a broader risk-off move in global markets could trigger a price correction.
In that case, initial Ethereum support is expected near $4,480, with a stronger technical floor around $4,300.
Such a retracement could be a healthy consolidation phase within the broader uptrend, potentially setting the stage for Ethereum’s next leg higher in the current market cycle.
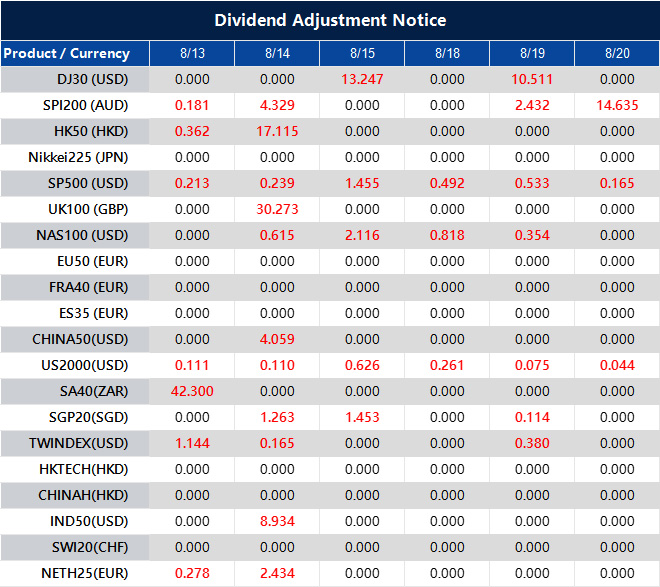
Please note that the dividends of the following products will be adjusted accordingly. Index dividends will be executed separately through a balance statement directly to your trading account, and the comment will be in the following format “Div & Product Name & Net Volume”.
Please refer to the table below for more details:
The above data is for reference only, please refer to the MT4/MT5 software for specific data.
If you’d like more information, please don’t hesitate to contact info@vtmarkets.com.
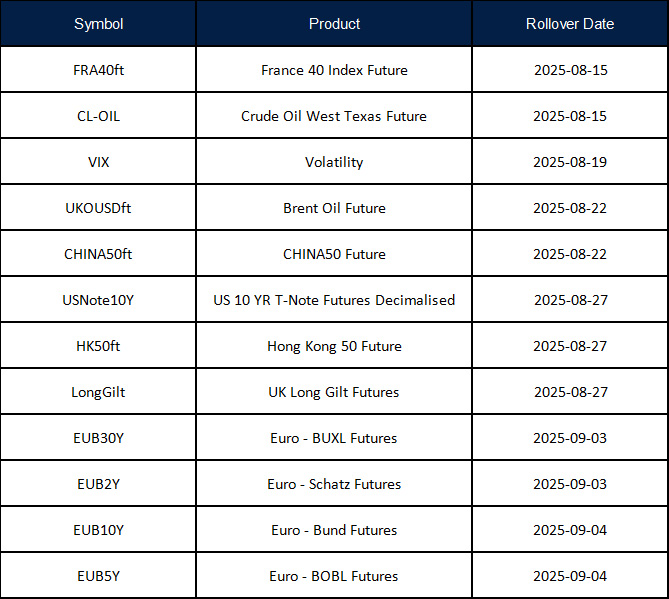
New contracts will automatically be rolled over as follows:
Please note:
• The rollover will be automatic, and any existing open positions will remain open.
• Positions that are open on the expiration date will be adjusted via a rollover charge or credit to reflect the price difference between the expiring and new contracts.
• To avoid CFD rollovers, clients can choose to close any open CFD positions prior to the expiration date.
• Please ensure that all take-profit and stop-loss settings are adjusted before the rollover occurs.
• All internal transfers for accounts under the same name will be prohibited during the first and last 30 minutes of the trading hours on the rollover dates.
If you’d like more information, please don’t hesitate to contact info@vtmarkets.com.
The pound is holding steady against the dollar as traders await key economic data and central bank guidance. Momentum is showing signs of recovery, but sentiment remains mixed amid uncertainty over the UK’s growth outlook and US rate expectations.
Pound steadies as traders eye data and policy signals
The GBP/USD pair is holding firm after a recent pullback, showing resilience ahead of key economic data releases.
On the daily chart, the pair has rebounded from the 1.3000 support level, with the 5, 10, and 30-day moving averages converging and the MACD histogram turning positive – pointing to a potential shift back in favour of buyers.
This recovery follows a strong rally from February’s low near 1.21, which was briefly interrupted by July’s correction.
Global market sentiment has been mixed. Japanese stocks have reached record highs after a 90-day extension to the US–China tariff truce, easing immediate trade tensions.
Australian equities remain close to their peaks, although the Australian dollar dipped after the Reserve Bank of Australia implemented a widely expected 25-basis-point rate cut.
For sterling, attention now turns to upcoming UK labour market data. Average pay growth in July is expected to remain steady at 5%, but hiring intentions have fallen to their weakest level since the COVID-19 pandemic, and starting salaries are rising at their slowest pace in more than four years.
Within the Bank of England, policy direction remains split – four of nine members opposed last week’s 25-basis-point cut to 4% – and markets have largely priced out the chance of another cut this year, a factor that could lend near-term support to the pound.
Still, speculative sentiment remains cautious. Commodity Futures Trading Commission data shows $2.78 billion in net short positions against the pound, a reversal from the optimism seen earlier in the year.
This shift reflects lingering doubts about the UK economy’s strength and its ability to sustain sterling’s 7% year-to-date rise.
In the US, the upcoming inflation report will be critical. Traders will be watching for signs of how tariffs under President Trump are affecting consumer prices, as well as any implications for the Federal Reserve’s interest rate path.
A stronger-than-expected reading could limit expectations for further rate cuts, potentially lifting the dollar and capping gains in GBP/USD.
Technical analysis
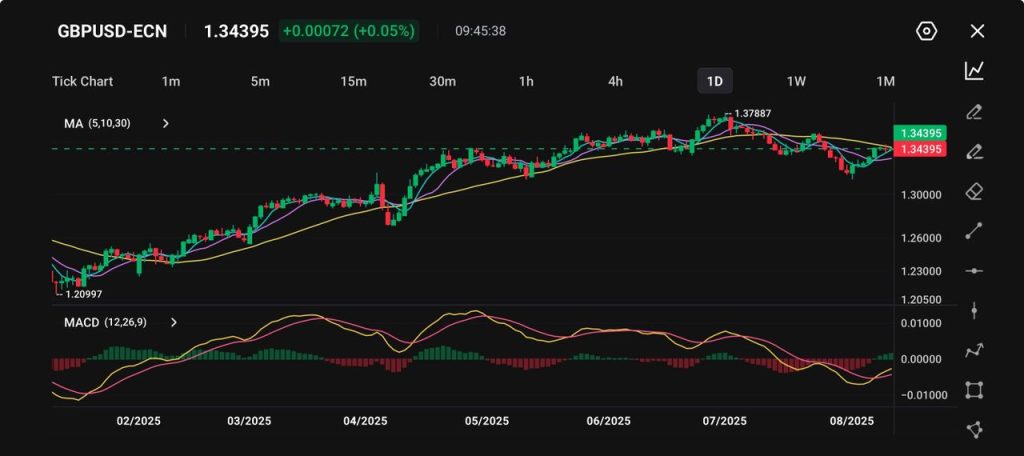
Since February 2025, GBP/USD has been trending higher, climbing from around 1.21 to a July peak near 1.378 before easing back to the 1.30 area.
The latest recovery has brought the pair close to 1.344, with short-term moving averages beginning to turn upwards, hinting at renewed bullish momentum.
Picture: GBP/USD rebounds toward 1.344 with moving averages converging and MACD momentum turning positive, as shown on the VT Markets app.
The MACD indicator is edging towards a bullish crossover, which could be confirmed if the pair holds above the 1.3400 level. Immediate resistance lies at 1.345–1.350, with a break higher potentially opening the way to 1.3550.
Failure to clear this zone may trigger a move back towards 1.3300 support. Price action in the coming sessions will likely be driven by US CPI data and any shifts in BoE policy expectations.
Cautious forecast
In the near term, GBP/USD appears to have room for further gains towards the 1.3500 level if UK labour market data meets or beats expectations and US inflation comes in below forecasts.
This scenario would support a more optimistic view on the pound, especially if it reinforces the idea that the Bank of England will hold rates steady for the rest of the year.
However, risks remain firmly in play. A stronger-than-expected US inflation print could revive dollar demand, particularly if it prompts markets to scale back expectations for Fed rate cuts.
Similarly, any signs of weakening UK growth – whether through disappointing job figures, slowing wage growth, or softer business sentiment – could undermine recent sterling gains.
Traders should also be mindful of broader market factors such as shifts in global risk appetite, which can amplify currency volatility.
Overall, while the technical setup hints at further upside, the pound’s next move will depend heavily on how macroeconomic data aligns with market expectations over the coming week. Caution, rather than conviction, is likely to define short-term positioning.
Please note that the dividends of the following products will be adjusted accordingly. Index dividends will be executed separately through a balance statement directly to your trading account, and the comment will be in the following format “Div & Product Name & Net Volume”.
Please refer to the table below for more details:
The above data is for reference only, please refer to the MT4/MT5 software for specific data.
If you’d like more information, please don’t hesitate to contact info@vtmarkets.com.
The US dollar is in a period of uncertainty, with markets awaiting key economic data and policy updates that could decide whether it regains strength or continues to weaken.
Dollar index struggles to find direction
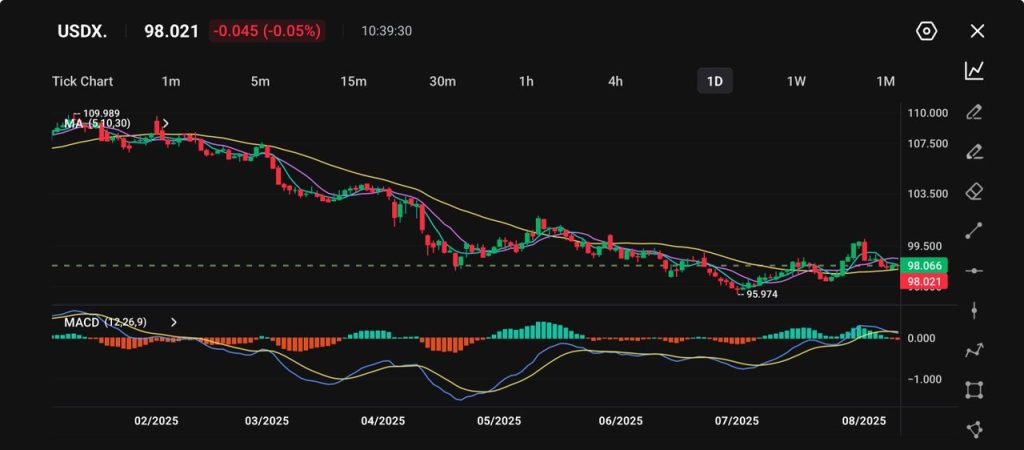
The US dollar index (USDX) continued its downward trend, slipping to 98.02, down 0.05% during the day following a 0.4% decline last week.
Since reaching a peak near 110 in February, the index has dropped more than 10%, hitting a low of 95.97 in June.
An attempted rebound in late July lost momentum, with the index now consolidating within a range bounded by support at 97.50 and resistance at 99.50.
The 30-day moving average is currently acting as a ceiling, limiting any upward movement.
Picture: USDX retreats to 98.021, testing key support levels after extended decline from 109+ highs, with MACD showing mixed signals on the VT Markets app.
The daily MACD indicator has flattened close to the zero line, signalling that downward pressure is easing but with no clear signs of a bullish reversal yet.
Should inflation data surprise to the upside, a rally towards the key 100.00 psychological level could follow, whereas a softer reading may lead to a test of the June lows once more.
Markets await key data and policy developments
This week’s economic and geopolitical developments are set to shape the dollar’s near-term direction.
The upcoming US CPI figures will influence expectations around the Federal Reserve’s monetary policy decisions, while the August 12 deadline for US-China tariff talks adds pressure to global trade relations.
Stocks and currencies in developing markets are moving higher, bolstered by a weaker dollar as traders focus on data in the US which could further cement bets on interest-rate cuts by the Federal Reserve https://t.co/OL363mmlat
Recent news that Nvidia (NVDA) and AMD (AMD) have agreed to contribute 15% of their China revenue to the US government might ease tensions and increase the likelihood of a 90-day extension on tariffs.
On the geopolitical scene, a Russia-US summit planned for Friday introduces further uncertainty.
In parallel, the cryptocurrency market surged after President Trump’s executive order allowed cryptocurrency holdings in US retirement accounts, with Bitcoin rising 3% to $121,909 and Ether gaining 2.1% to $4,307.
A cautious market outlook
With the USDX hovering near multi-month lows and heightened volatility risk, short-term price action will largely depend on inflation data and trade-related announcements.
A daily close above 99.50 would mark the first break above the 30-day moving average since May, potentially signalling a momentum shift.
Conversely, failure to maintain support at 97.50 could intensify selling pressure, pushing the index back down towards the June low of 95.97.