


Find us at booth 64 at ICE Kraków Congress Centre!
Europe’s premier annual event in stocks, currencies, commodities, cryptocurrencies, and funds. One of Europe’s largest gatherings, it unites experts, industry representatives, and clients for conferences, fairs, and networking opportunities, offering a wealth of knowledge and emotions in the investment sector.
Tech stocks lead market downturn as Apple sales dip, while some companies post gains
Stocks faced a downturn for the second consecutive session, driven by declines in major technology firms like Apple, which saw nearly a 3% drop following a report of decreased iPhone sales in China, leading the Nasdaq Composite down by 1.65%. The Dow Jones and S&P 500 also experienced significant losses. Despite the broader tech sector’s struggles, companies such as Target and AeroVironment outperformed expectations, showcasing resilience amidst market reassessment of recent highs driven by AI optimism. Bitcoin’s volatility highlighted the fluctuating nature of digital currencies. Meanwhile, the currency market reacted to weaker-than-expected US economic data, influencing expectations of the Federal Reserve’s monetary policy, with the dollar showing mixed responses against major currencies as the market anticipates key economic updates and Federal Reserve Chair Jerome Powell’s testimony.
Stock Market Updates
Stocks experienced a downturn for the second consecutive session on Tuesday, led by significant declines in major technology companies like Apple, which contributed to pulling the broader market away from its recent record highs. The Nasdaq Composite saw a notable decrease of 1.65%, closing at 15,939.59, primarily due to the downturn in technology stocks. Similarly, the Dow Jones Industrial Average fell by 404.64 points, or 1.04%, ending the day at 38,585.19, while the S&P 500 dropped by 1.02%, to close at 5,078.65. The decline in Apple’s stock, nearly 3%, was sparked by a report from Counterpoint Research indicating a significant drop in iPhone sales in China during the first six weeks of 2024. Other major tech companies, including Netflix, Microsoft, and Tesla, also faced declines around 3% to nearly 4%, with the S&P 500’s information technology sector leading the downturn with a loss of more than 2%.
Despite the broader tech sell-off, some companies managed to buck the negative trend. Target saw its shares jump 12% following a report of strong holiday-quarter earnings that surpassed Wall Street expectations. Similarly, AeroVironment experienced an almost 28% surge after delivering a positive quarterly report and outlook, which exceeded analyst forecasts. These movements occurred as investors are reassessing the market’s recent surge to all-time highs, fueled by optimism surrounding artificial intelligence. Even with the downturn over the past two sessions, the three major stock averages remain significantly higher for the year. Additionally, Bitcoin reached a new record high on Tuesday, though it quickly retreated into the red after surpassing its peak for the first time in two years, highlighting the volatile nature of digital currencies amidst broader market fluctuations.
Data by Bloomberg
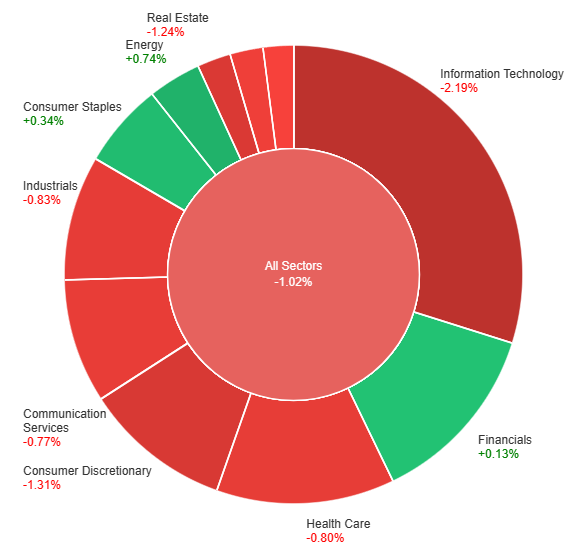
On Tuesday, the market saw an overall downturn, with all sectors combined dropping by 1.02%. Despite this general decline, some sectors managed to post gains; Energy led with a 0.74% increase, followed by Consumer Staples and Financials, which rose by 0.34% and 0.13% respectively. However, the majority of sectors experienced losses, with Utilities, Materials, and Communication Services seeing declines of less than 1%. More significant losses were recorded in Health Care, Industrials, and Real Estate, with Consumer Discretionary and Information Technology facing the steepest drops at -1.31% and -2.19%, respectively, indicating a challenging day for these sectors.
Currency Market Updates
In the latest currency market updates, the USD index experienced a slight decline, down by 0.1% during North American afternoon trading, recovering from more significant losses that ensued after the release of weaker-than-expected factory orders and ISM non-manufacturing data. This weaker data has revived market expectations for a potentially more dovish monetary policy path from the Federal Reserve in 2024. As the market anticipates the forthcoming ADP and JOLTS data, alongside Federal Reserve Chair Jerome Powell’s semi-annual monetary policy testimony before the House Financial Services Committee, current market and Federal Reserve dot plot expectations align closely. However, this equilibrium might shift should forthcoming data indicate a softer economic outlook, or if Powell hints at a decreased hesitancy to lower interest rates, potentially affecting yields and pressuring the dollar downwards.
Amid these developments, major currency pairs have shown varied reactions. The EUR/USD pair saw a modest increase of 0.04% in afternoon trading, staying below its peak following the US data release. The muted response suggests traders are cautious, anticipating that the European Central Bank (ECB) might mirror any significant policy shifts by the Fed. Meanwhile, the USD/JPY pair declined to a low of 149.70 after the release of the soft ISM data, influenced by narrowing U.S.-Japan interest rate differentials, which prompted some dollar selling. The GBP/USD pair notably rallied, breaking significant resistance levels, buoyed by the prospect of diverging monetary policies between the U.S. and the UK, particularly in light of the UK’s high inflation rates. Elsewhere, commodities such as Bitcoin and gold recorded new highs before retracting slightly, benefiting from a dip in global yields and indicating a rising interest in USD alternatives amid the current economic climate.
Picks of the Day Analysis
EUR/USD (4 Hours)
EUR/USD Navigates Uncertain Waters Amid Mixed Central Bank Signals
Following a disappointing US ISM Services PMI report, EUR/USD momentarily reached a two-week high near 1.0880, only to see those gains diminish. Despite a temporary dip, the USD Index (DXY) found some footing, yet remained subdued amid anticipation of Federal Reserve Chair Powell’s testimonies and the upcoming ECB interest rate decision. The currency pair’s fluctuations reflect broader market speculations on future interest rate adjustments by both the Federal Reserve and the European Central Bank, amidst contrasting economic signals from the US and Eurozone. Federal Reserve officials have voiced varying stances on the timing and conditions for rate cuts, reflecting uncertainty in monetary policy directions. Meanwhile, the ECB hints at a possible easing cycle beginning soon, further complicated by mixed inflation data from Europe. These dynamics suggest a potentially stronger dollar in the short term, with EUR/USD possibly facing a downward correction towards its year-to-date lows, amid the backdrop of concurrent monetary easing by both central banks.
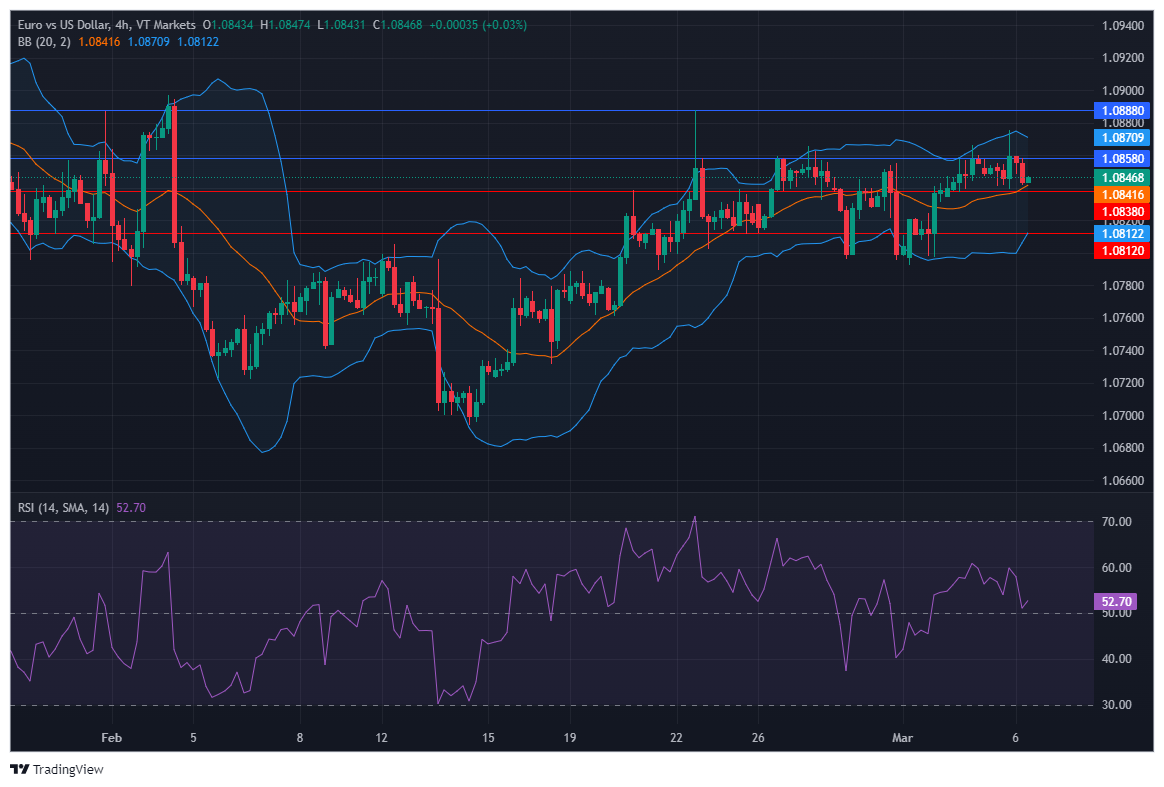
On Tuesday, the EUR/USD moved higher and was able to reach the upper band of the Bollinger Bands. Currently, the price is moving just above the middle band, suggesting a potential upward movement to reach the upper band. Notably, the Relative Strength Index (RSI) maintains its position at 52, signaling a neutral outlook for this currency pair.
Resistance: 1.0858, 1.0888
Support: 1.0838, 1.0812
XAU/USD (4 Hours)
XAU/USD Hits Record High Amid Weak US Economic Data and Stock Market Retreat
On Tuesday, Spot Gold surged to a new all-time peak of $2,141.81, buoyed by a combination of softer-than-expected US economic indicators and a downturn in stock markets. The precious metal’s ascent was particularly sparked by disappointing figures from the Institute for Supply Management (ISM) regarding the services sector and a significant drop in January’s Factory Orders. Moreover, the retreat in US Treasury yields, with the 10-year note dipping to its lowest in a month at 4.14%, alongside declines across major US stock indexes, notably a 1.64% fall in the Nasdaq Composite, further propelled gold’s upward trajectory.
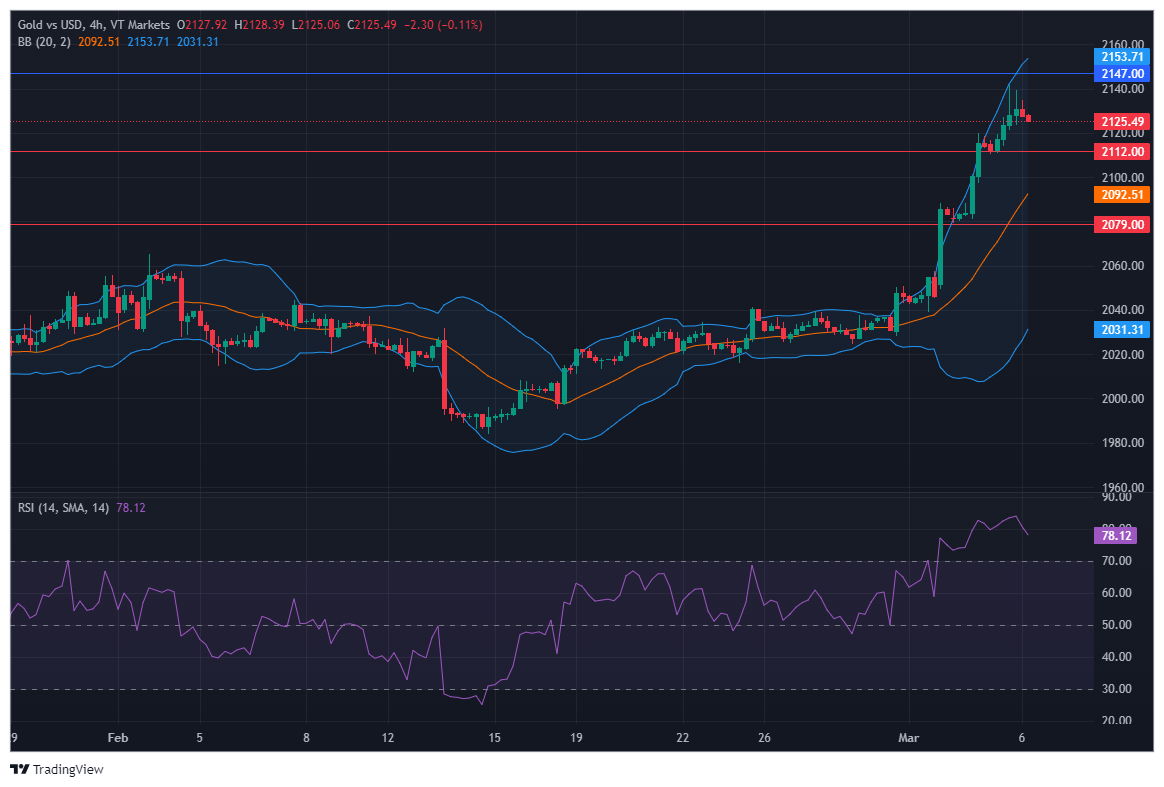
On Tuesday, XAU/USD moved higher to reach the upper band of the Bollinger Bands. Currently, the price is moving just below the upper band, suggesting a potential higher movement to reach above the upper band and reach the resistance level. The Relative Strength Index (RSI) stands at 78, signaling a strong bullish outlook for this pair.
Resistance: $2,147
Support: $2,100, $2,079
Economic Data
| Currency | Data | Time (GMT + 8) | Forecast |
|---|---|---|---|
| AUD | GDP q/q | 08:30 | 0.2% (Actual) |
| USD | ADP Non-Farm Employment Change | 21:15 | 107K |
| GBP | Annual Budget Release | Tentative | |
| CAD | BOC Rate Statement | 22:45 | |
| CAD | Overnight Rate | 22:45 | 5.00% |
| USD | JOLTS Job Openings | 23:00 | 9.03M |
| CAD | BOC Press Conference | 23:30 |
Daylight Saving Time Adjustment Notice – March 5, 2024
Dear Client,
The adjustment of DST will be commencing on March 10th.
Please consider below carefully:
The trading sessions of some products on MT4/MT5 will be changed as follows.
Please find the table below for more information.
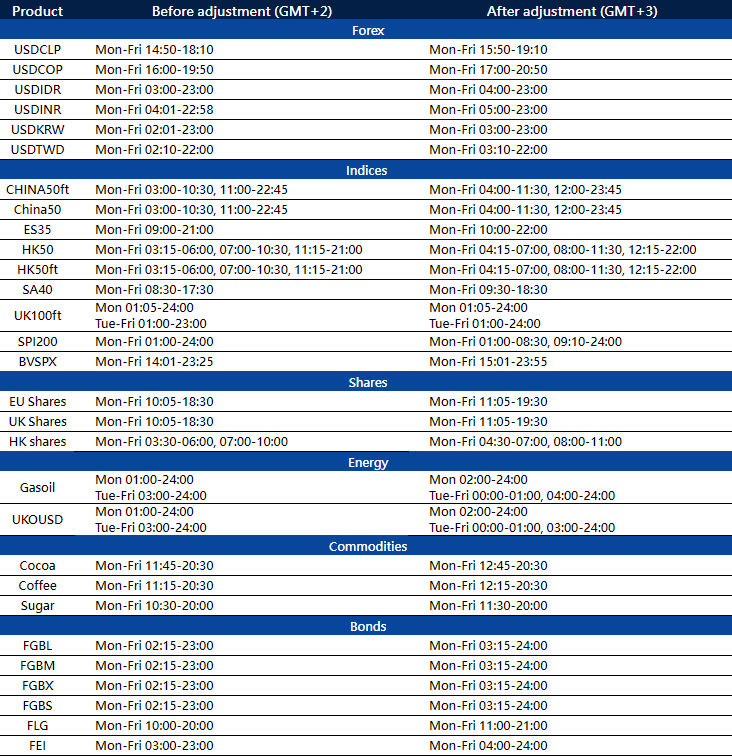
The above data is for reference only, please refer to the MT4/MT5 software for specific data.
If you’d like more information, please don’t hesitate to contact info@vtmarkets.com.
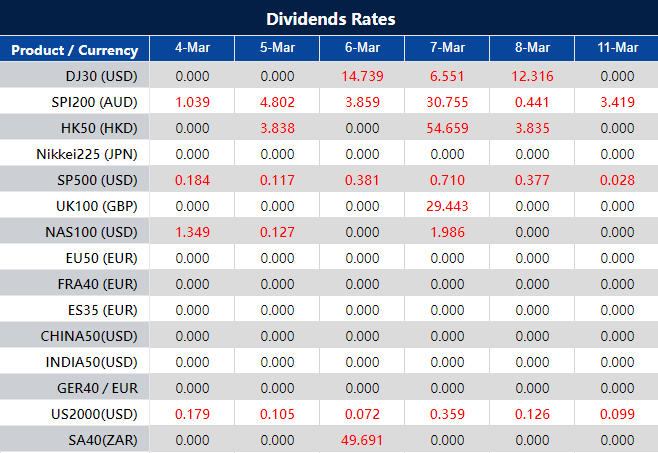
Dividend Adjustment Notice – March 5, 2024
Dear Client,
Please note that the dividends of the following products will be adjusted accordingly. Index dividends will be executed separately through a balance statement directly to your trading account, and the comment will be in the following format “Div & Product Name & Net Volume ”.
Please refer to the table below for more details:
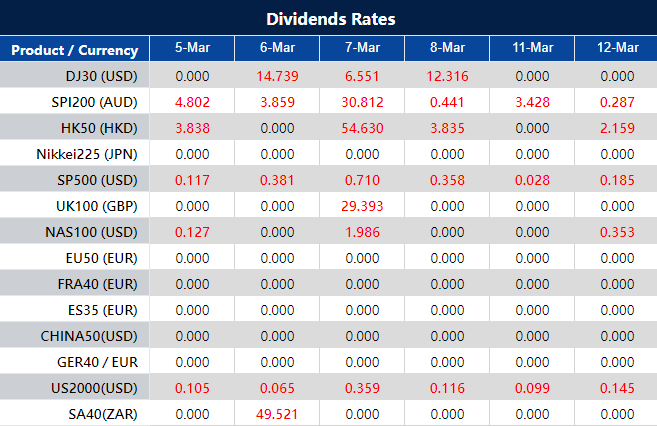
The above data is for reference only, please refer to the MT4/MT5 software for specific data.
If you’d like more information, please don’t hesitate to contact info@vtmarkets.com.
A Complete FAQ on Fund Security with VT Markets
Are the funds in my trading account safe?
Absolutely. At VT Markets, we prioritize the safety and security of our clients’ assets above all else. As a rigorously regulated broker, we operate with complete transparency. Your funds are securely held in segregated accounts with some of the world’s most reputable banks, ensuring they are safeguarded against any unauthorized use.
How does VT Markets guarantee the safety of clients’ funds?
As a testament to our commitment to transparency and security, VT Markets adheres to strict regulatory guidelines. This includes maintaining client funds in segregated accounts, distinctly separate from our corporate funds. This measure is a cornerstone of our pledge to protect and accurately manage our clients’ investments.
How does VT Markets guarantee the safety of clients’ identity and bank information?
Your privacy and the security of your information are paramount at VT Markets. From the moment you begin your registration, through every transaction, your data is shielded by SSL (Secure Sockets Layer) encryption. This robust security protocol ensures that your personal and financial information remains confidential and invulnerable to intrusion.
Where is my money held?
Your peace of mind is our priority. That’s why, at VT Markets, we entrust your funds to segregated accounts housed within highly reputable global banks. This practice is integral to our security measures, designed to meticulously protect your assets.
How can I reach out to VT Markets if I have a dispute or complaint to raise?
We are committed to addressing any concerns you may have swiftly and efficiently. Should you need to raise a dispute or file a complaint, please don’t hesitate to contact us at trading@vtmarkets.com. To expedite the resolution process, please include in your email:
- Your full name, date of birth, and residential address
- Trading account and order number(s)
- A detailed description of your complaint
- Your desired resolution
- Any pertinent documents (letters, screenshots, trading statements, etc.)
- A contact phone number
VT Markets Commitment to Transparency and Trust
VT Markets stands as a regulated broker dedicated to upholding the highest standards of trust and transparency, especially regarding the safety of our clients’ funds. Our rigorous adherence to regulatory standards ensures that every aspect of our operations, from fund security to client support, is conducted with integrity and clarity. Trust in VT Markets to be a steadfast partner in your trading journey, committed to safeguarding your interests and fostering a secure trading environment.
For more information, please contact us here.
Ready to take the next step in your trading journey? Start your live trading account with VT Markets today and experience trading with a broker you can trust.
A Complete 2024 Analysis of PayPal Holdings, Inc
A 2024 Outlook On PayPal Holdings, Inc.
PayPal Holdings, Inc. (NASDAQ: PYPL), a frontrunner in the financial technology domain, has revolutionized digital payments for merchants and consumers globally. As digital payments become increasingly integral to the financial ecosystem, PayPal’s role as a key player is more prominent than ever.
Dive into our comprehensive review of PayPal’s journey, its financial milestones, burgeoning investment opportunities, and the inherent risks tied to its stock.
Company Snapshot:
Originating in 1998 as Confinity, a security software developer for handheld devices, PayPal’s evolution is a testament to innovation and strategic foresight. The 2000 merger with X.com, spearheaded by Elon Musk, marked the beginning of its focus on online financial services. Going public in 2002 and later spinning off from eBay in 2015, PayPal reemerged as an independent entity, poised for global influence. Today, it boasts operations across 200 markets and supports approximately 150 currencies, facilitating seamless global transactions.
PayPal’s commitment to economic empowerment shines through its initiatives for historically underbanked populations. Notably, its $535 million pledge towards racial equity and social justice in 2021, and significant contributions towards the economic empowerment of women and girls, underscore its dedication to inclusivity. Furthermore, PayPal has championed small and medium-sized businesses by facilitating over $24.2 billion through loans and cash advances, underscoring its role as a pillar of support for the entrepreneurial community.
Financial Performance:
PayPal’s fiscal health in recent years paints a picture of robust growth and adaptability. Reporting a revenue increase to $27.52 billion in 2021, a 20% jump from the previous year, and a net income rise to $2.42 billion, PayPal demonstrates financial resilience and strategic acumen. The company’s Gross Payment Volume (GPV) swelled by 31% to $1.07 trillion, with free cash flow escalating by 23% to $4.7 billion, signaling its enduring market relevance and operational efficiency.
Investment Opportunity:
In the rapidly expanding realm of digital payments, PayPal stands out for its widespread brand recognition, extensive network, and trailblazing services. Its forays into economic empowerment and financial education, alongside strategic acquisitions like Honey Science Corp, expand its reach and fortify its market position. PayPal represents a compelling investment avenue, buoyed by its innovative approach and commitment to stakeholder value creation.
Risks and Considerations:
Venturing into PayPal’s stock comes with its set of challenges. The volatile nature of the fintech industry necessitates constant innovation and adaptation. Moreover, PayPal’s financial outcomes are intricately linked to currency exchange rates, interest rates, and macroeconomic shifts. Potential investors should weigh these factors, alongside the broader market volatility and possible capital loss, before making an investment decision.
Final Thoughts on Trading PayPal Holdings: A 2024 Perspective:
PayPal Holdings, Inc. has solidified its stance as a behemoth in digital finance, steering through market fluctuations with strategic investments and a clear vision for inclusive economic empowerment. As we look towards 2024, PayPal’s journey is emblematic of the transformative potential of fintech, promising avenues for growth amidst a landscape ripe with innovation and challenges.
Before venturing into the world of trading or investing, leveraging demo accounts offers invaluable practice. These risk-free platforms allow budding traders to hone their strategies, ensuring a well-informed foray into the financial markets with PayPal or any other investment choice.
Embrace the Future of Finance:
Interested in exploring PayPal’s dynamic market presence further? VT Markets offers the chance to start trading PayPal Share CFDs, providing a platform for those ready to engage with the financial markets more actively. Dive into trading with a trusted CFD Broker and discover what the future holds for PayPal and your investment journey.
Stock market dips slightly amid AI boom and tech gains, while investors eye economic updates
On Monday, the stock market experienced a modest downturn, with the S&P 500 and the Nasdaq Composite retracting from their peak levels despite the surge in technology stocks, fueled by the artificial intelligence boom. The S&P 500 slightly declined by 0.12%, and the Nasdaq fell by 0.41%, even as Nvidia and Super Micro Computer witnessed notable gains. The broader market’s sentiment was tempered by losses in key sectors and major tech companies like Apple and Tesla. Meanwhile, the currency market showed limited volatility as investors awaited significant U.S. economic updates, including Federal Reserve Chair Jerome Powell’s testimony and non-farm payroll data. The anticipation of these events, coupled with mixed outcomes in the stock and currency markets, underscores the cautious approach of investors amidst the ongoing enthusiasm for AI and technology advancements.
Stock Market Updates
On Monday, the stock market experienced a slight retreat, with both the S&P 500 and the Nasdaq Composite stepping down from their all-time highs, despite significant gains in technology stocks spurred by the artificial intelligence boom. The S&P 500 fell by 0.12% to 5,130.95, the Nasdaq Composite dropped by 0.41% to 16,207.51, and the Dow Jones Industrial Average decreased by 97.55 points, or 0.25%, ending at 38,989.83. This pullback brought the S&P 500 and the Nasdaq back from their recent record highs. Noteworthy performances included Nvidia, which surged by more than 3%, and Super Micro Computer, which soared by 18% following the announcement of its upcoming inclusion in the S&P 500. Additionally, bitcoin-related stocks like Microstrategy and Coinbase saw significant gains as the cryptocurrency approached its 2021 peak, indicating a broader appetite for risk among investors.
Despite the excitement around artificial intelligence and select stock advancements, the market was dragged down by underperforming sectors and notable tech companies. The communication services sector led the S&P 500 lower, with Apple dropping 2.5% after a hefty EU antitrust fine and Tesla declining over 7% after announcing new price discounts. Outside of tech, companies like Ford and Macy’s enjoyed gains due to positive sales data and increased acquisition offers, respectively. However, the airline sector showed mixed results, with JetBlue rising over 4% and Spirit Airlines falling more than 10% after canceling their merger plans. As the market digests these movements amid ongoing AI-driven enthusiasm, investors are keenly awaiting insights from Federal Reserve Chair Jerome Powell’s upcoming monetary policy updates, along with key employment and manufacturing data set to be released throughout the week.
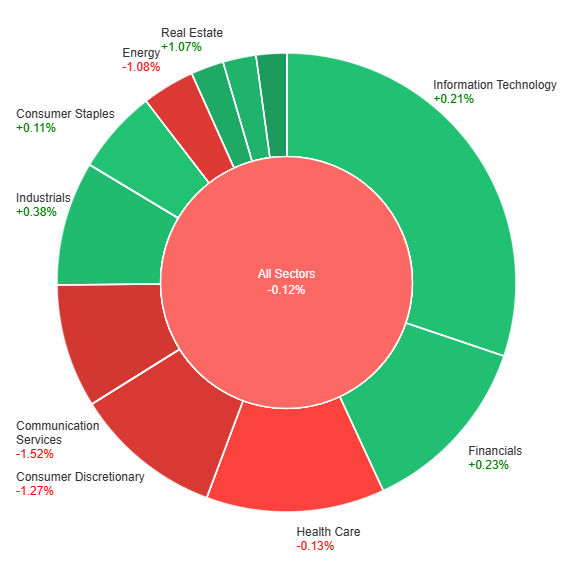
Data by Bloomberg
On Monday, the stock market saw a mixed performance across various sectors, with a slight overall decline of 0.12%. Utilities (+1.65%), Real Estate (+1.07%), and Materials (+0.70%) sectors led the gains, showcasing a stronger performance, while Industrials, Financials, Information Technology, and Consumer Staples also posted modest increases. On the downside, Health Care, Energy, Consumer Discretionary, and Communication Services experienced declines, with Communication Services facing the steepest drop of -1.52%. The energy sector also saw a notable decrease of -1.08% and Consumer Discretionary wasn’t far behind with a decline of -1.27%. This varied performance highlights the differing investor sentiments and economic factors influencing each sector.
Currency Market Updates
In the currency market, the USD index displayed minimal volatility, oscillating between 103.72 and 103.96, as market participants braced for a series of pivotal U.S. economic updates. These include the eagerly anticipated non-farm payrolls data and Federal Reserve Chair Jerome Powell’s testimony to Congress. Comments from Atlanta Fed President Raphael Bostic highlighted a cautious stance on inflation, suggesting the Fed has the luxury of time to ensure inflation targets are met, while also pointing out the potential inflationary pressures from “pent-up exuberance” within the economy. Furthermore, expectations for Federal Reserve rate adjustments, as inferred from SOFR futures, signal a consensus towards a subdued outlook on rate cuts, anticipated to commence in June, with a projection of nearly -80 basis points through the end of 2024.
In currency pair movements, the EUR/USD saw a modest uptick, gaining 0.17% to reach 1.0860, with market sentiment slightly skewed towards potential gains in anticipation of forthcoming U.S. economic data and Powell’s remarks. Meanwhile, the USD/JPY pair experienced a 0.24% rise to 150.50, amidst expectations of diverging monetary policies between the Fed and the Bank of Japan. The GBP/USD pair also recorded gains, increasing by 0.36% to 1.2698, as traders speculated on the Bank of England maintaining a marginally higher interest rate regime compared to the Fed, amid persistent above-target inflation in the UK. In contrast, Bitcoin and gold witnessed significant appreciation, with Bitcoin surging to a new yearly high of $67.6k, driven by ETF-related buying, and gold advancing by 1.6% to $2,117, both reflecting broader market dynamics and investor sentiment.
Picks of the Day Analysis
EUR/USD (4 Hours)
EUR/USD Reaches Two-Week High Amid Dovish Fed Signals and ECB Easing Prospects
The EUR/USD pair witnessed a notable uptrend, reaching new two-week highs in the 1.0865–1.0870 range, buoyed by the ongoing weakness of the US dollar as the USD Index dipped below the 104.00 mark, despite positive shifts in US yields. This movement was supported by risk-on market sentiment and anticipations of a Federal Reserve easing cycle starting in June, reinforced by comments from Fed officials suggesting a possible reduction in policy rates over the summer. Contrasting views among Fed policymakers highlighted a debate on the timing and conditions for rate cuts. Concurrently, the European Central Bank (ECB) signaled a potential start for its easing cycle in the summer, with inflation data supporting such a move. This comes as 10-year bund yields in Europe showed a declining trend, indicating a complex interplay of expectations and market reactions affecting the EUR/USD dynamics.
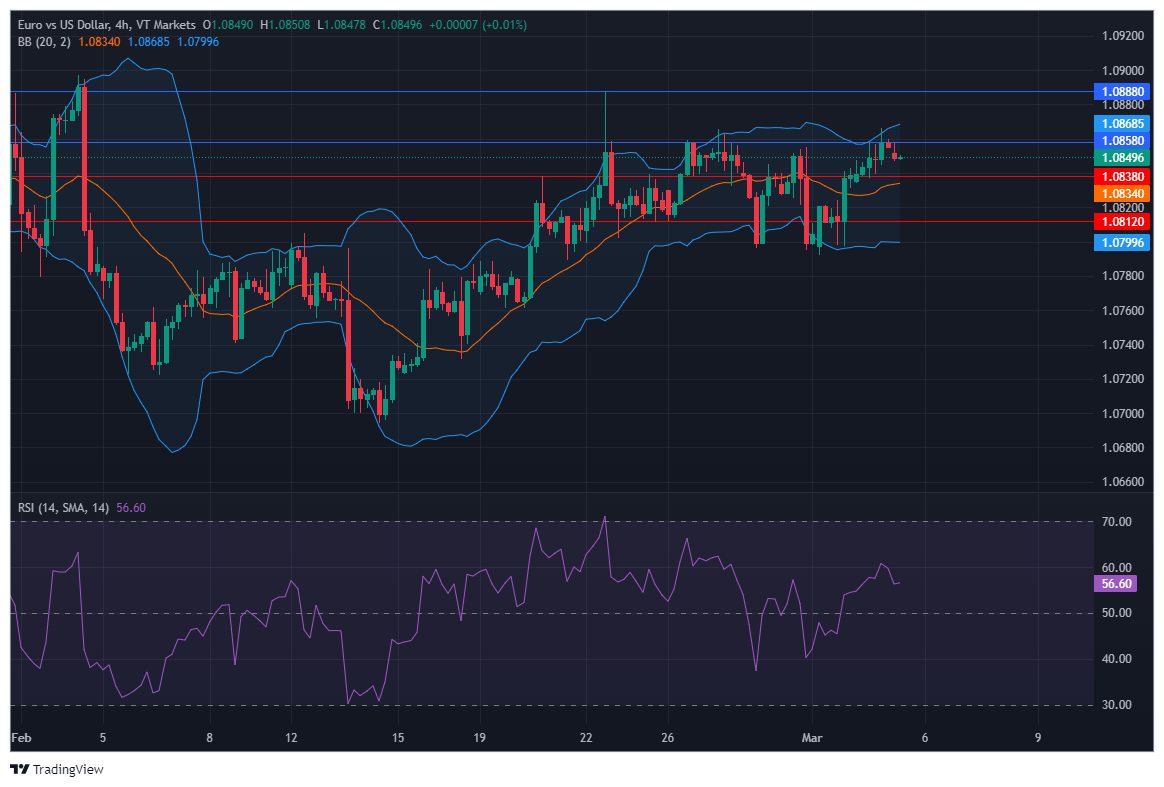
On Monday, the EUR/USD moved higher and was able to reach the upper band of the Bollinger Bands. Currently, the price is moving below the upper band, suggesting a potential downward movement to reach the middle band. Notably, the Relative Strength Index (RSI) maintains its position at 56, signaling a neutral outlook for this currency pair.
Resistance: 1.0858, 1.0888
Support: 1.0838, 1.0812
XAU/USD (4 Hours)
XAU/USD Surges Past $2,100 Amid Economic Indicators and Federal Reserve Speculations
Spot Gold exceeded the $2,100 threshold on Monday, continuing its upward trajectory from Friday, albeit at a diminished pace, with a notable $55.00 increase on the last trading day of the prior week, marking its most significant daily gain since December. The ascent began on Thursday following the release of US inflation data, which aligned with expectations and showed a slower annual increase in the Fed’s preferred inflation metric, the January Core PCE Price Index, since March 2021. This was seen as a relief after earlier CPI figures had heightened inflationary pressure concerns. The momentum was sustained into Friday, driven by disappointing US ISM Manufacturing PMI data and a decline in Treasury yields, which pressured the US Dollar further. Despite a minor recovery in yields at the start of the new week, gold’s trajectory remained unaffected, with market participants eyeing the Federal Reserve’s next meeting for potential rate cut signals, not anticipated before June.
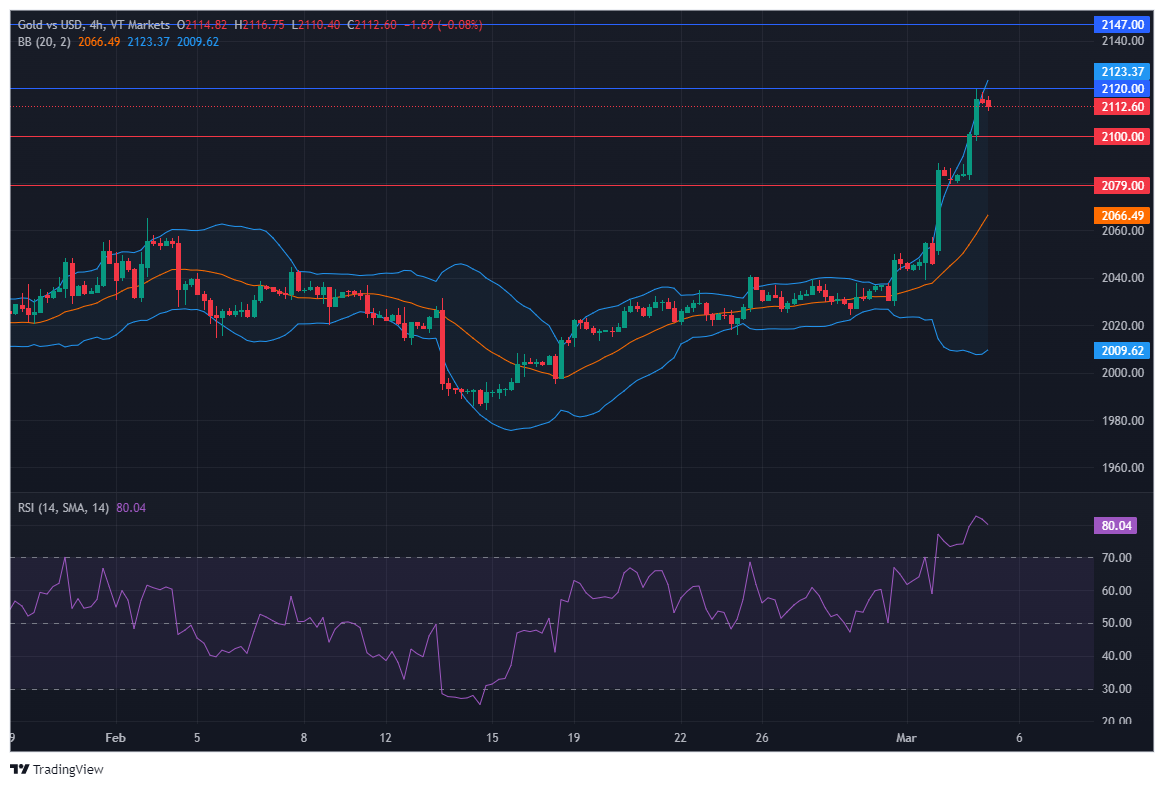
On Monday, XAU/USD moved higher to reach the upper band of the Bollinger Bands. Currently, the price is moving just below the upper band, suggesting a potential higher movement to reach above the upper band and reach the resistance level. The Relative Strength Index (RSI) stands at 80, signaling a strong bullish outlook for this pair.
Resistance: $2,120, $2,147
Support: $2,100, $2,079
Economic Data
| Currency | Data | Time (GMT + 8) | Forecast |
|---|---|---|---|
| USD | ISM Services PMI | 23:00 | 53.0 |
Applying market capitalisation in trading strategies
Marketing Capitalisation Strategies in Forex Trading
Market capitalisation, often referred to as ‘market cap,’ is a way of measuring how much a company is worth in the stock market. It’s like looking at a price tag for the whole company.
Understanding market cap is crucial because it tells traders how big or small a company is in the market, guiding their investment decisions and risk management strategies.
In this article, we will explore the concept of market capitalisation and offer practical tips on how traders can leverage it for informed decisions.
What is market capitalisation?
Market capitalisation is a key measure used in finance to assess the value of a company. It represents the total value of all outstanding shares of a company’s stock.
Market capitalisation is established through an initial public offering (IPO), during which an investment bank assesses the company’s value using various valuation techniques. This evaluation determines the number of shares to be offered to the public and their pricing.
For instance, if a company’s IPO value is set at $150 million, it may issue 15 million shares at $10 each or 30 million shares at $5 each, resulting in the same initial market cap of $150 million.
In simpler terms, market cap gives us an idea of how much the entire company would cost if someone wanted to buy all of its shares at their current market price.
Understanding market capitalisation helps investors and traders evaluate a company’s size and performance in the stock market.
How to calculate market capitalisation
Calculating market capitalisation is straightforward and involves using a simple formula:
Market Cap = Current Stock Price × Total Outstanding Shares.
Market capitalisation is determined by multiplying the current stock price of a company by its total outstanding shares. The stock price represents the value of one share in the company, and the total outstanding shares indicate how many shares are available to the public.
Let’s consider a fictional company, XYZ Inc., with a current stock price of $50 per share and a total outstanding shares count of 10 million.
Market Cap = $50 (Current Stock Price) × 10,000,000 (Total Outstanding Shares)
Market Cap = $500,000,000
So, the market capitalisation of XYZ Inc. is $500 million.
Diluted market capitalisation
In both traditional markets and cryptocurrencies, diluted market capitalisation is vital for assessing a company or project’s total value. It considers additional shares, like stock options or tokens allocated for team members and advisors, which could dilute the value of existing shares or tokens. By accounting for these potential additional shares, diluted market capitalisation provides a more accurate representation of a company or project’s worth, considering all potential shares that could be outstanding in the future.
Let’s use Company A again as an example. Company A has a stock price of $50, 10 million outstanding shares, and potential additional shares from stock options equivalent to 1 million shares.
- Regular Market Cap = $50 (Stock Price) × 10,000,000 (Total Outstanding Shares) = $500,000,000
- Diluted Market Cap = $50 (Stock Price) × (10,000,000 + 1,000,000) (Total Outstanding Shares + Potential Additional Shares) = $550,000,000
In this example, the regular market capitalisation of Company A is $500 million, while the diluted market capitalisation, considering potential additional shares, is $550 million.
Understanding both formulas helps investors assess a company’s value more accurately and make informed investment decisions based on the company’s potential future share structure.
Types of market capitalisation and investment strategies
Understanding market capitalisation involves categorising companies based on their size and value in the stock market. Here are the main categories:
- Large-cap: These are large, well-established companies with a market capitalisation typically exceeding $10 billion. Examples include Apple, Microsoft, and Amazon.
Opting for large-cap companies offers stability and steady growth over time. While short-term gains may not be as substantial, these companies often reward investors with consistent increases in share value and reliable dividend payments.
- Mid-cap: Mid-cap companies have a market capitalisation between $2 billion and $10 billion. Examples include Etsy, Dropbox, and Duolingo.
Positioned between large and small caps, mid-cap companies are established entities operating in industries poised for rapid growth. Despite presenting higher risk due to their growth phase, mid-caps offer attractive opportunities for investors seeking potential growth and expansion.
- Small-cap: Small-cap companies have a market capitalisation below $2 billion. Examples include Udemy, Getty Images, and Upwork.
Typically, younger or niche-focused, small-cap companies offer significant growth prospects. However, they also come with heightened volatility and liquidity concerns, making them riskier investments. Yet, their agility and potential for exponential growth make them appealing for investors with a higher risk tolerance and a long-term horizon.
Market cap and market indices
Market cap is central to how market indices, like the S&P 500, track market performance. Indices use market cap-weighted methods, where larger companies have more influence. This means changes in large-cap stocks significantly impact index movements.
Companies like Apple, Microsoft, and Amazon, with substantial market caps, strongly affect indices like the S&P 500. If their market caps rise, the index follows suit, reflecting positive market sentiment.
Factors affecting market capitalisation
Market capitalisation, or market cap, is influenced by a range of factors:
- Company performance: Strong financial performance boosts market cap, while undervalued shares may attract investors seeking growth opportunities.
- Investor sentiment: Positive news increases market cap, while negative events can decrease it.
- Industry trends: Growing industries tend to have higher market caps. However, market sentiment can lead to overvaluation or undervaluation of shares within these industries.
Understanding these factors helps investors assess whether a company’s market cap accurately reflects its intrinsic value and whether its shares are currently undervalued or overvalued.
In conclusion, market capitalisation is vital for investors and traders in navigating financial markets. It provides insights into company size, stability, and growth potential, guiding investment decisions and trading strategies. While market cap is valuable, it’s essential to consider other factors like company performance and investor sentiment. By understanding market cap’s role and associated risks, traders can make informed decisions and manage their portfolios effectively for long-term success in finance.
Start trading with confidence — explore VT Markets for advanced tools and insights to leverage market capitalization effectively in your strategies.
Dividend Adjustment Notice – March 4, 2024
Dear Client,
Please note that the dividends of the following products will be adjusted accordingly. Index dividends will be executed separately through a balance statement directly to your trading account, and the comment will be in the following format “Div & Product Name & Net Volume ”.
Please refer to the table below for more details:
The above data is for reference only, please refer to the MT4/MT5 software for specific data.
If you’d like more information, please don’t hesitate to contact info@vtmarkets.com.
Weekly Market Outlook: Navigating through economic indicators and Central Bank policies

As we step into the week commencing March 4th, anticipation fills the financial sphere for a flurry of significant economic disclosures. Investors and policymakers alike brace themselves for a cascade of reports set to influence the Federal Reserve’s trajectory leading up to the forthcoming FOMC meeting on March 19-20. All eyes are fixed on Federal Reserve Chair Jerome Powell’s semiannual monetary policy testimony before the House Financial Services and Senate Banking Committees, a session historically known as the Humphrey-Hawkins testimony, promising to command considerable attention.
This testimony is eagerly awaited for any signals indicating shifts in the Federal Reserve’s monetary policy stance. In an environment where the Federal Reserve maintains a firm grip on the federal funds target rate range of 5.25-5.50 percent to rein in inflation and ensure price stability, Powell’s remarks will be scrutinized for any hints of policy adjustments. Despite strides made in controlling inflation, the Fed’s dual mandate urges caution in loosening monetary policy, particularly with the tight labor market’s potential to spur wage inflation.
Against expectations of tempered economic growth, the imminent Beige Book release holds the promise of offering invaluable anecdotal evidence on economic conditions across the 12 Districts. While recent data suggest a resilient US economy buoyed by robust consumer spending and a strong labor market, striking a balance between nurturing growth and preventing inflation remains a nuanced challenge.
This week also heralds the arrival of the monthly employment report for February, with analysts projecting a slight moderation in nonfarm payroll growth, yet underscoring the enduring strength of the labor market fundamentals. As businesses grapple with recruitment hurdles, the interplay between job vacancies, wage pressures, and inflation dynamics assumes critical significance for market strategies.
For forex traders and market analysts at VT Markets, these unfolding events carry paramount importance. The impending economic indicators and Powell’s testimony not only provide insights into the US economic outlook but also wield significant implications for currency markets and trading strategies. As we embark on this pivotal week, remaining informed and adaptable will be imperative for navigating the evolving market landscape.
Key Takeaways:
- Fed Chair Jerome Powell’s testimony could offer new insights into the Federal Reserve’s monetary policy direction.
- The Beige Book and the monthly employment report will provide further clarity on the US economic health and labor market dynamics.
- Market participants should remain vigilant, adapting their strategies in response to the unfolding economic indicators and central bank policies.
Stay connected with VT Markets for real-time analysis and insights on how these developments impact the forex market and trading opportunities.


