| VT Markets")

As July ends, markets face a crucial transition: fading trade optimism, rising inflation risks, and major central bank meetings – including the Fed and the BOJ – will test momentum. With low summer liquidity, macro shocks could trigger outsized swings.
KEY INDICATORS
Currency moves
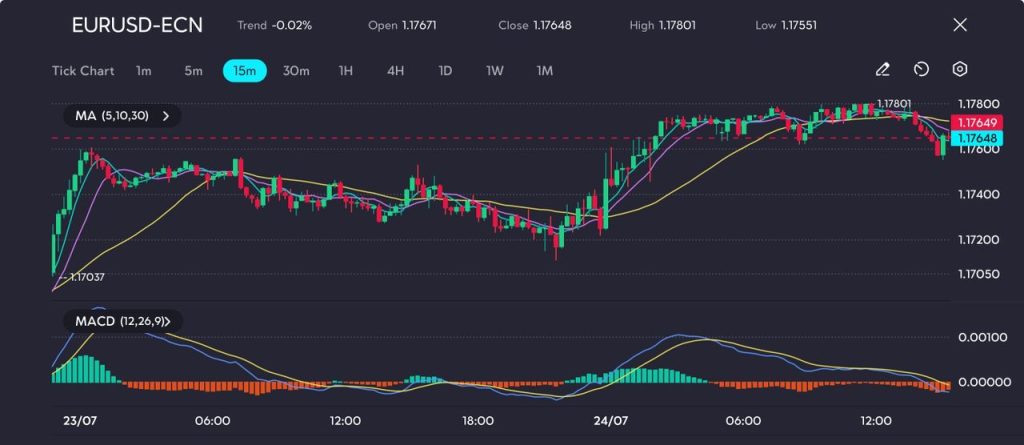
The US dollar rose as trade optimism faded.
Markets suggest the “TACO trade” (Trump Always Chickens Out) narrative is losing momentum.
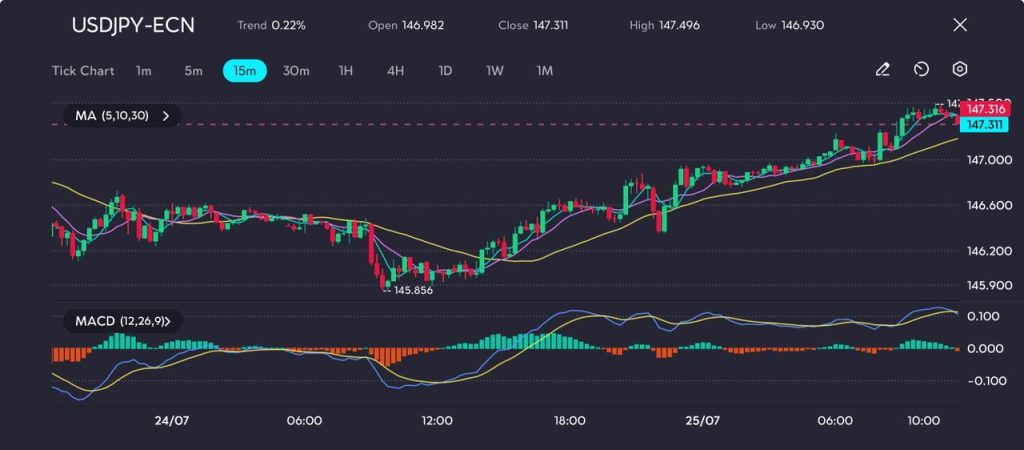
The yen remained volatile ahead of Japan’s upper house election.
Commodities and equities
Oil prices climbed after drone strikes in Iraqi Kurdistan raised supply concerns.
Gold edged lower as bond yields rose, and the dollar strengthened.
The S&P 500 and Nasdaq hit record highs on strong AI-related earnings.
Tesla and other major tech stocks fell despite solid results, reflecting “sell-the-news” reactions.
Global markets paused after trade-driven gains as inflation data and central bank updates approached.
Asia and the week ahead
Asian markets were mixed, with gains in Hong Kong and Shanghai and losses in Tokyo.
This week’s earnings reports include Alphabet, Tesla, and Microsoft.
Wednesday will bring US CPI and PPI data, ECB minutes, and BOJ remarks.
Friday will deliver Japan’s election results, OPEC+ developments, and tariff decisions.
Political risk from Japan and AI-related investigations led by BRICS may shift sentiment midweek.
MARKET MOVERS
Nasdaq 100
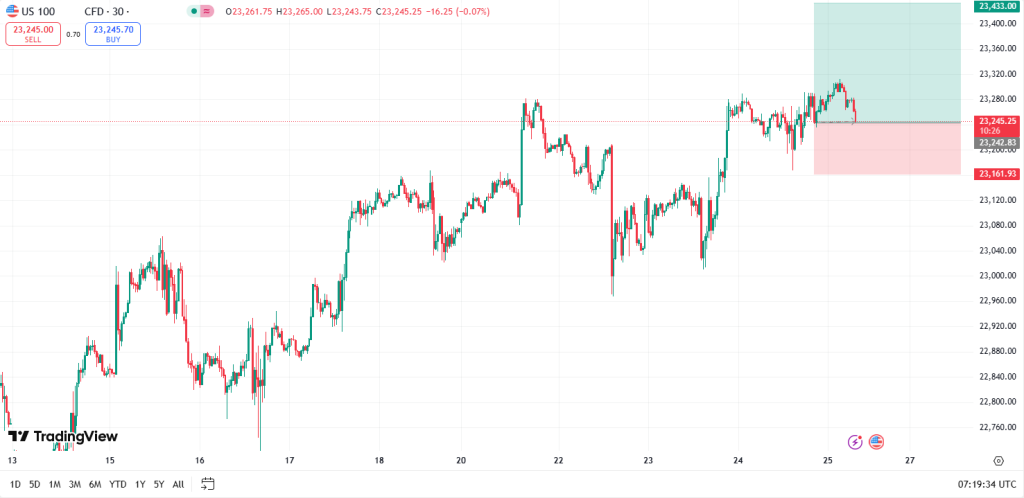
- Technical breakout: Nasdaq continues to rally and is approaching the 23,300–23,350 resistance zone. A confirmed close above this range would signal a breakout continuation, while failure to hold may trigger short-term profit-taking.
- Target projection (bullish): A breakout above 23,350 opens the path to 23,600–23,700, with potential to extend to 24,000–24,200 by August, supported by bullish analyst forecasts pointing to 25,000+ by year-end.
- Target projection (bearish): A break below 23,000 may lead to further downside towards 22,800–22,700, reflecting fading momentum and speculative unwind.
- Opening expectation: Nasdaq futures indicate a bullish open near 23,250–23,320, driven by strong Q2 earnings (notably from Alphabet/AI), dovish Fed signals, and renewed trade optimism.
- Primary support zone: 23,100–23,150 (20-day moving average and pivot cluster).
- Secondary support zone: 23,000 (psychological support).
- Tertiary support zone: 22,800–22,700 (retracement zone if sentiment deteriorates).
- Strategy (bullish approach): Buy on a confirmed breakout above 23,350 with targets at 23,600 and 24,200.
- Strategy (bearish approach): Short below 23,000 with targets at 22,800 and 22,700.
- Stop-loss level: Below 23,100 for bullish positions; above 23,400 for bearish positions.
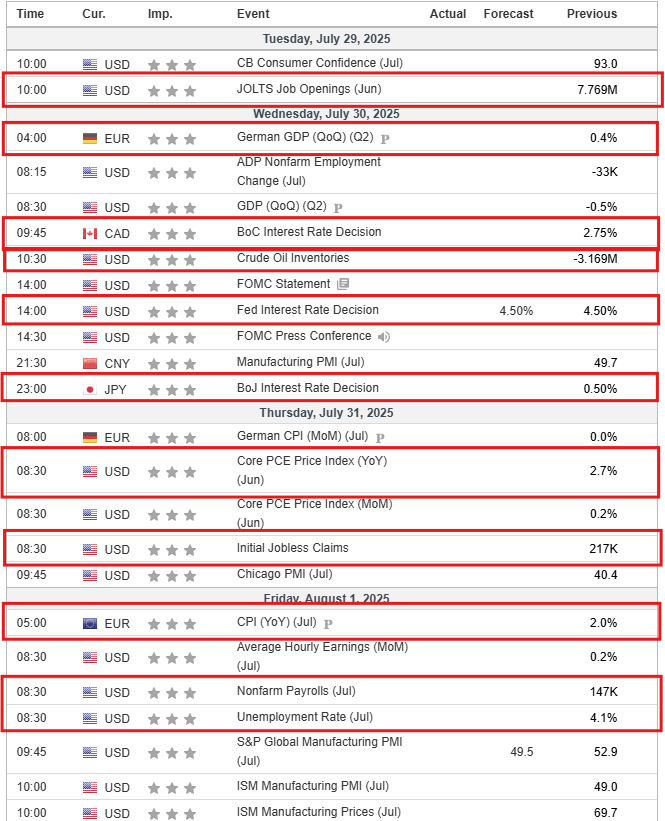
- Key catalysts this week: US CPI and PPI data, ECB minutes, BOJ remarks, tariff decisions, and earnings updates from Apple, Microsoft, Alphabet, and Tesla.
- Market context: Nasdaq is at a critical technical juncture. Momentum remains strong, with over 60 consecutive sessions above the 20-day MA – the longest since 1999. However, signs of overbought conditions and speculative excess suggest traders should use tight stops and remain alert to whipsaw risks.
Nikkei 225
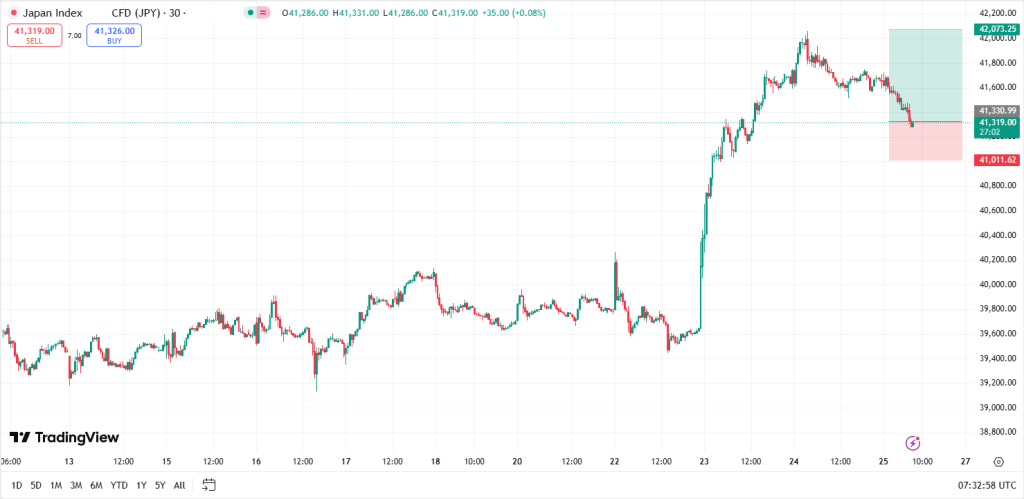
- Technical breakout: Nikkei is breaking out of a bullish flag pattern, with momentum building above 40,300. A confirmed close above 40,620 would signal breakout continuation, while failure to hold above trend support may trigger a deeper retracement.
- Target projection (bullish): A sustained move above 40,620 opens the path to 42,500–42,900, supported by strong earnings, softening JGB yields, and improving economic surprise indices.
- Target projection (bearish): A breakdown below 39,000 could extend losses to 38,000–37,700, aligned with Fibonacci retracement levels from the May–July rally.
- Opening expectation: Nikkei is set to open around 40,300–40,400, reflecting positive sentiment following the July election and upbeat Japanese earnings.
- Primary support zone: 39,000–39,100 (main trendline and May low).
- Secondary support zone: 38,500–38,600 (retracement area).
- Tertiary support zone: 38,000–37,700 (deeper correction zone if sentiment weakens).
- Strategy (bullish approach): Buy on a confirmed breakout above 40,620 with targets at 42,500 and 42,900.
- Strategy (bearish approach): Short below 39,000 with targets at 38,500 and 37,700.
- Stop-loss level: Below 39,000 for bullish positions; above 40,300 for bearish positions.
- Key catalysts this week: Japan’s upper-house election outcome, long-term JGB yield volatility (30-year above 3.2%), and continued strength in Citigroup’s Economic Surprise Index and earnings revision momentum.
- Market context: The Nikkei is in a medium-term uptrend, supported by strong fundamentals and a bullish technical structure. However, rising yields and political uncertainty post-election may introduce volatility. Traders should manage positions with disciplined stops and watch for confirmation above key resistance.
DAX 40
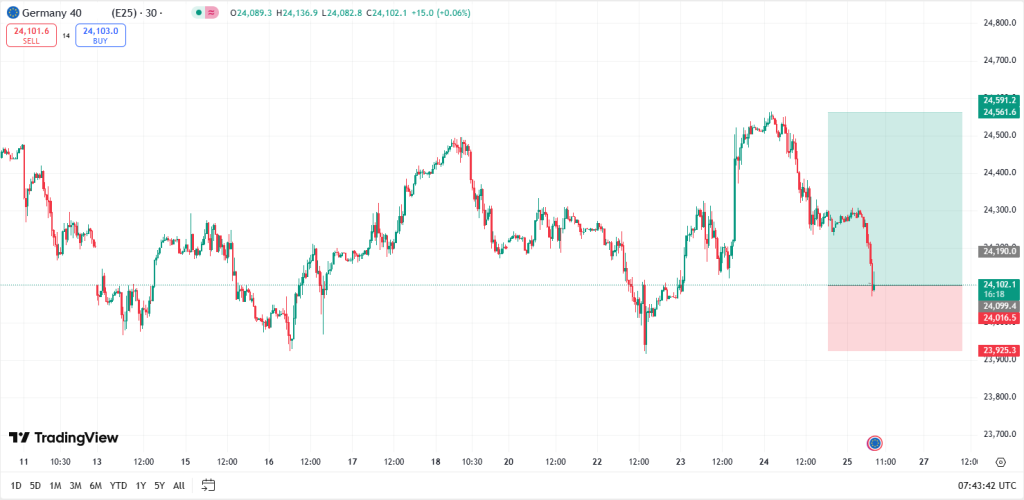
- Technical breakout: DAX is trading above the key pivot at 24,483.70, suggesting continued upside towards the 24,852.67 resistance level. Holding above 23,945.50–24,000 keeps the uptrend intact, while a drop below 23,945.50 – especially towards 23,701.36 – may signal weakening momentum and a deeper retracement risk.
- Target projection (bullish): A breakout above 24,852–24,900 opens the path to 25,000–25,500, supported by Germany’s fiscal stimulus and strength in the defence and tech sectors.
- Target projection (bearish): A drop below 23,701.36 may extend losses to 23,300–23,000 if price action breaks beneath the key pivot zone.
- Opening expectation: DAX is expected to open around 24,300–24,400, driven by broad global equity strength and positive sentiment from Germany’s fiscal support measures.
- Primary support zone: 24,483.70 pivot and the 127.2% Fibonacci cluster near 23,945–24,000.
- Secondary support zone: 23,701.36, a major swing low and technical overlap level.
- Tertiary support zone: Around 23,300, representing the deeper retracement zone and failure point for the bullish structure.
- Strategy (bullish approach): Buy above 24,483.70 with targets at 24,900 and 25,500. Use a stop-loss below 23,940 to protect against pivot failure.
- Strategy (bearish approach): Short below 23,700 with targets at 23,300 and 23,000. Use a stop-loss above 24,850 to avoid upside reversal.
- Range strategy: Fade within 23,945–24,850 until a breakout confirms. Buy near the lower bound, sell near the upper bound, with tight stop-losses.
- Key catalysts this week: Germany’s €500 billion stimulus plan boosting sentiment in domestic demand, defence, energy, and tech sectors. ECB policy commentary and global trade headlines ahead of August rate guidance. Earnings from SAP and other German corporates may drive index momentum.
- Market context: Germany’s fiscal stimulus is driving bullish sentiment across sectors like defence, technology, and banking. Stocks such as Rheinmetall, Siemens Energy, and Commerzbank have outperformed in 2025. Despite global headwinds, sustained capital inflows into DAX-listed exporters continue to position the index as a top global performer this year.
NEWS HEADLINES
Global policy and political shifts
Japan’s upper house vote this Friday could reshape fiscal policy, yen sentiment, and the Bank of Japan’s communication.
The ECB kept rates unchanged and warned of growing global trade risks, reinforcing a cautious stance.
The BRICS summit ended with a joint call for global AI regulation and stronger South–South economic cooperation.
The US–Japan tariff deal may offer relief, but Trump’s 1 August tariff deadline still poses risks for broader markets.
Prime Minister Starmer is lobbying Trump to lift US tariffs on UK exports, including steel and Scotch whisky.
Currency movements and central bank focus
The US dollar held steady following the ECB rate decision, with attention now turning to upcoming Fed and BOJ meetings.
The Japanese yen remains volatile ahead of election results and policy signals from the BOJ.
Valeo cut its sales forecast, citing a €750 million forex hit tied to trade tensions and dollar strength.
Market trends and sector developments
Oil prices rose after drone strikes in Iraqi Kurdistan reignited global supply concerns.
Copper futures hit record highs as traders anticipated US tariffs starting on 1 August.
Gold declined as rising bond yields, and a stronger dollar reduced safe-haven demand.
HSBC outlined five risks to the US equity rally, including rising yields, AI fatigue, and doubts about Fed credibility.
US equities showed post-earnings fatigue, with stocks like Netflix and Tesla leading late-session declines.
Asian stocks retreated slightly as investors reduced risk exposure ahead of tariffs and central bank meetings.
Tokyo’s Nikkei cooled after recent gains, while broader regional sentiment held firm.
Tokyo’s core CPI reached 2.9% in July, increasing pressure on the BOJ to revise its inflation outlook.
Click here to open account and start trading.

 | VT Markets")

 | VT Markets")