With the upcoming U.S. Election on November 5th, increased market volatility is expected. Our top priority at VT Markets is to protect our clients and ensure a positive trading experience. We would like to remind all investors of the following market risks:
Spreads:
During the election period, market spreads may experience more significant fluctuations than usual. Please trade cautiously and manage your positions and funds appropriately. Liquidity:
Due to market sentiment and uncertainty, some liquidity providers and banks may reduce or withdraw their support, which may lead to significant differences between the order execution price and the intended price, increasing the risk of slippage. Volatility:
Frequent news events and market updates may trigger sharp market movements, resulting in extreme market conditions.
As your trusted broker, VT Markets will implement various risk management measures to effectively address market volatility and ensure trading safety. Specific adjustments may include lowering leverage ratios and increasing margin requirements to double their original level. Please be advised that leverage adjustments may directly lead to higher or lower margin requirements. We recommend that you add funds to your account in advance to ensure sufficient margin coverage.
If you’d like more information, please don’t hesitate to contact info@vtmarkets.com.
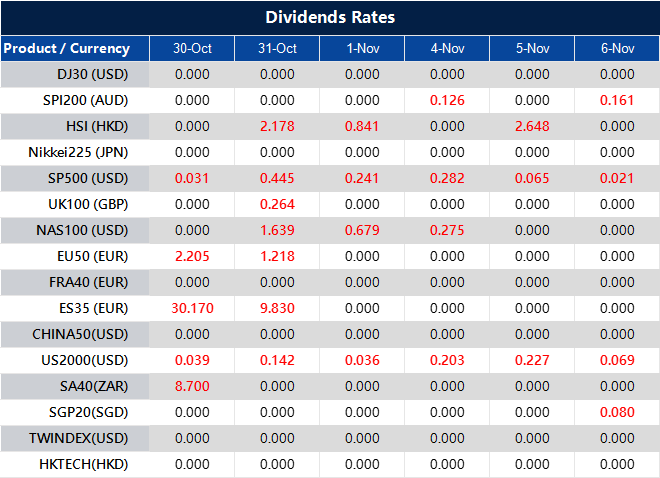
Please note that the dividends of the following products will be adjusted accordingly. Index dividends will be executed separately through a balance statement directly to your trading account, and the comment will be in the following format “Div & Product Name & Net Volume ”.
Please refer to the table below for more details:
The above data is for reference only, please refer to the MT4/MT5 software for specific data.
If you’d like more information, please don’t hesitate to contact info@vtmarkets.com.
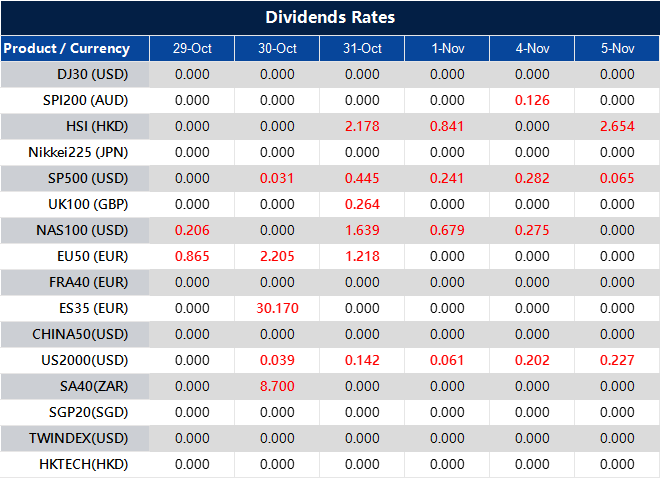
Please note that the dividends of the following products will be adjusted accordingly. Index dividends will be executed separately through a balance statement directly to your trading account, and the comment will be in the following format “Div & Product Name & Net Volume ”.
Please refer to the table below for more details:
The above data is for reference only, please refer to the MT4/MT5 software for specific data.
If you’d like more information, please don’t hesitate to contact info@vtmarkets.com.
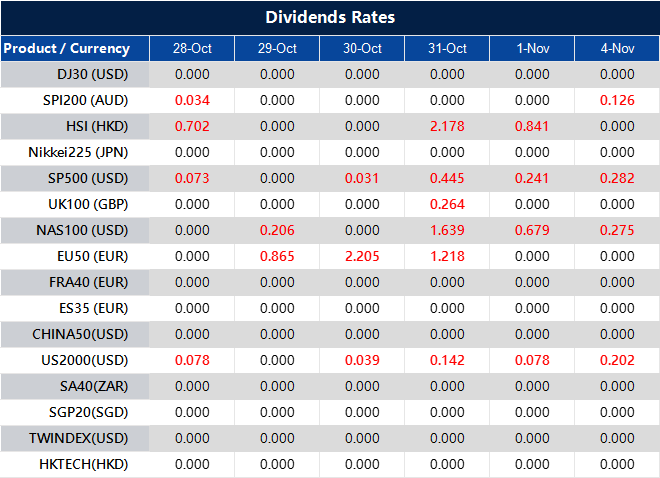
Please note that the dividends of the following products will be adjusted accordingly. Index dividends will be executed separately through a balance statement directly to your trading account, and the comment will be in the following format “Div & Product Name & Net Volume ”.
Please refer to the table below for more details:
The above data is for reference only, please refer to the MT4/MT5 software for specific data.
If you’d like more information, please don’t hesitate to contact info@vtmarkets.com.
Written on October 28, 2024 at 10:32 am, by anakin
Going into the last week of October will focus on key market events that could influence the near-term economic landscape.
The Federal Reserve’s interest rate decision, set for Wednesday, will be a primary driver for markets. Analysts largely anticipate that the Fed will maintain the current rate, following last week’s positive job data and balanced inflation trends.
KEY ECONOMIC INDICATORS
Japan BoJ interest rate decision – 30 October 2024:
The Bank of Japan (BoJ) announces its interest rate decision after each of the Bank’s eight scheduled annual meetings.
Generally, if the BoJ is hawkish about the inflationary outlook of the economy and raises interest rates it is bullish for the Japanese Yen (JPY).
Likewise, if the BoJ has a dovish view on the Japanese economy and keeps interest rates unchanged, or cuts them, it is usually bearish for JPY.
Earnings, CPI and PPI reports:
Earnings season is still active, with reports from prominent tech firms including Intel and Adobe expected this week.
Analysts will also examine the latest Consumer Price Index (CPI) and Producer Price Index (PPI) figures, scheduled for Tuesday and Wednesday, which could affirm whether inflation remains on a downward trajectory, supporting the Fed’s stance on rates.
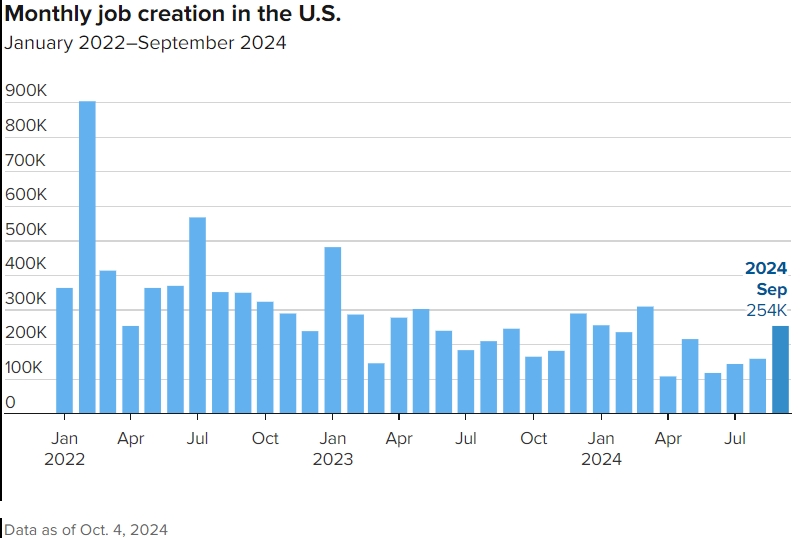
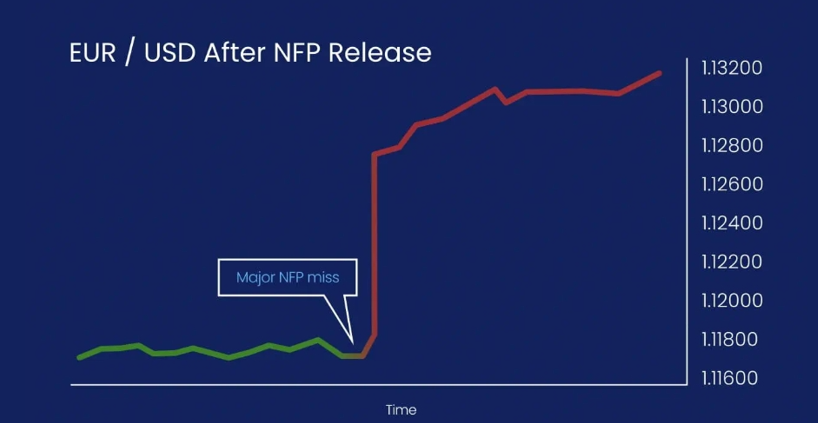
NFP employment release:
Nonfarm payrolls surged by 254,000 in September, up from a revised 159,000 in August and better than the 150,000 Dow Jones consensus forecast.
The unemployment rate fell to 4.1%, down 0.1 percentage point, as the survey of household employment showed an even stronger picture, with a gain of 430,000.
MARKET MOVERS
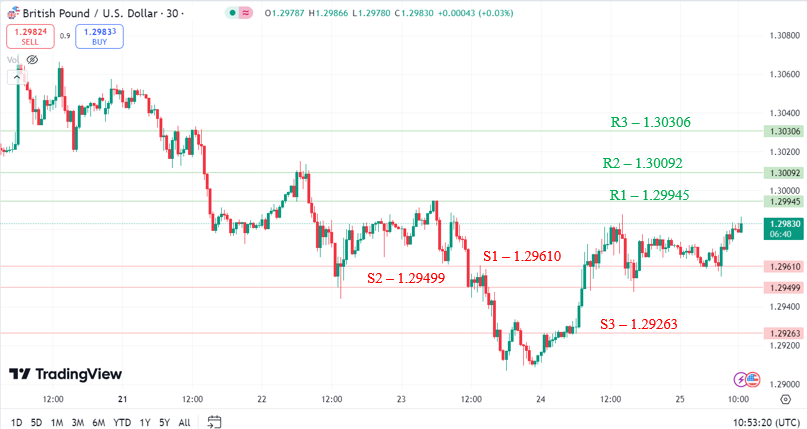
S1-S3 mean potential Support points. If the market declines further, these are the potential levels it can reach.
R1-R3 mean potential Resistance points. If the market starts to increase again, these are the potential levels it can reach.
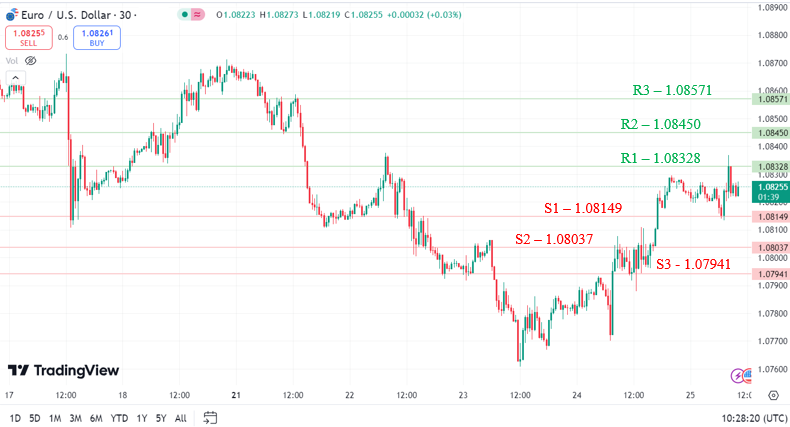
EUR/USD
Potential Long preference
Long positions above 1.08328 with targets at 1.08450 & 1.08571 in extension.
Alternative scenario
Below 1.08149 look for further downside with 1.08037 & 1.07941 as targets.
The pair’s near-term outlook points to a bullish tilt.
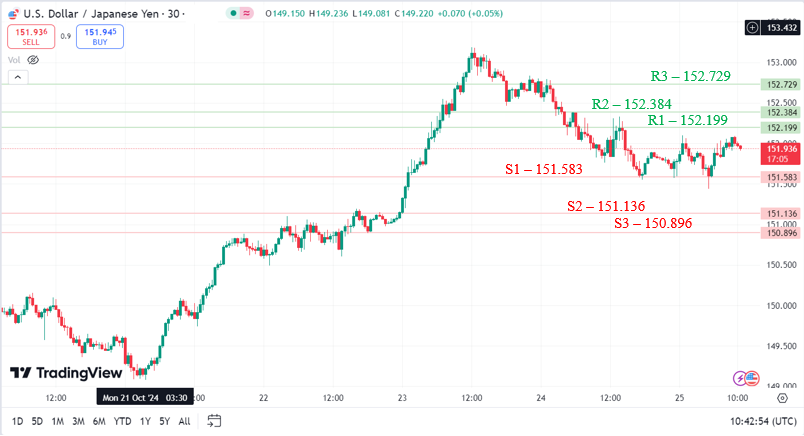
USD/JPY
Potential Short preference
Short positions below 151.583 with targets at 151.136 & 150.896 in extension.
Alternative scenario
Above 152.199 look for further upside with 152.384 & 152.729 as targets.
As long as the resistance at 152.199 is not surpassed, the risk of the break below 151.583 remains high.
GBP/USD
Potential Long preference
Long positions above 1.29945 with targets at 1.30092 & 1.30306 in extension.
Alternative scenario
Below 1.29610 look for further downside with 1.29499 & 1.29263 as targets.
A support base at 1.29610 has formed and has allowed for a temporary stabilisation.
Market instruments to look out for this week:
EUR/USD
USD/JPY
GBP/USD
Nasdaq100
XAU/USD
MARKET NEWS
Why the Japanese yen is hovering near three-month lows against the dollar
The Japanese yen is hovering near three-month lows against the U.S. dollar, after hitting 153.18 late Wednesday.
The upcoming elections in Japan, strong growth indicators in the U.S., and still high rate differential between U.S. and Japan is pressuring the Japanese currency.
Gold falls on profit-taking after record rally
Gold prices fell on Friday as some investors booked profit after its recent rally which hit a record high, although ongoing tensions in the Middle East helped limit the decline.
Spot gold eased 0.6% to $2,718.83 per ounce by 1014 GMT.
Prices had hit an all-time high of $2,758.37 on Wednesday.
Spot silver, which hit a 12-year-high of $34.87 earlier this week, fell 1.7% to $33.13 per ounce.
Platinum lost 1.9% to $1,006.85.
Dollar set for fourth weekly gain as investors balk at array of risks
The dollar headed for a fourth weekly gain on Friday, as an uncertain backdrop for markets sent the yen near three-month lows ahead of an election in Japan over the weekend that could complicate the Bank of Japan’s (BOJ) plans to normalise rates.
The dollar index was last little changed at 104.01, after having scaled a roughly three-month high of 104.57
The yen weakened, leaving the dollar 0.1% higher on the day at 152.045 and up 1.4% this week, having shrugged off Tokyo inflation data on Friday
That showed core consumer prices came in below the BOJ’s 2% target for the first time in five months.
Optimisation Hours:
26th of October 2024 (Saturday) 00:00–03:00 (GMT+3)
Please note that the following aspects might be affected during the optimisation: 1. The price quote and trading management for the optimised products will be temporarily disabled during the optimisation period.You will not be able to open new positions, close open positions, or make any adjustments to trades.
2. There might be a gap between the original price and the price after optimisation.Gaps between Pending Orders, Stop Loss, and Take Profit will be filled at the market price once the maintenance is completed. It is suggested that you manage the account properly.
Please refer to the MT4 & MT5 software for specific optimisation completion and market opening times.
Thank you for your patience and understanding regarding this important initiative. If you’d like more information, please don’t hesitate to contact info@vtmarkets.com.
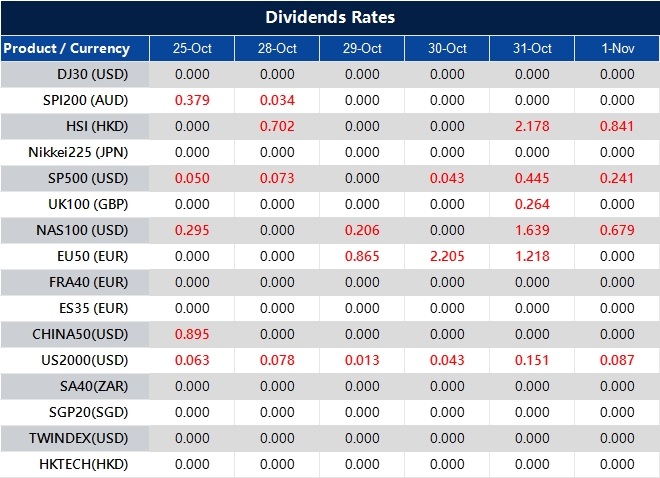
Please note that the dividends of the following products will be adjusted accordingly. Index dividends will be executed separately through a balance statement directly to your trading account, and the comment will be in the following format “Div & Product Name & Net Volume ”.
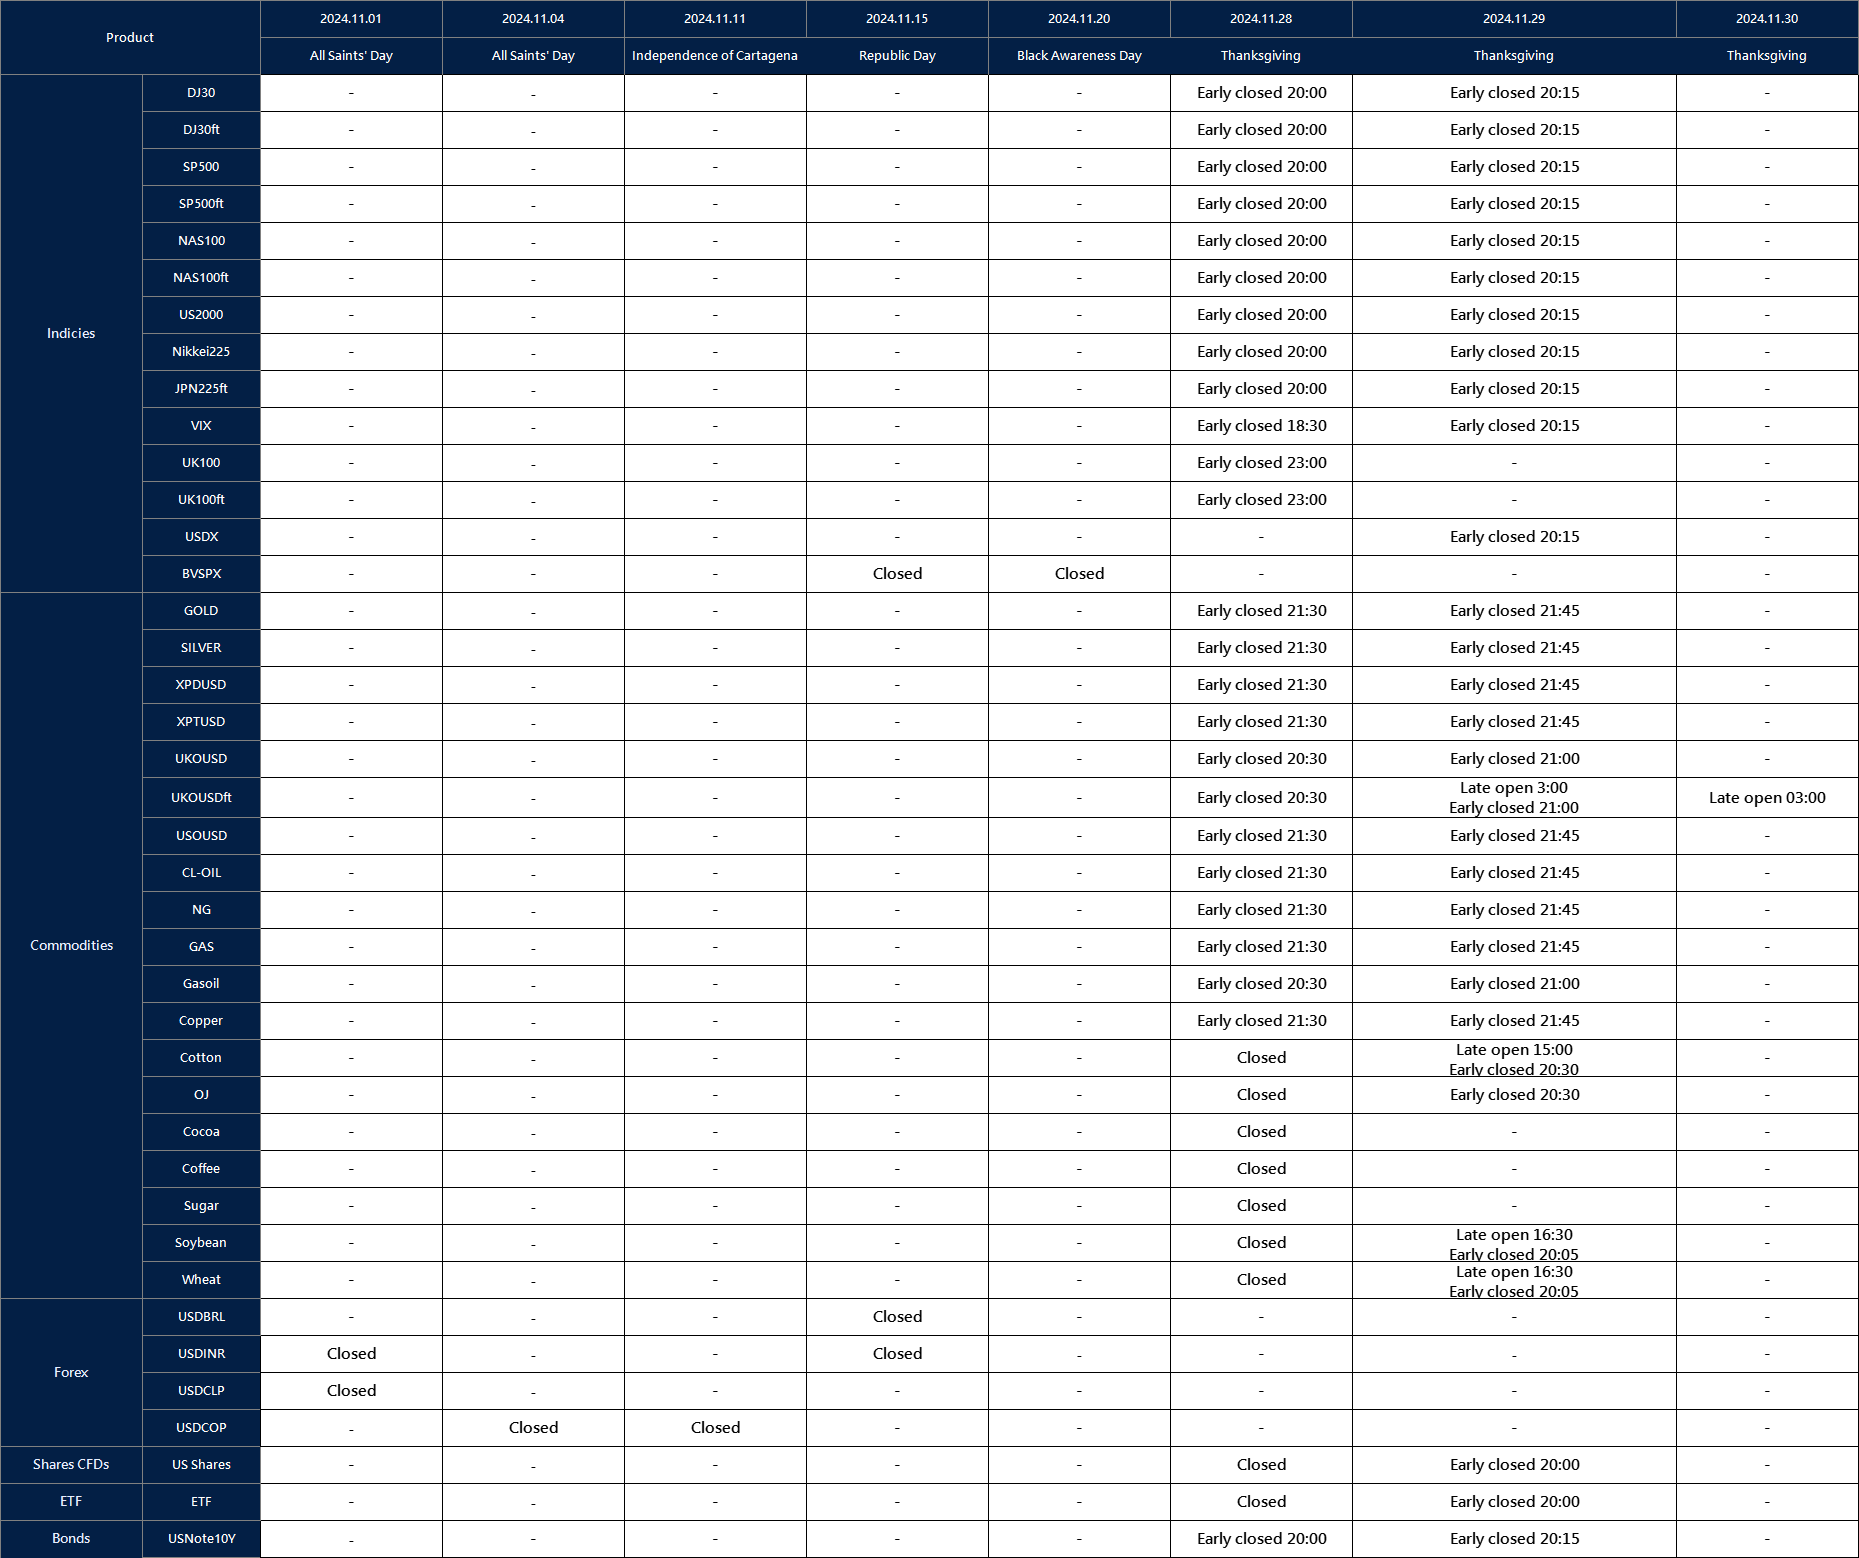
Please refer to the table below for more details:
The above data is for reference only, please refer to the MT4/MT5 software for specific data.
If you’d like more information, please don’t hesitate to contact info@vtmarkets.com.
The US stock market indices stand as the world’s most widely recognised benchmarks of financial market performance. These powerful indicators not only reflect the health of the American economy but also serve as essential trading instruments for investors worldwide.
With a combined market capitalisation exceeding USD 40 trillion as of 2024, from the venerable Dow Jones Industrial Average to the tech-heavy NASDAQ, understanding these indices is crucial for any trader looking to participate in the global financial markets.
The trinity of US indices: A historical perspective
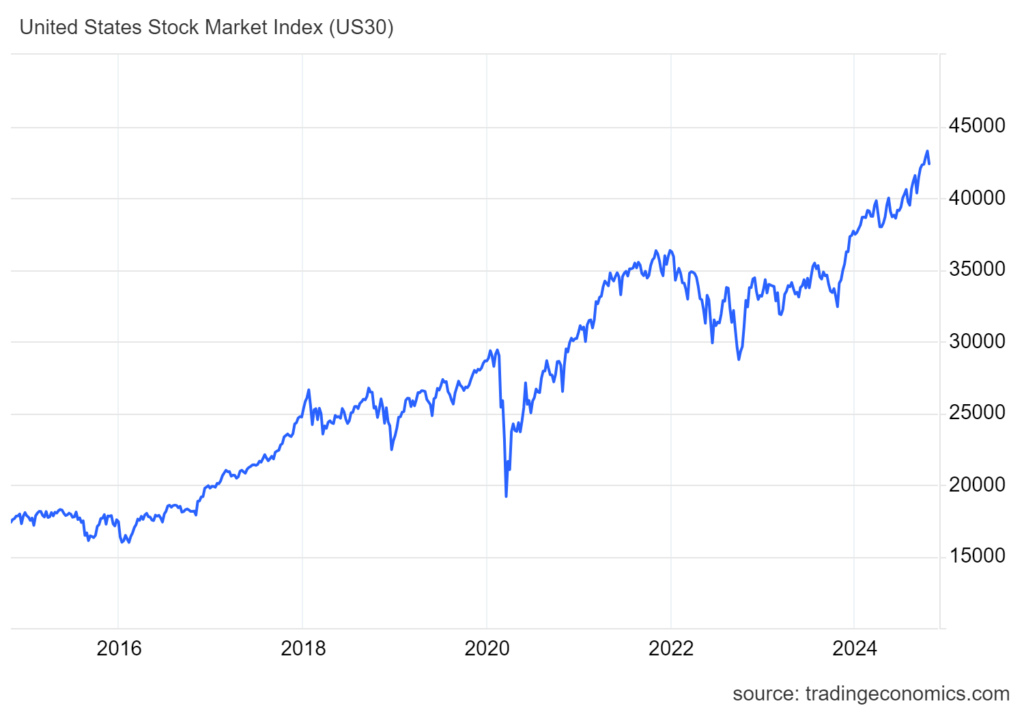
The story of US indices is intrinsically linked to the evolution of modern financial markets. The Dow Jones Industrial Average (DJIA), established in 1896, is perhaps the most historically significant. Initially comprising just 12 industrial stocks with a starting value of 40.94 points, today’s DJIA tracks 30 of America’s most influential companies.
Despite its relatively small composition, it remains a crucial barometer of market sentiment, with components like Apple, Microsoft, and McDonald’s reflecting broad economic trends. The index has shown remarkable growth, surpassing 30,000 points in 2020 – a testament to the long-term potential of US markets.
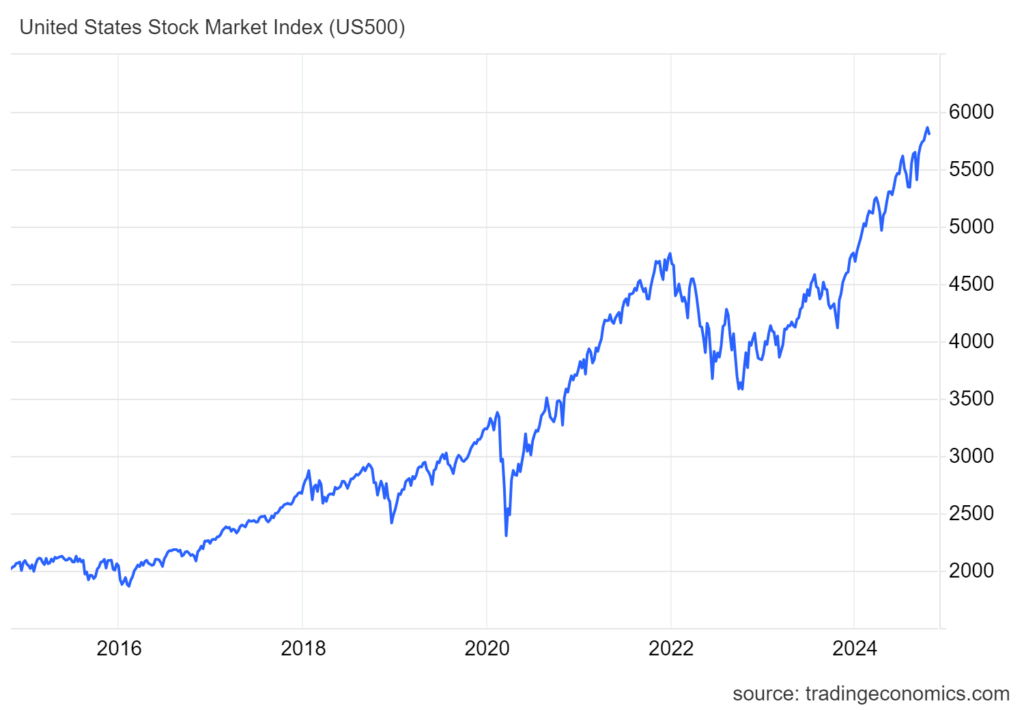
The S&P 500, introduced in 1957, offers a more comprehensive view of the US economy. Tracking 500 of the largest publicly traded companies, it represents approximately 80% of the available market capitalisation.
This broader representation makes it the preferred benchmark for professional money managers and institutional investors, with over USD 15.6 trillion in assets directly indexed to its performance.
Notable milestones include breaking the 4,000-point barrier in 2021, highlighting the remarkable growth of US equities over time. The index has delivered an average annual return of approximately 10% since its inception, including dividend reinvestment.
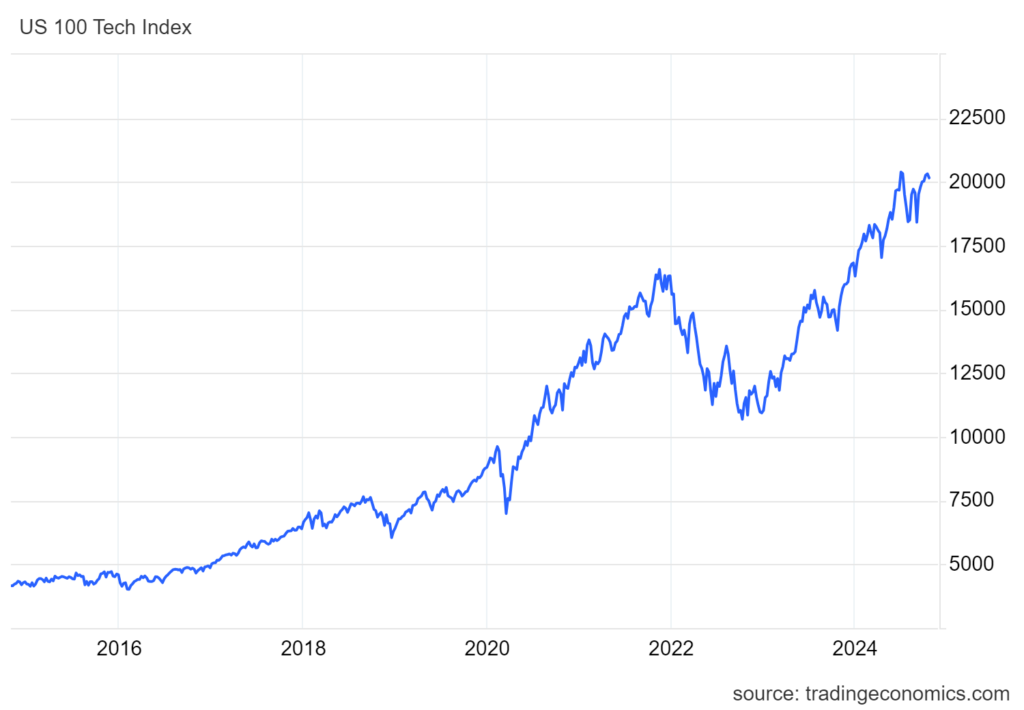
The NASDAQ Composite, launched in 1971, has emerged as the technological revolution’s flagship index. Home to giants like Amazon, Meta, and Alphabet, it represents over 3,000 companies and has become synonymous with innovation and growth.
The index’s performance often signals broader technological trends and market sentiment towards high-growth sectors. Since its inception, the NASDAQ has grown from 100 points to over 15,000 points, with technology companies comprising approximately 50% of its total weight.
Economic significance and market impact
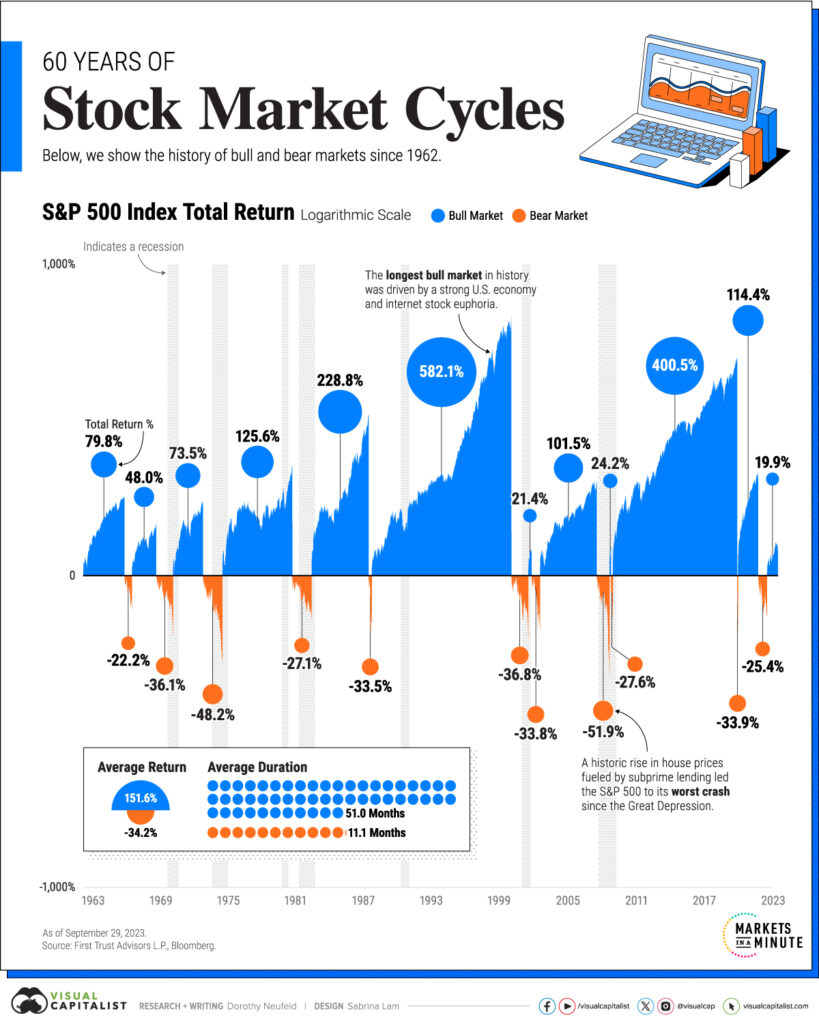
These indices serve as more than just trading instruments; they are crucial economic indicators. The S&P 500, in particular, is considered a leading indicator of US economic health, with its movements often preceding broader economic trends by 6-12 months. This relationship extends globally, with international markets frequently taking cues from US index movements.
The indices’ influence on global markets cannot be overstated. When Wall Street sneezes, global markets often catch a cold, as demonstrated during significant market events like the 2008 financial crisis, when the S&P 500 fell 38.5%, and the 2020 pandemic-induced volatility, which saw the fastest 30% decline in market history over just 22 trading days.
Trading mechanics: Getting started
Trading US indices is accessible through various instruments, with Contracts for Difference (CFDs) being particularly popular among retail traders. CFDs offer advantages including leverage capabilities and the ability to trade both rising and falling markets. However, it’s crucial to understand that leverage, while potentially increasing profits, can also magnify losses.
Trading hours for US indices typically follow the New York Stock Exchange schedule (2:30 PM to 9:00 PM GMT), although many brokers offer extended hours trading from11:00 PM to 1:00 AM GMT. The pre-market and after-hours sessions can provide additional opportunities but often come with wider spreads and lower liquidity.
Margin requirements for index trading vary by broker and regulatory jurisdiction. VT Markets offers leverage of up to 500:1 on major US indices, meaning traders can control larger positions with a relatively modest capital outlay. For perspective, this means trading USD 100,000 worth of an index could require as little as USD 200 in margin.
Developing your trading strategy
Successful index trading requires a well-thought-out approach combining technical and fundamental analysis.
Technical traders often focus on key price levels, trend lines, and popular indicators like moving averages and RSI. Studies show that approximately 75% of stock price movements are correlated with broader index movements, making index analysis crucial for individual stock traders as well.
Risk management is paramount. Successful traders typically:
Limit position sizes to 1-2% of trading capital per trade.
Use stop-loss orders consistently, often set at 1-2% of account value.
Avoid overleverage, typically using no more than 10:1 leverage.
Monitor correlation between different indices (S&P 500 and NASDAQ correlation often exceeds 0.80).
Consider market volatility (VIX index) when sizing positions.
Practical trading considerations
Market volatility tends to peak during US trading hours, particularly around economic data releases and Federal Reserve announcements. The first and last hours of trading often see increased volatility, accounting for approximately 35% of daily trading volume.
News impact is significant, with indices responding quickly to major economic indicators such as:
Non-farm payrolls (released monthly).
GDP data (quarterly releases).
Inflation figures (CPI and PPI monthly releases).
Federal Reserve policy decisions (eight times per year).
Taking the next step
Understanding US indices is crucial for modern traders, but knowledge alone isn’t enough – proper execution through a reliable broker is essential. VT Markets offers competitive trading conditions for all major US indices, including:
Tight spreads and zero commissions.
Advanced trading platforms and VT Markets app.
Comprehensive educational resources and daily market analysis.
Risk-free demo account to test your strategies and get confidence.
Professional customer support in multiple languages.
Ready to start trading US indices? Open a live account with VT Markets today and gain access to professional trading conditions, educational resources, and dedicated support. Our team of experts is ready to help you navigate the exciting world of index trading with confidence and precision.
Remember, while US indices offer significant opportunities, successful trading requires education, practice, and disciplined risk management. Start your journey with VT Markets and trade with a broker that understands your needs.
Written on October 24, 2024 at 3:20 pm, by valerie


