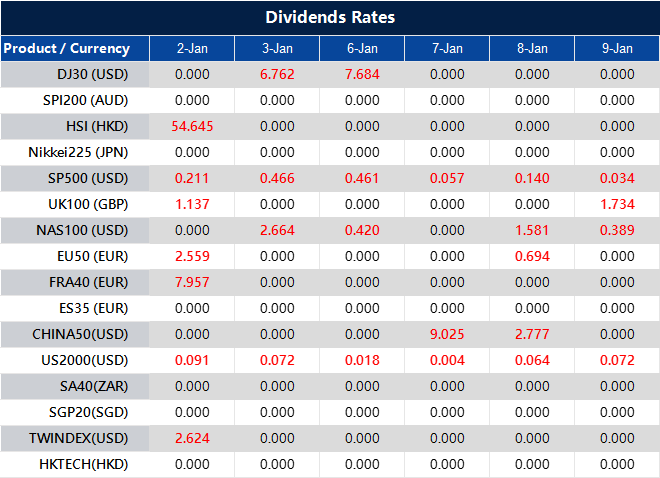
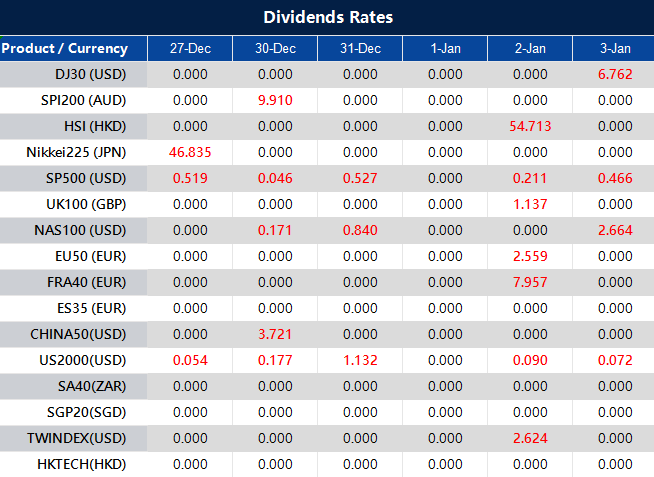
Please note that the dividends of the following products will be adjusted accordingly. Index dividends will be executed separately through a balance statement directly to your trading account, and the comment will be in the following format “Div & Product Name & Net Volume ”.
Please refer to the table below for more details:
The above data is for reference only, please refer to the MT4/MT5 software for specific data.
If you’d like more information, please don’t hesitate to contact info@vtmarkets.com.
What Are Major Currency Pairs and Why Do They Matter?
This article explores major currency pairs in forex trading, explaining their significance, unique characteristics, and factors influencing their prices. It categorizes the pairs and provides practical steps to help traders navigate the forex market effectively.
What Are Currency Pairs?
In the world of forex trading, currency pairs are the foundation. They represent the value of one currency relative to another. For example, the EUR/USD pair shows how many US Dollars are needed to purchase one Euro. These pairs are essential because they facilitate global trade, investment, and economic interaction. Traders buy or sell one currency while simultaneously selling or buying another, making currency pairs the central element of all foreign exchange activity.
Major currency pairs are the most traded pairs in the forex market. They are characterized by their high liquidity, tighter spreads, and significant trading volumes. Each pair includes the US Dollar, the world’s reserve currency, paired with another major global currency. These pairs dominate forex trading, accounting for the majority of transactions in the market. Their popularity stems from their predictability and stability compared to other foreign exchange pairs.
The list includes traditional major pairs, commodity currencies, and cross currencies, each offering unique trading opportunities. The table below shows the currency pairs, their nicknames, and the currencies in each pair.
Currency pairs
Currencies In Each Pair
Nickname
EUR/USD
Euro and US Dollar
Fiber
USD/JPY
US Dollar and Japanese Yen
Gopher
GBP/USD
British Pound and US Dollar
Cable
USD/CHF
US Dollar and Swiss Franc
Swissie
AUD/USD
Australian Dollar and US Dollar
Aussie
USD/CAD
US Dollar and Canadian Dollar
Loonie
NZD/USD
New Zealand Dollar and US Dollar
Kiwi
EUR/JPY
Euro and Japanese Yen
Yuppy
GBP/JPY
British Pound and Japanese Yen
Guppy
EUR/GBP
Euro and British Pound
Chunnel
Major forex pairs can be categorized into three groups: traditional major pairs, commodity currencies, and cross currencies:
1. What are Traditional Major Pairs?
Traditional major pairs are the most traded currency pairs in the forex market, involving the US Dollar (USD) paired with the major currencies of economically significant regions. These pairs are characterized by their high liquidity, low spreads, and frequent market activity, making them favorites among traders worldwide.
a. EUR/USD
EUR/USD, often referred to as “Fiber,” represents the Euro, the currency of the Eurozone, and the US Dollar, the world’s primary reserve currency. The Eurozone is one of the largest economic blocs globally, while the United States boasts the largest economy. This pair is the most traded currency pair in the world, making it the backbone of the forex market. Its high liquidity and stability are due to the economic strength and influence of both regions. For these reasons, EUR/USD accounts for a significant share of daily forex transactions and is a favorite among traders.
USD/JPY, nicknamed “Gopher,” combines the US Dollar and the Japanese Yen. The US Dollar serves as a global benchmark currency, while the Japanese Yen represents Japan’s strong economy, which is highly focused on exports. This pair is known for its liquidity and low trading spreads, making it attractive to both novice and experienced traders. Additionally, USD/JPY is popular for carry trading due to Japan’s historically low interest rates, which provide traders with opportunities to profit from interest rate differentials.
c. GBP/USD
GBP/USD, commonly known as “Cable,” links the British Pound and the US Dollar. The Pound represents the United Kingdom, a global financial hub, while the Dollar offers stability and widespread use in international trade. This pair reflects the historical and ongoing trade relationship between the UK and the US. It is well-known for its volatility, which attracts traders who thrive on significant price movements. As a result, GBP/USD is a popular choice for traders looking to capitalize on dynamic market conditions.
d. USD/CHF
USD/CHF, often called “Swissie,” pairs the US Dollar with the Swiss Franc. The Swiss Franc is renowned for being a safe-haven currency, representing Switzerland’s political neutrality and economic stability. The US Dollar, on the other hand, is a dominant force in global trade and finance. This pair is favored by traders during periods of geopolitical or economic uncertainty, as it provides a hedge against market volatility. Its relatively stable movements make it an excellent choice for conservative traders.
2. What are Commodity Currencies?
Commodity currencies refer to currency pairs that involve countries whose economies are heavily reliant on exports of natural resources such as oil, gold, or agricultural products. These pairs often move in tandem with commodity price trends, offering opportunities for traders interested in the commodities market.
AUD/USD, nicknamed “Aussie,” pairs the Australian Dollar with the US Dollar. The Australian Dollar is strongly influenced by the country’s exports, particularly commodities like gold, coal, and iron ore. The US Dollar’s stability adds to the pair’s appeal. This pair reflects Australia’s export-driven economy and is highly sensitive to commodity price fluctuations. Traders interested in capitalizing on global commodity trends often look to AUD/USD for opportunities.
b. USD/CAD
USD/CAD, referred to as “Loonie,” combines the US Dollar with the Canadian Dollar. Canada’s economy is heavily reliant on oil exports, making this pair highly sensitive to crude oil price fluctuations. The US Dollar provides liquidity and stability, while the Canadian Dollar offers insights into global energy markets. This pair serves as a barometer for oil market conditions and attracts traders interested in energy-linked opportunities.
c. NZD/USD
NZD/USD, commonly called “Kiwi,” represents the New Zealand Dollar and the US Dollar. The New Zealand Dollar reflects the country’s agricultural-based economy, particularly its dairy exports. The US Dollar adds liquidity and stability to this pair. NZD/USD is influenced by global risk sentiment and commodity prices, making it a popular choice for traders focusing on agricultural trends and seasonal market dynamics.
3. What are Cross Currencies?
Cross currencies are pairs that do not include the US Dollar. Instead, they consist of two other major currencies, offering traders opportunities to diversify their portfolios and explore unique trading strategies.
a. EUR/JPY
EUR/JPY, sometimes referred to as the “Yuppy,” pairs the Euro, representing the economic power of the Eurozone, with the Japanese Yen, symbolizing Asia’s third-largest economy. This pair reflects the economic relationship between Europe and Asia, making it a vital indicator for cross-market strategies. EUR/JPY is often used in risk-on/risk-off trading strategies, where traders take positions based on global market sentiment. Its strong trends make it a favorite for swing traders.
b. GBP/JPY
GBP/JPY, nicknamed “Guppy,” links the British Pound with the Japanese Yen. The Pound signifies the UK’s role as a global financial hub, while the Yen often serves as a safe-haven currency. This pair is renowned for its high volatility and large price movements, making it an exciting choice for experienced traders. GBP/JPY offers dynamic opportunities but requires strict risk management due to its unpredictable nature.
c. EUR/GBP
EUR/GBP, also known as the “Chunnel,” combines the Euro, the unified currency of the Eurozone, with the British Pound, reflecting the UK’s independent economic strength. This pair highlights the trade and economic relationships between the Eurozone and the UK. It is often influenced by political events like Brexit and the policies of the European Central Bank and the Bank of England. Traders focus on EUR/GBP to gain insights into European and UK economic trends.
Factors Influencing the Price of Major Currency Pairs
The price movements of major forex pairs are driven by a variety of economic, political, and psychological factors. Understanding these influences is key to successful trading. Below is an in-depth look at the primary factors:
Economic Indicators
Economic indicators like GDP growth, unemployment, and inflation directly influence major forex pairs. Strong GDP and low unemployment typically strengthen a currency, while high inflation can weaken it if not controlled. For example, positive economic data from the Eurozone can boost the Euro against the US Dollar in the EUR/USD pair.
Central Bank Policies
Central banks shape currency values through interest rate decisions and monetary policies. Higher rates often attract foreign investment, strengthening the currency. For instance, a Federal Reserve rate hike can increase the value of the USD, impacting pairs like USD/JPY and GBP/USD. Central bank statements also create market volatility as traders react to potential changes.
Geopolitical Events
Elections, trade agreements, and conflicts significantly impact foreign exchange pairs. Political instability weakens a currency, while stability strengthens it. For example, US elections often lead to volatility in the USD. Additionally, global crises can boost safe-haven currencies like the CHF and JPY.
Market Sentiment
Market sentiment, driven by traders’ risk appetite, influences currency demand. In risk-on environments, currencies like AUD and NZD strengthen, while in risk-off situations, safe-haven currencies like USD and JPY gain traction. Speculative trading further drives short-term volatility in major forex pairs.
Major currency pairs form the backbone of the forex market, offering high liquidity, tighter spreads, and stability. By understanding their characteristics and the factors that influence them, traders can make informed decisions and optimize their strategies. Whether you are a beginner or an experienced trader, mastering these major forex pairs is key to success in the forex market.
Trade Major Currency Pairs with VT Markets
VT Markets offers a seamless trading experience for major forex pairs through industry-leading platforms like MetaTrader 4 (MT4) and MetaTrader 5 (MT5). With tight spreads, advanced tools, and comprehensive educational resources, it caters to both new and seasoned traders. Explore opportunities across foreign exchange pairs with VT Markets, where innovation meets accessibility.
Start trading today and unlock the potential of the world’s most popular currency trading pairs with a trusted broker by your side!
Frequently Asked Questions (FAQs)
1. What are the major currency pairs in forex trading?
These major forex pairs are among the most actively traded in the global market, known for high liquidity, tight spreads, and consistent price action.
EUR/USD (Euro and US Dollar) – Nickname: Fiber
USD/JPY (US Dollar and Japanese Yen) – Nickname: Gopher
GBP/USD (British Pound and US Dollar) – Nickname: Cable
USD/CHF (US Dollar and Swiss Franc) – Nickname: Swissie
AUD/USD (Australian Dollar and US Dollar) – Nickname: Aussie
USD/CAD (US Dollar and Canadian Dollar) – Nickname: Loonie
NZD/USD (New Zealand Dollar and US Dollar) – Nickname: Kiwi
EUR/JPY (Euro and Japanese Yen) – Nickname: Yuppy
GBP/JPY (British Pound and Japanese Yen) – Nickname: Guppy
EUR/GBP (Euro and British Pound) – Nickname: Chunnel
2. What makes a currency pair a ‘major’?
A currency pair is considered a major if it includes the U.S. dollar and another leading global currency. These major forex pairs are highly liquid and tend to have more predictable price movements, making them ideal for many traders.
3. How are major currency pairs different from minor or exotic pairs?
Major pairs have higher trading volumes, lower spreads, and greater liquidity compared to minor or exotic pairs. Exotic pairs involve emerging market currencies and are often more volatile and expensive to trade.
4. Why are major currency pairs popular among traders?
Because of their deep liquidity, stable spreads, and strong correlation with economic news, major currency pairs allow traders to react quickly to market events and execute trades more efficiently.
5. How do I trade major currency pairs?
Trading major currency pairs requires a structured approach. Follow these steps to get started:
Step 1: Understand the Currency Market
Step 2: Choose a Reliable Broker
Step 3: Open and Fund Your Trading Account
Step 4: Select a Currency Pair
Step 5: Analyze the Currency Pair
Step 6: Place Your First Trade
Step 7: Implement Risk Management Tools
Step 8: Stay Informed
6. Are foreign exchange pairs affected by global news?
Yes. Foreign exchange pairs, especially major ones, are highly sensitive to geopolitical developments, economic data releases, and central bank policies. Staying informed is key to making timely decisions.
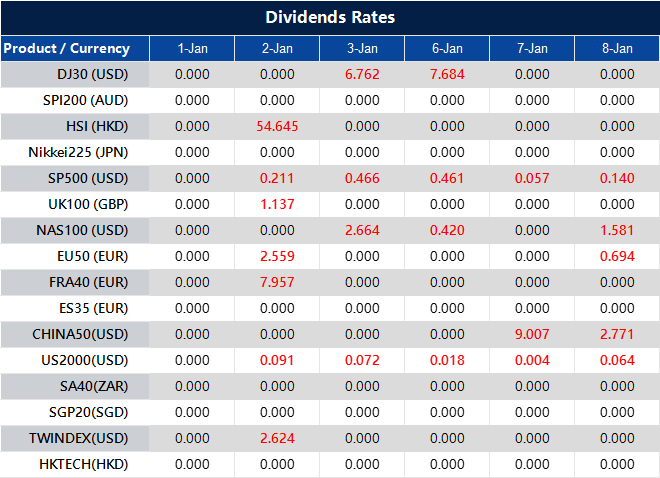
Please note that the dividends of the following products will be adjusted accordingly. Index dividends will be executed separately through a balance statement directly to your trading account, and the comment will be in the following format “Div & Product Name & Net Volume ”.
Please refer to the table below for more details:
The above data is for reference only, please refer to the MT4/MT5 software for specific data.
If you’d like more information, please don’t hesitate to contact info@vtmarkets.com.
Written on December 31, 2024 at 7:17 am, by anakin
Best Time to Trade EURUSD: What Every Trader Should Know
The EUR/USD currency pair, being the most traded in the forex market, offers numerous opportunities for traders due to its high liquidity and volatility. However, understanding the best time to trade EUR/USD can significantly enhance your trading success. Timing your trades with market activity is critical, as it directly impacts volatility, spreads, and profit potential.
When is the Best Time to Trade EUR/USD?
The best time to trade EUR/USD is during periods of high liquidity and volatility, typically when the market sees the most activity. This often occurs during the London-New York session overlap (1:00 PM – 5:00 PM GMT), as traders from two major financial hubs are active simultaneously. This period offers tighter spreads, faster trade execution, and greater price movement, making it ideal for both day traders and scalpers. Additionally, key economic data releases, such as the U.S. Non-Farm Payroll (NFP) or European Central Bank (ECB) announcements, often occur during this overlap, driving sharp market movements.
Economic events are major catalysts for EUR/USD price movements. Monitoring these events can help traders identify opportunities and prepare for volatility:
1. European Central Bank (ECB)
The ECB plays a critical role in shaping EUR/USD movements. During its meetings, the bank announces key monetary policies, such as interest rate decisions and asset purchase programs. A rate hike signals economic strength in the Eurozone, often boosting the Euro and causing EUR/USD to rise. On the other hand, dovish policies like interest rate cuts or increased quantitative easing can weaken the Euro, leading to a drop in the pair. Traders often monitor these events closely as they can create significant market volatility.
2. US Non-Farm Payroll (NFP) Report
The US NFP report, released on the first Friday of every month, is a major driver of market activity. It measures job creation in the US (excluding farm-related industries) and provides a snapshot of the economy’s health. Strong NFP data typically strengthens the US Dollar, leading to a decline in EUR/USD, while weaker-than-expected results often weaken the Dollar, driving the pair higher. For example, during a strong NFP release, the USD strengthens sharply, providing traders with high volatility and potential trading opportunities.
3. Inflation Data (CPI)
Inflation, tracked through the CPI, is a key indicator of economic stability. Both the Eurozone and the US release monthly CPI data, which central banks use to decide monetary policies. A higher CPI in the Eurozone indicates inflationary pressure, often prompting the ECB to raise interest rates, which strengthens the Euro. Conversely, if US CPI data spikes, the Federal Reserve may adopt a more hawkish stance, boosting the Dollar and lowering EUR/USD. These reports often cause short-term volatility, providing strategic trading windows.
4. Federal Reserve Meetings and Statements
Federal Reserve meetings are closely watched for announcements on interest rates and economic projections. A hawkish stance, signaling future rate hikes, strengthens the USD and typically pushes EUR/USD lower. Conversely, dovish statements hinting at stimulus or rate cuts weaken the Dollar, causing EUR/USD to rise. These meetings provide clear direction on the Fed’s monetary strategy, making them essential for traders aiming to predict currency movements.
5. Geopolitical Developments
Geopolitical events, such as elections, trade negotiations, or unexpected political crises, can cause significant fluctuations in EUR/USD. For instance, during the Brexit negotiations, uncertainty about the Eurozone’s economic stability led to sharp declines in the Euro. Similarly, US elections often create volatility due to changes in fiscal or trade policies. Staying informed about such developments can help traders anticipate potential market shifts.
6. Trade Balance and Economic Health Indicators
Trade balance and PMI reports reveal the economic health of the Eurozone and the US. A trade surplus in the Eurozone usually strengthens the Euro, while a deficit weakens it. Similarly, strong US PMI data reflecting growth in the manufacturing or services sectors can boost the Dollar. These indicators help traders gauge overall economic trends, allowing them to make informed decisions about EUR/USD positions.
The General Trading Hours for Forex Trading
The forex market operates 24 hours a day, divided into four major sessions: Sydney, Tokyo, London, and New York. These sessions overlap, creating periods of heightened activity.
Session
Time (GMT)
Sydney Session
10:00 PM to 7:00 AM
Tokyo Session
12:00 AM to 9:00 AM
London Session
8:00 AM to 5:00 PM
New York Session
1:00 PM to 10:00 PM
The most active times in forex trading are during session overlaps, such as the London-New York overlap (1:00 PM – 5:00 PM GMT), when trading volumes peak due to the simultaneous participation of traders from both regions. These hours offer the best trading conditions with high liquidity, tighter spreads, and increased volatility.
Periods outside these overlaps, such as late in the Sydney or Tokyo sessions, tend to have lower trading volumes and wider spreads, making them less favorable for trading popular pairs like EUR/USD. Understanding these general trading hours allows traders to optimize their strategies by focusing on the most profitable times while avoiding less active periods.
Volatility is a key factor that drives trading opportunities in the EUR/USD pair. The most volatile periods often coincide with major market events and specific trading hours, which see heightened activity and liquidity.
Economic Data Releases: The EUR/USD pair experiences significant volatility during major economic data releases. Key events include the US Non-Farm Payroll (NFP) report, Eurozone GDP data, and central bank meetings. These events often drive sharp price movements.
Example: An unexpected rate hike by the ECB can strengthen the Euro, pushing EUR/USD higher, while a strong NFP report typically boosts the USD, causing the pair to drop. Traders actively monitor these scheduled events to seize trading opportunities.
Overlapping Trading Sessions: The London-New York overlap (1:00 PM – 5:00 PM GMT) is the most volatile trading period for EUR/USD. This overlap combines the activity of two major markets, resulting in high liquidity, tighter spreads, and more pronounced price movements. During this time, key economic announcements often amplify volatility, creating ideal conditions for both short-term and long-term trades. Using tools like stop-loss and take-profit orders is crucial to managing risks effectively during these active hours.
Example: During a London-New York session overlap, a surprise ECB announcement may cause the EUR/USD to break out of a consolidation range, with traders leveraging the high liquidity to enter and exit positions swiftly. This is often accompanied by sharp, decisive trends that offer opportunities for both short-term and swing traders.
Register a live trading account with your chosen broker, then fund your account using a secure payment method. Deposit an amount that fits your risk management plan.
Step 4: Open a Trade
Analyze the market, set your entry and exit points, and use limits or market orders to execute trades. Always set stop-loss and take-profit levels to manage risk.
Step 5: Monitor and Close Your Trade
Track your trade’s progress, stay updated on market news, and exit your position when your target is reached or market conditions change.
Trade During Overlaps: Focus on high-activity periods like the London-New York session overlap, as it offers increased liquidity and volatility, ideal for trading EUR/USD.
Avoid Low-Volume Periods: Steer clear of quieter periods, such as the late Asian session, unless there’s significant news impacting EUR/USD that may create trading opportunities.
Stay Updated: Regularly check economic calendars for high-impact events, such as ECB meetings or US NFP reports, to anticipate market movements and adjust your trades accordingly.
Choose Trading Hours That Suit You: Select trading hours that align with your schedule, ensuring you can fully focus on the market during active periods for EUR/USD.
Use Risk Management Tools: Always use risk management tools like stop-loss and take-profit orders to protect your account from unexpected price swings and manage your risk effectively.
Timing is a vital factor in forex trading, especially with the EUR/USD pair. Identifying the best time to trade EUR/USD based on market activity and economic events can enhance your trading outcomes. Whether you’re a day trader or swing trader, aligning your strategy with key trading hours and market overlaps is essential for success.
Trade EUR/USD with VT Markets
VT Markets provides a robust platform with low spreads and advanced trading tools, ideal for trading EUR/USD. Access MetaTrader 4 (MT4) and MetaTrader 5 (MT5) with a user-friendly interface and reliable execution, even during high-volatility periods. Whether you’re timing your trades around key sessions or economic releases, VT Markets ensures you can make the most of the best time to trade currency. Start trading EUR/USD today and enjoy a seamless, professional trading experience with VT Markets.
Not ready to trade EUR/USD? Start with a demo account to practice your strategies and build confidence before diving into the live market.
Frequently Asked Questions (FAQs)
1. What is the best time to trade EURUSD?
The best time to trade EURUSD is during the overlap between the London and New York sessions, typically from 1:00 PM – 5:00 PM GMT. This period sees the highest trading volume and market volatility, offering more opportunities and tighter spreads.
2. When is the best time to buy US dollars?
The best time to buy US dollars often aligns with U.S. market hours or key economic data releases like interest rate decisions, inflation reports, or employment figures. Buying USD during high-impact news can offer better price movement, but also comes with increased risk.
3. Why is EURUSD the most popular currency pair?
EURUSD is the most traded currency pair in the world and a leading major currency pair in the forex market. It offers high liquidity, low spreads, and consistent volatility, making it attractive for traders of all levels. Its popularity stems from the global economic influence of both the U.S. and the Eurozone, allowing traders to capitalise on macroeconomic trends and news events.
4. What is the best time to trade currency overall?
The best time to trade currency is when major markets overlap, especially the London/New York window. This is when liquidity is highest and spreads are usually the tightest, making it ideal for active trading.
5. Does timing really affect forex trading results?
Yes. Trading during high-liquidity hours can lead to better price execution, smaller spreads, and more predictable market behaviour. Understanding market sessions helps you optimise your trading strategy.
Candlestick Patterns: 18 Candlestick Patterns You Should Know as a Trader
This article provides an in-depth exploration of candlestick patterns, including their formation, interpretation, and significance in market analysis. It covers key types such as bullish, bearish, and continuation patterns, offering insights into how they can signal potential market movements.
What is a Candlestick Pattern?
Candlestick patterns are among the most widely used tools in technical analysis, providing traders with insights into market trends, momentum, and potential reversals. Originating from 18th-century Japanese rice trading, candlestick charts visually represent price movements over a specific period, making it easier to identify patterns and trends at a glance.
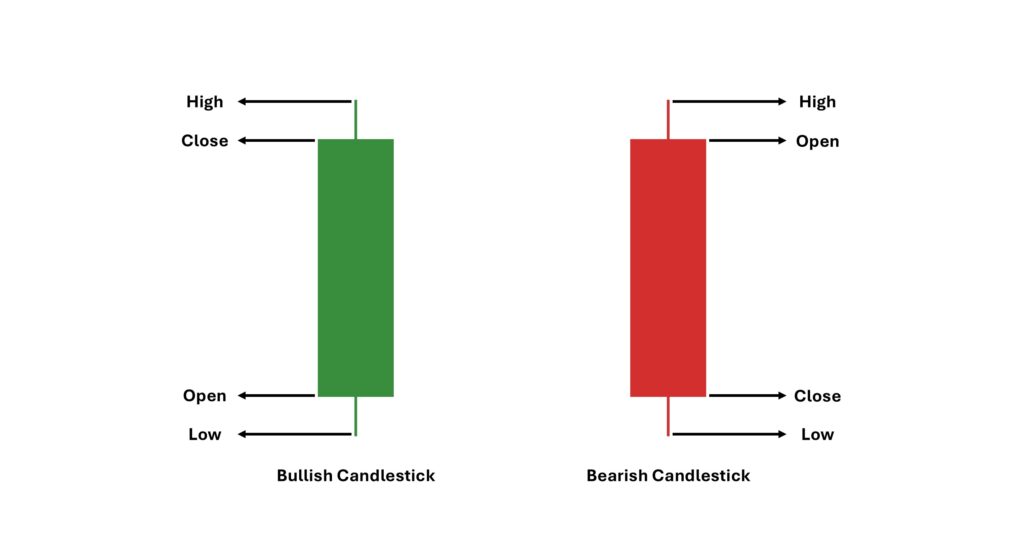
A candlestick pattern is a visual representation of price movement in the financial markets, built from a series of candlesticks that each reflect an asset’s open, high, low, and close within a specific time period. These patterns form when one or more candlesticks appear in a sequence that reflects the psychology of buyers and sellers, revealing shifts in momentum, sentiment, and potential market direction.
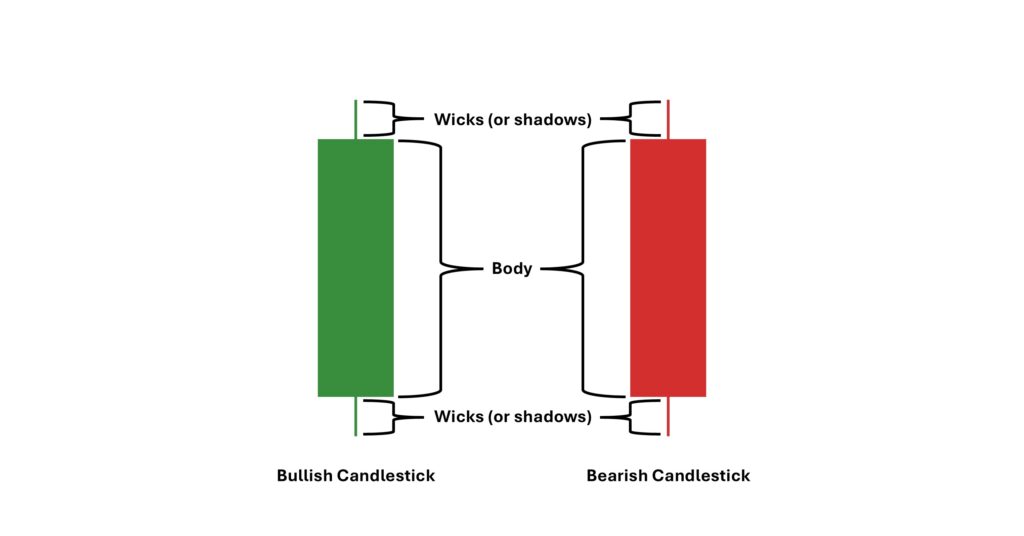
A candlestick is composed of three main parts:
Body: Indicates the opening and closing prices during a specific timeframe.
Wicks (or shadows): Represent the highest and lowest prices during the timeframe.
Color: Shows whether the market moved upward (bullish) or downward (bearish). Typically, a green or white candle is bullish, while a red or black candle is bearish.
By understanding candlestick patterns, traders can interpret market sentiment, assess momentum, and identify potential reversals or continuations. These patterns serve as a visual guide, helping traders anticipate market movements and align their strategies with prevailing trends, thereby improving decision-making accuracy.
How Are Candlesticks Formed, and How Do You Read Them?
A single candlestick is formed using four key data points:
Open: The price at the start of the period, marking where trading began.
Close: The price at the end of the period, highlighting where trading finished.
High: The highest price reached during the period, showcasing the maximum price buyers were willing to pay.
Low: The lowest price reached during the period, representing the minimum price sellers were willing to accept.
These elements collectively provide a clear snapshot of market behavior within the given timeframe, helping traders analyze sentiment and momentum effectively.
To read candlestick patterns effectively, traders focus on three critical aspects:
The body’s size: A large body reflects strong momentum in the direction of the candle, indicating dominant buyer or seller activity. A small body, on the other hand, often points to indecision or market consolidation.
The wicks’ length: Long wicks indicate that prices moved significantly in one direction but were pushed back, signaling potential reversals or resistance at those levels.
The pattern’s context: A candlestick’s importance lies in its position within the broader trend or its proximity to key support and resistance levels, which helps determine its relevance.
For example, if a bullish candlestick pattern appears near a support level, it could suggest that buyers are defending the price, and a potential upward reversal may occur. Conversely, long upper wicks near resistance might indicate selling pressure and a possible downward shift.
Types of Candlestick Patterns
Candlestick patterns are essential tools in technical analysis, offering insights into potential price movements. They are categorized into bullish patterns, bearish patterns, and continuation patterns, each serving to identify shifts or persistence in market trends.
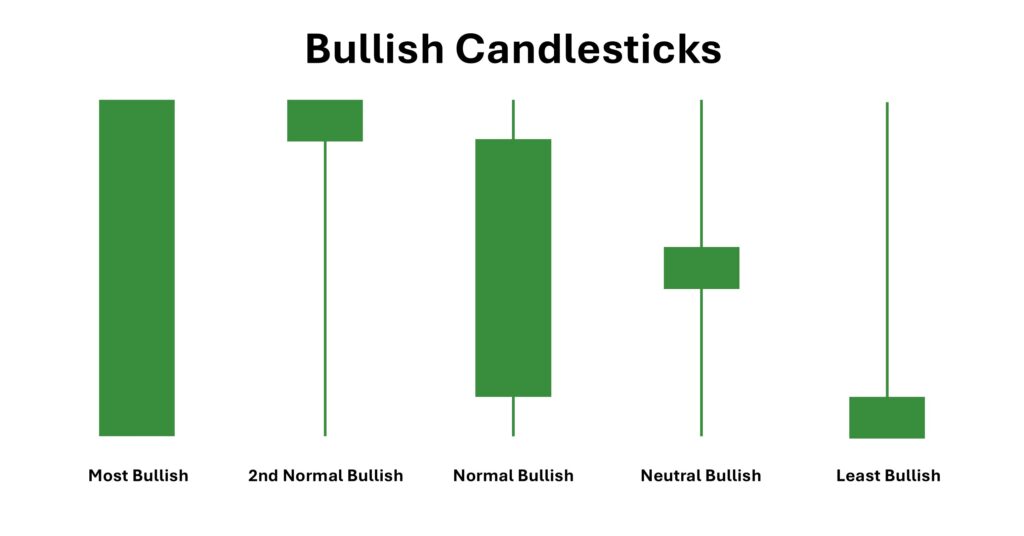
1. Bullish Candlestick Patterns
Bullish candlestick patterns are visual indicators on a price chart that suggest potential upward reversals or continued upward momentum in financial markets. These patterns typically form during downtrends or consolidation phases and signal that buyers are beginning to exert more influence, potentially overpowering sellers. They often reflect shifts in market sentiment and can help traders anticipate future price increases.
a. Hammer
The hammer is a single candlestick pattern that typically forms after a downward trend. It features a small real body near the top of the candlestick and a long lower shadow, which resembles a hammer. The absence of an upper shadow or its minimal length emphasizes the strength of the lower shadow. This pattern potentially indicates that, while sellers initially dominated the session, buyers regained control toward the close, suggesting a possible shift in market sentiment.
b. Inverted Hammer
The inverted hammer also appears to follow a downward trend and has a small real body located near the lower end of the candlestick. Unlike the hammer, its long upper shadow signifies significant buying activity during the session that was eventually subdued by sellers. This pattern may indicate resistance to continued declines, signaling a potential reversal in downward momentum if buyers gain greater control in subsequent sessions.
c. Morning Star
The morning star is a three-candle reversal pattern that emerges during a downward trend. It starts with a long bearish candle reflecting strong selling momentum. The second candle is smaller and can be bullish, bearish, or neutral, signifying a pause or indecision in the market. The pattern concludes with a large bullish candle that closes above the midpoint of the first candle, indicating a possible recovery and a shift in market sentiment toward buyers.
d. Bullish Engulfing
The bullish engulfing pattern consists of two candles and is a strong potential reversal indicator in a downtrend. The first candle is bearish, reflecting continued selling momentum. The second candle is a large bullish candlestick that completely engulfs the body of the previous bearish candle, indicating increasing buyer activity and a potential momentum shift in favor of upward price movement.
e. Piercing Line
The piercing line is a two-candle reversal pattern that forms during a downtrend. The first candle is bearish and reflects strong selling pressure. The second candle opens below the prior close but rallies to close above the midpoint of the first candle. This pattern suggests that buyers are beginning to outweigh sellers, indicating potential recovery and growing optimism in the market.
f. Three White Soldiers
The three white soldiers pattern is a series of three long bullish candles that typically follow a downtrend or period of consolidation. Each candle opens within the real body of the previous candle and closes higher, with minimal wicks, emphasizing steady buying pressure. This pattern is regarded as a sign of strong confidence among buyers and suggests sustained upward momentum.
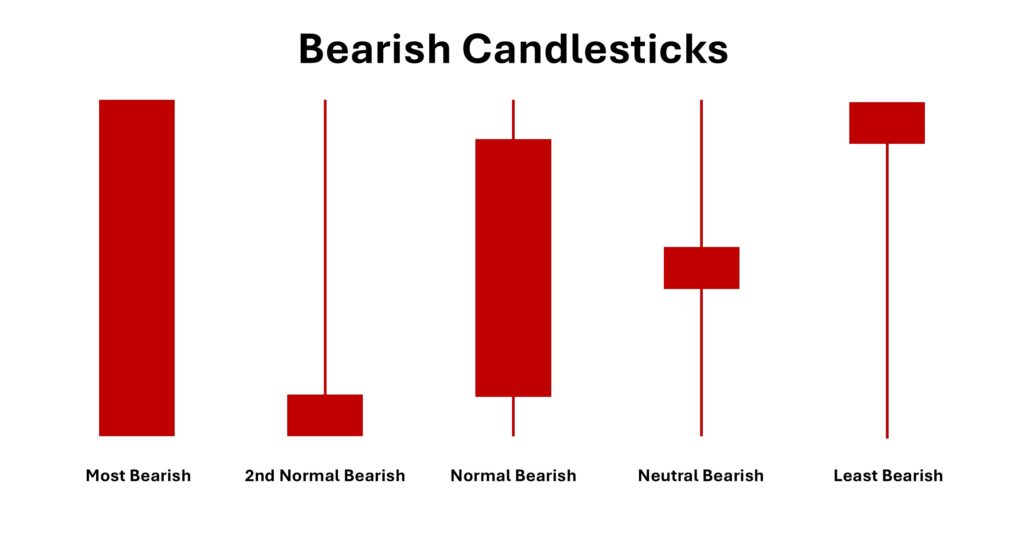
2. Bearish Candlestick Patterns
Bearish candlestick patterns are chart formations that signal potential downward reversals or continuation of a bearish trend in financial markets. These patterns typically emerge during uptrends or consolidation phases, suggesting that sellers are gaining momentum and overpowering buyers. They reflect a shift in market sentiment toward pessimism or declining confidence, often indicating future price declines.
a. Hanging Man
The hanging man is a single candlestick pattern that emerges at the end of an uptrend. It features a small body positioned near the top of the trading range and a long lower shadow, which indicates that sellers dominated the session but were unable to push the price significantly lower by the close. This pattern suggests that while the uptrend may still have some momentum, selling pressure is beginning to emerge, potentially leading to a reversal if confirmed by subsequent price action.
b. Shooting Star
The shooting star appears during an uptrend and is recognized by its small real body near the lower end of the candlestick and a long upper shadow. This pattern reflects an attempt by buyers to push prices higher during the session, but sellers ultimately regained control, forcing the close near the session’s low. The shooting star may indicate a weakening of the uptrend and the possibility of a reversal if subsequent candles confirm the pattern.
c. Evening Star
The evening star is a three-candle reversal pattern typically forming at the peak of an uptrend. The first candle is a long bullish candlestick that demonstrates strong buying pressure. The second candle is smaller and reflects market indecision or a pause in the trend, which could be bullish, bearish, or neutral. The third candle is a long bearish candlestick that closes below the midpoint of the first, signaling a potential reversal as selling pressure increases and buyers lose control.
d. Bearish Engulfing
The bearish engulfing pattern is a two-candle formation that typically appears at the end of an uptrend. The first candle is a small bullish candlestick, indicating continued upward momentum. The second candle is a large bearish candlestick that completely engulfs the body of the first, signaling a significant shift in sentiment as sellers overpower buyers. This pattern often indicates the potential onset of a downtrend if confirmed by additional bearish signals.
e. Dark Cloud Cover
The dark cloud cover pattern forms when a bearish candle follows a strong bullish candle during an uptrend. The second candle opens above the high of the first but closes well below its midpoint, signaling a rejection of higher prices and a potential shift in sentiment toward selling. This pattern suggests that sellers are beginning to exert influence, possibly leading to further declines if confirmed by subsequent bearish activity.
f. Three Black Crows
The three black crows pattern consists of three consecutive long bearish candles that typically appear after an uptrend or a period of consolidation. Each candle opens within the body of the previous candle and closes lower, with minimal wicks, indicating consistent selling pressure throughout the session. This pattern reflects growing confidence among sellers and suggests a strong bearish sentiment that could lead to continued declines.
3. Continuation Candlestick Patterns
Continuation candlestick patterns are chart formations that indicate the likelihood of a prevailing trend continuing in the same direction. They often appear during brief periods of market consolidation, where the price pauses before resuming its prior momentum. These patterns signal that either buyers or sellers are temporarily rebalancing before regaining control to sustain the existing trend.
a. Doji
The doji is a single candlestick pattern that appears when the open and close prices are nearly identical, resulting in a very thin or nonexistent body. It reflects a balance between buyers and sellers, indicating indecision in the market. Depending on the context, a doji can signal a pause in the current trend or a potential reversal, especially if it forms near significant support or resistance levels.
b. Spinning Top
The spinning top is another candlestick pattern that indicates market indecision. It has a small real body located in the middle of the candle and long wicks on both ends, showing that both buyers and sellers were active, but neither could gain control. This pattern often suggests a period of consolidation and may precede a continuation of the current trend or a potential reversal, depending on surrounding market conditions.
c. Marubozu
The marubozu candlestick lacks upper or lower shadows, with the open and close prices representing the candle’s high and low. A bullish marubozu indicates strong buying momentum as the price opened at the low and closed at the high of the session, while a bearish marubozu shows strong selling pressure. This pattern suggests decisive market sentiment and often signals the continuation of the prevailing trend.
d. Harami
The harami is a two-candle pattern that represents a potential pause or reversal in the market. The first candle is larger, and the second candle is entirely contained within its body, resembling a “pregnant” figure. A bullish harami often forms at the bottom of a downtrend, reflecting a potential hesitation in selling pressure, while a bearish harami may appear at the top of an uptrend, signaling potential buyer indecision.
e. Rising Three Methods
The rising three methods are a continuation pattern seen in uptrends. It begins with a strong bullish candle, followed by three smaller bearish candles that stay within the range of the first candle, and concludes with another strong bullish candle. This pattern indicates that selling pressure during the middle candles was absorbed, reinforcing the strength of the uptrend.
f. Falling Three Methods
The falling three methods are the bearish counterpart of the rising three methods and appear in downtrends. It starts with a strong bearish candle, followed by three smaller bullish candles within the range of the first, and ends with another strong bearish candle. This pattern suggests that temporary buying pressure was insufficient to reverse the trend, confirming the continuation of the downtrend.
Advantages and Disadvantages of Candlestick Patterns
Candlestick patterns are intuitive and versatile tools for analyzing market trends, providing comprehensive insights into price movements. However, their effectiveness is limited by subjective interpretation, potential false signals, and dependence on the broader market context.
Advantages
Visual Clarity: Candlestick charts provide an intuitive and quick way to interpret price movements, making them accessible to both beginners and experienced traders.
Versatility: Suitable for various timeframes and asset classes, including stocks, forex, commodities, and cryptocurrencies, they adapt well to different trading strategies.
Comprehensive Information: Each candlestick shows the open, high, low, and close prices, offering a complete snapshot of market activity within a given period.
Combination with Other Tools: When paired with technical indicators like RSI or Moving Averages, candlestick patterns become more reliable and enhance overall analysis.
Disadvantages
Subjectivity: Interpretation can vary among traders, leading to inconsistent conclusions and decision-making.
Limited Reliability: Candlestick patterns may generate false signals, especially in volatile markets or without additional confirmation tools.
Context Dependency: Their effectiveness depends on broader market conditions, such as trends or key support and resistance levels, which require careful evaluation.
Conclusion
Candlestick patterns are indispensable tools for traders seeking to understand market dynamics and predict potential price movements. By learning how to interpret various types of candlesticks, including bullish and bearish candlestick patterns, traders can gain valuable insights to inform their trading strategies. However, it’s crucial to use them alongside other technical tools and maintain a disciplined approach.
1. What are candlestick patterns, and why are they important in trading?
Candlestick patterns are chart formations that display price movement over a specific time frame. They help traders understand market sentiment and anticipate potential price direction based on how the market opens, closes, and fluctuates.
2. What is a bullish candlestick pattern?
A bullish candlestick pattern suggests that buying pressure is increasing, often following a downtrend. It indicates the possibility of upward price movement. Common bullish patterns include the hammer, morning star, and bullish engulfing.
3. What is a bearish candlestick pattern?
A bearish candlestick pattern reflects rising selling pressure, typically after an uptrend. It may signal that prices are likely to move downward. Examples include the shooting star, evening star, and bearish engulfing.
4. How are candlesticks formed, and how do you read them?
Each candlestick is formed based on four key data points within a selected time frame: the opening price, closing price, highest price, and lowest price. The body of the candlestick shows the range between the open and close, while the wicks (or shadows) show the highs and lows. By analysing the size, color, and shape of a candlestick, traders can interpret market sentiment and identify potential trends or reversals.
5. What are the main types of candlesticks every trader should know?
There are three main types of candlesticks: bullish candlestick patterns, bearish candlestick patterns, and continuation patterns. Each candlestick type gives traders insight into potential market movement and helps guide trading decisions.
6. How do candlestick patterns support trading strategies?
Candlestick patterns help traders make sense of market psychology and price trends. When used with other forms of analysis, they can enhance strategy development and help traders spot potential entries and exits more effectively.
7. Can I practise candlestick pattern strategies without risk?
Yes. Many platforms offer demo accounts that allow traders to practise using different candlestick patterns in a simulated environment without risking real money.
8. Do candlestick patterns guarantee profitable trades?
No, while candlestick patterns can improve trade timing and decision-making, they do not guarantee profits. It’s important to combine them with solid risk management and broader market analysis.
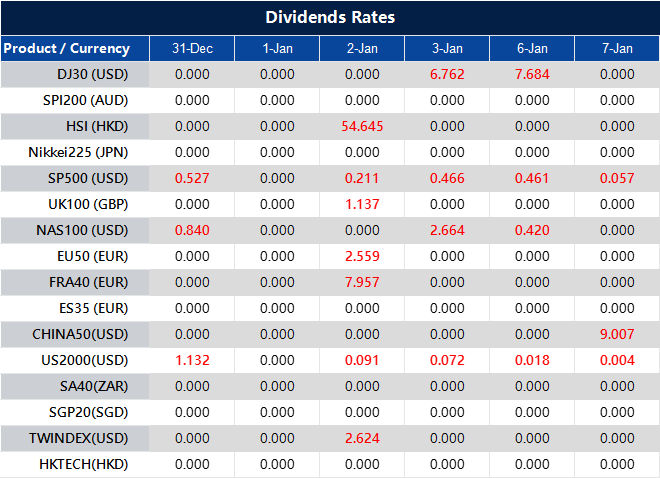
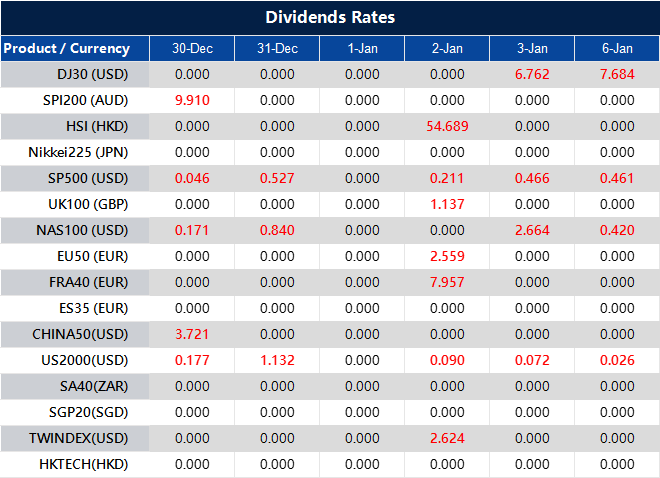
Please note that the dividends of the following products will be adjusted accordingly. Index dividends will be executed separately through a balance statement directly to your trading account, and the comment will be in the following format “Div & Product Name & Net Volume ”.
Please refer to the table below for more details:
The above data is for reference only, please refer to the MT4/MT5 software for specific data.
If you’d like more information, please don’t hesitate to contact info@vtmarkets.com.
Written on December 30, 2024 at 6:54 am, by anakin
Is Forex Trading Profitable? Here’s What You Need to Know
In this article, we discuss whether forex trading is profitable, explore the factors that influence success, and share actionable tips and strategies to help you enhance profitability and trade smarter in the forex market.
What is Forex Trading?
Forex trading, also known as foreign exchange or currency trading, is the process of exchanging one currency for another on a decentralized global market. It is the largest and most liquid financial market, with trillions of dollars traded daily. Forex trading operates through currency pairs, such as EUR/USD or GBP/JPY, where traders speculate on the price movements of these pairs to generate profit.
The appeal of forex trading lies in its accessibility. Traders can start with minimal capital, trade from anywhere, and engage in a market that operates 24/5. However, a critical question that many ask is whether forex trading is profitable, and understanding the mechanics and tools is essential to unlocking the potential of this market.
Forex trading has gained immense global popularity due to its unique characteristics that cater to a wide range of traders. From its accessibility to the potential for high returns, forex offers opportunities unmatched by other markets.
High Liquidity: The forex market processes trillions of dollars in daily transactions, making it the most liquid financial market in the world. This high liquidity ensures that traders can quickly buy or sell currencies without causing significant price changes, even when trading large volumes.
Leverage Opportunities: Forex brokers provide leverage, allowing traders to control substantial positions with minimal capital. For example, with a 1:100 leverage, a trader can manage a $100,000 trade with just $1,000. While this amplifies the potential for profits, it also heightens the risk of losses, making leverage both a powerful tool and a critical responsibility.
24/5 Market Access: Unlike traditional markets with limited hours, forex operates continuously from Monday to Friday. This around-the-clock availability accommodates traders from all time zones and provides flexibility to those balancing trading with other commitments.
Diverse Trading Strategies: The forex market supports a variety of trading styles, whether you’re a day trader seeking quick profits, a swing trader holding positions for days, or a scalper executing multiple trades in minutes. This versatility attracts traders with varying skill levels and goals.
The potential for profitability in forex trading exists, but it’s important to recognize that not everyone achieves consistent success. Is currency trading profitable? It can be, but the outcome depends heavily on the trader’s skills, strategies, discipline, and willingness to learn.
Studies suggest that only a small percentage of traders consistently generate profits, while many face challenges such as high market volatility and the risks associated with leverage. How much can you earn from forex? Earnings vary significantly; some traders manage to achieve substantial gains, while others may experience losses.
Profitability in forex trading is not guaranteed, but it is attainable for those who dedicate time to understanding the market, applying risk management techniques, and remaining disciplined in their approach. With realistic expectations and continuous improvement, traders can increase their chances of success.
Becoming consistently profitable in forex trading requires a combination of strategic planning, disciplined execution, and continuous learning. Here’s a deeper dive into five proven methods to boost profitability:
Fundamental Analysis: Monitor key economic indicators such as GDP, inflation rates, interest rate decisions, and employment data. Geopolitical events and central bank announcements also play a crucial role in currency price movements.
A trader combining these analyses gains a broader perspective, improving accuracy in predicting price movements and enhancing decision-making.
2. Manage Risks Effectively
Risk management is the cornerstone of profitable trading. Without it, even the best strategies can fail. Here’s how to manage risks:
Set Stop-Loss Orders: Define the maximum loss you’re willing to accept on each trade. Stop-loss orders automatically close your position, preventing emotional decision-making.
Proper Position Sizing: Avoid risking more than 1-2% of your trading capital on a single trade. This ensures a few losses won’t wipe out your account.
Risk/Reward Ratio: Aim for a risk/reward ratio of at least 1:2, where potential profits are double the potential loss. This ensures overall profitability, even with a lower win rate.
3. Diversify Your Trades
Relying on a single currency pair increases vulnerability to market fluctuations. Diversifying trades spreads risk and provides more opportunities:
Trade Multiple Currency Pairs: Mix major pairs (e.g., EUR/USD), minors (e.g., AUD/NZD), and exotics (e.g., USD/TRY). This reduces the impact of volatility in a specific region or economy.
Balance Correlation Risks: Be aware of correlations between pairs. For instance, EUR/USD and GBP/USD often move in tandem. Diversifying with negatively correlated or unrelated pairs can provide balance.
Leverage can be both a blessing and a curse. While it allows traders to control larger positions with less capital, it also magnifies potential losses:
Start Conservatively: Beginners should avoid high leverage. For example, instead of 1:500, consider 1:50 until you gain more experience.
Focus on Capital Protection: Leverage should be used only when confident about a trade setup. Avoid using full leverage capacity, even for seemingly “sure trades.”
Understand Margin Requirements: Ensure you have sufficient funds to avoid margin calls. A sudden market move against your position can liquidate trades if your account balance is insufficient.
5. Adopt a Long-Term Mindset
Chasing quick profits often leads to emotional decisions, overtrading, and significant losses. A long-term mindset is crucial for sustained profitability:
Prioritize Consistency Over Big Wins: Focus on achieving smaller, consistent profits rather than taking high-risk trades for large payouts. Compounding these smaller wins leads to substantial growth over time.
Stick to a Strategy: Avoid frequently changing your trading strategy. Give your plan enough time to prove its effectiveness, tweaking it based on results rather than short-term outcomes.
Learn Patience: Wait for high-probability setups instead of forcing trades. Quality over quantity is a mantra every profitable trader follows.
By mastering these five key areas, traders can significantly enhance their profitability while managing risks effectively. The journey requires patience and persistence, but the potential rewards make it worthwhile.
5 Tips to Stay Profitable in Forex Trading
Sustaining profitability in forex trading requires a disciplined approach, strategic planning, and ongoing learning. Here’s a closer look at five essential tips to help traders remain consistently profitable:
1. Stick to a Trading Plan
Create a detailed plan that defines your goals, strategies, and risk tolerance. A trading plan eliminates emotional decision-making and ensures consistency, especially during volatile market conditions. Regularly review and refine your plan as needed.
2. Control Emotions
Trading with fear or greed can lead to overtrading or holding onto losing positions. Use tools like stop-loss and take-profit orders to automate decisions and stay objective. Approach trading as a business, relying on data rather than instinct.
3. Learn from Losses
Losses are inevitable, but valuable if analyzed correctly. Use a trading journal to identify patterns, refine strategies, and avoid repeating mistakes. Treat every loss as a step toward improving your trading skills.
4. Stay Updated on Market News
Forex markets respond to economic events like interest rate changes and geopolitical developments. Use an economic calendar to track important events and plan your trades accordingly, combining technical analysis with market insights.
5. Use Demo Accounts for Practice
Practice strategies risk-free with demo accounts before trading live. Beginners can master the basics, while experienced traders can test new approaches—transition to live trading with small positions when you are confident.
Conclusion
While forex trading offers the potential for profitability, it is not guaranteed and requires a disciplined approach, continuous learning, and proper risk management. The market’s opportunities come with inherent risks, but for those willing to invest time and effort into developing their skills and strategies, profitability is possible. By adopting the right mindset, utilizing effective tools, and staying informed, traders can improve their chances of success.
Forex trading has the potential to be profitable, but it also carries significant risks. Success often depends on a trader’s knowledge, strategy, and ability to manage risk effectively. It’s important to approach the market with realistic expectations.
2. How do you make money from forex trading?
Profit in forex trading is made by speculating on the price movement of currency pairs. Traders buy or sell based on their market analysis, but outcomes can vary. A clear strategy and proper risk controls are essential to manage both gains and losses.
3. How much can you earn from forex trading?
Earnings from forex trading can differ greatly between individuals and are influenced by factors such as capital size, market conditions, risk tolerance, and strategy. While some traders see positive returns, others may incur losses, especially during volatile periods.
4. Is currency trading profitable in the long term?
Currency trading can be profitable over the long term if done with discipline, ongoing learning, and risk awareness. However, it is not guaranteed, and consistent profitability requires adapting to changing market conditions.
5. What are the main risks involved in forex trading?
Key risks include market volatility, overleveraging, and emotional decision-making. Even experienced traders face losses, which is why managing exposure and using tools like stop-loss orders is crucial.
Please note that the dividends of the following products will be adjusted accordingly. Index dividends will be executed separately through a balance statement directly to your trading account, and the comment will be in the following format “Div & Product Name & Net Volume”.
Please refer to the table below for more details:
The above data is for reference only, please refer to the MT4/MT5 software for specific data.
If you’d like more information, please don’t hesitate to contact info@vtmarkets.com.
Written on December 27, 2024 at 6:57 am, by anakin


