| VT Markets")

The final week of March brings a mix of inflation data, central bank speeches, and key economic indicators from the US, Europe, and Asia. Markets will assess whether recent monetary policy decisions, particularly from the Federal Reserve, have shifted investor sentiment, while also keeping an eye on global growth signals.
KEY INDICATORS
Monday, 24 March:
- Germany Ifo Business Climate Index (March) – A key sentiment gauge for Europe’s largest economy.
- US Chicago Fed National Activity Index (February) – Measures economic activity and inflation pressures.
Tuesday, 25 March:
- UK inflation (CPI, February) – Crucial for the Bank of England’s next rate decision.
- US new home sales (February) – A vital indicator of housing market health amid interest rate uncertainty.
Thursday, 27 March:
- Eurozone economic sentiment index (March) – Reflects business and consumer confidence in the region.
- US GDP (Q4 final estimate) – Any revision could impact Fed rate expectations.
Friday, 28 March:
- Japan Tokyo CPI (March) – A key early indicator of Japan’s inflation trends.
- US PCE price index (February) – The Fed’s preferred inflation gauge, crucial for the future policy outlook.
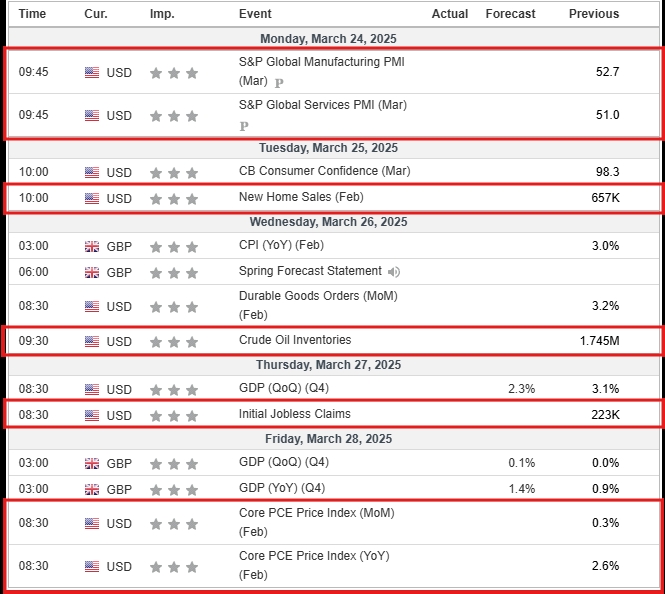
Economic calendar outlook for the coming week of 24 March 2025 to 28 March 2025, showing some of the most notable economic events to shape the second week of March. Markets are awaiting the highly anticipated CPI, new home sales, crude oil inventory, and initial jobless claims ahead of the following week’s NFP and core PCE figures.
US rebound continues while oil prices surge
US stocks have moved higher despite a choppy 24 hours, while geopolitical tensions have boosted oil!
US stocks rebound despite Fed worries
- The Federal Reserve might be desperately signalling their worries about the US economy, but traders continue to pile back into US stocks.
- It has been a choppy 24 hours for equity markets, especially in the US, which saw futures slumping this morning before a rebound in the afternoon.
- For the moment, it looks like bargain hunting continues to underpin Wall Street’s rebound, at least in the short term.
Oil prices surge
- Geopolitical tensions continue to be oil’s friend. The prospect of an extended US campaign against the Houthis combines with Israel’s renewed Gaza offensive to put oil squarely back in the spotlight.
- After its huge falls in January, positioning remains firmly skewed to the upside, and buyers continue to take advantage of headlines to drive gains for the time being.
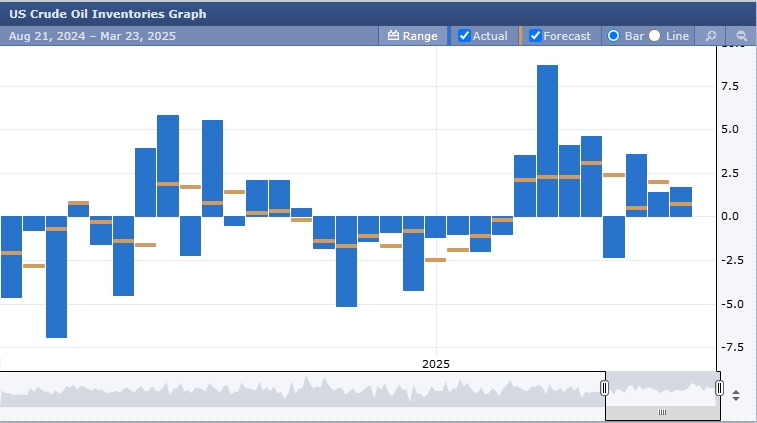
It’s the primary gauge of supply and demand imbalances in the market, which can lead to changes in production levels and price volatility. While this is a US indicator, it most affects the loonie due to Canada’s sizable energy sector.
US tightens sanctions on Iranian oil exports
- The US further tightened the screws on Iranian oil exports, including sanctioning Chinese refiner Shandong Shouguang Luqing Petrochemical Co., Ltd for buying Iranian crude oil. The refinery’s CEO was sanctioned too.
- The US Treasury Department also sanctioned an oil terminal in China for handling and storing Iranian oil, as well as a handful of tankers linked to a shadow fleet transporting Iranian oil.
- Increased enforcement of US sanctions on Iranian oil exports is an upside risk to the oil market.
- Iran exported roughly 1.4m b/d of crude oil in February, and President Trump has vowed to drive these volumes even lower.
MARKET MOVERS
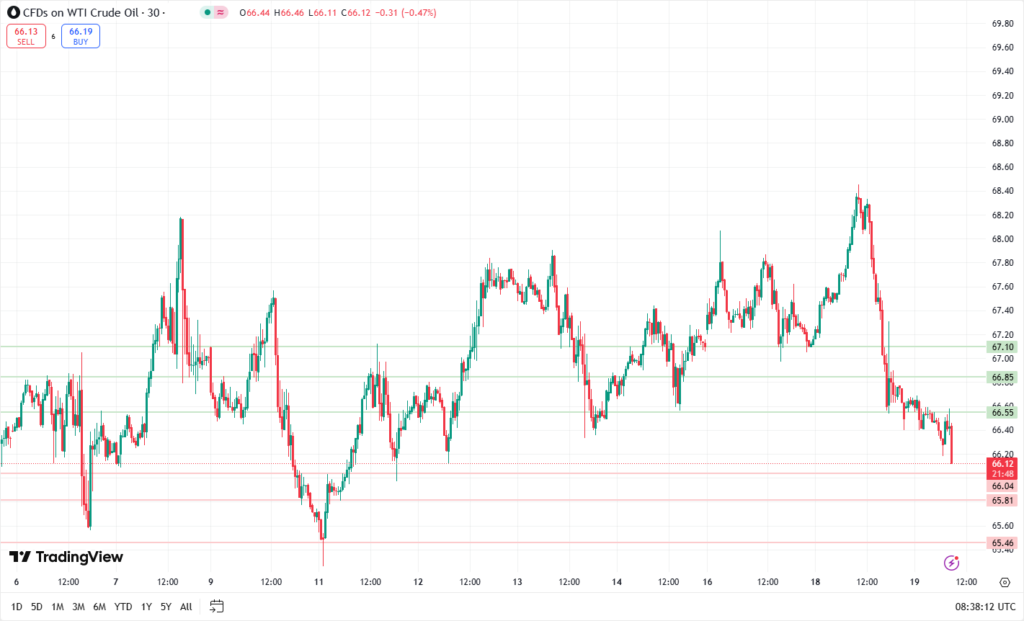
Crude oil WTI
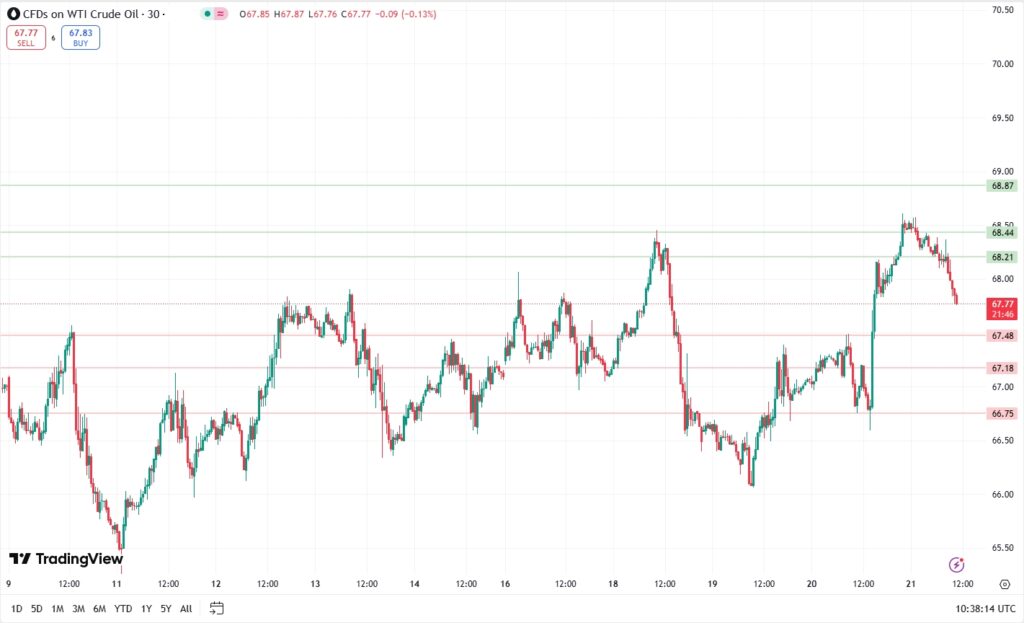
Potential long preference
Long positions above 68.21 with targets at 68.44 & 69.87 in extension.
Alternative scenario
Below 67.48, look for further downside with 67.18 & 66.75 as targets.
Even though a continuation of the consolidation cannot be ruled out, its extent should be limited.
Nikkei 225
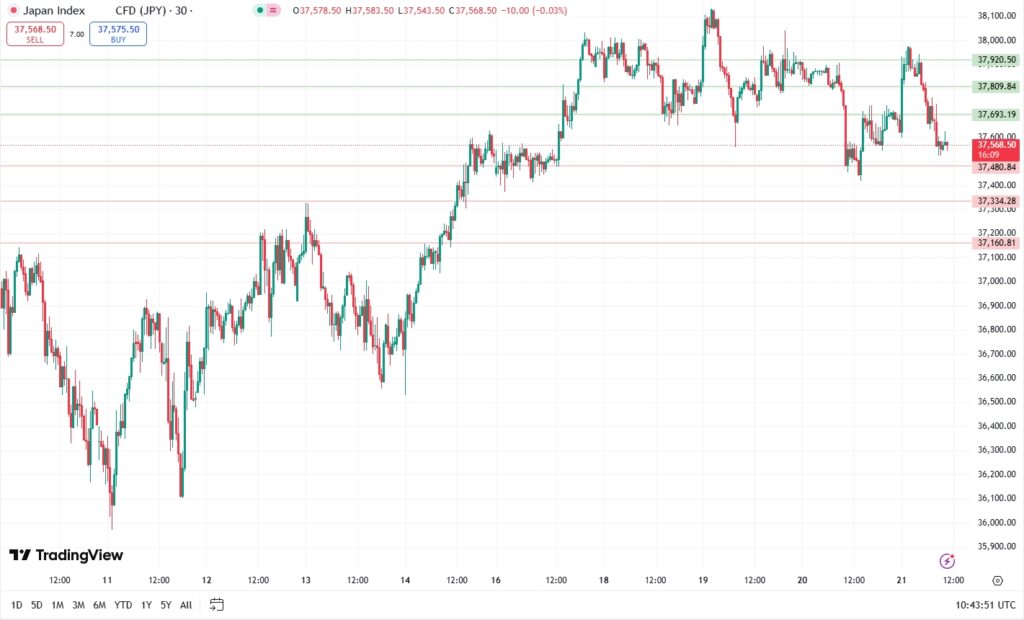
Potential short preference
Short positions below 37,480.84 with targets at 37,334.28 & 37,160.81 in extension.
Alternative scenario
Above 37,693.19, look for further upside with 37,809.84 & 37,920.50 as targets.
Even though a continuation of the technical rebound cannot be ruled out, its extent should be limited.
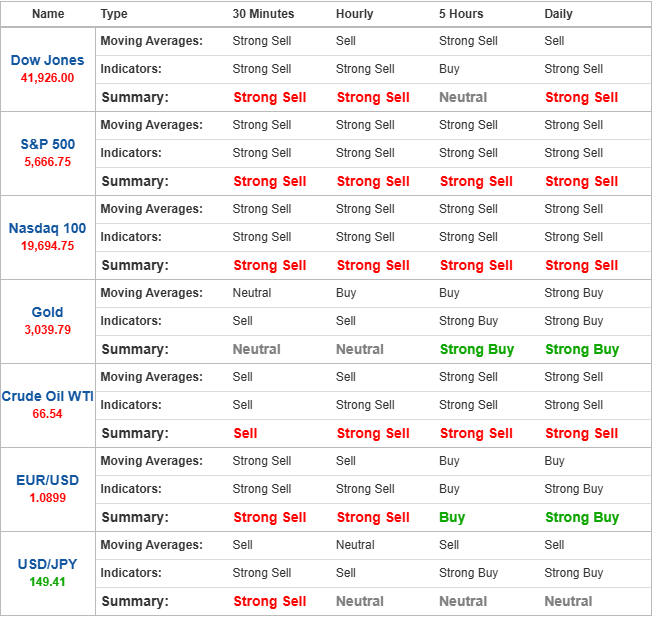
Technical indicators
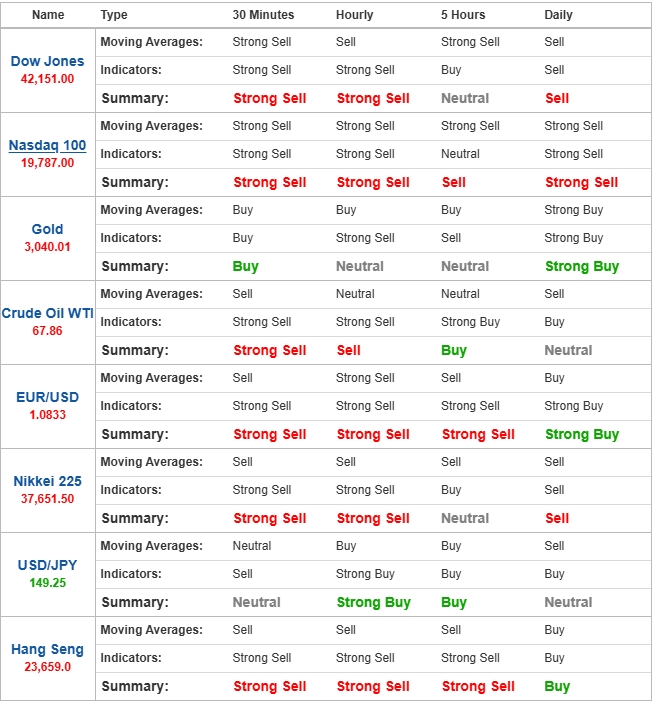
Technical indicator summary showing the volatility in various markets over a weekly period and what is to be expected, without considering the economic and fundamental events.
Nasdaq 100
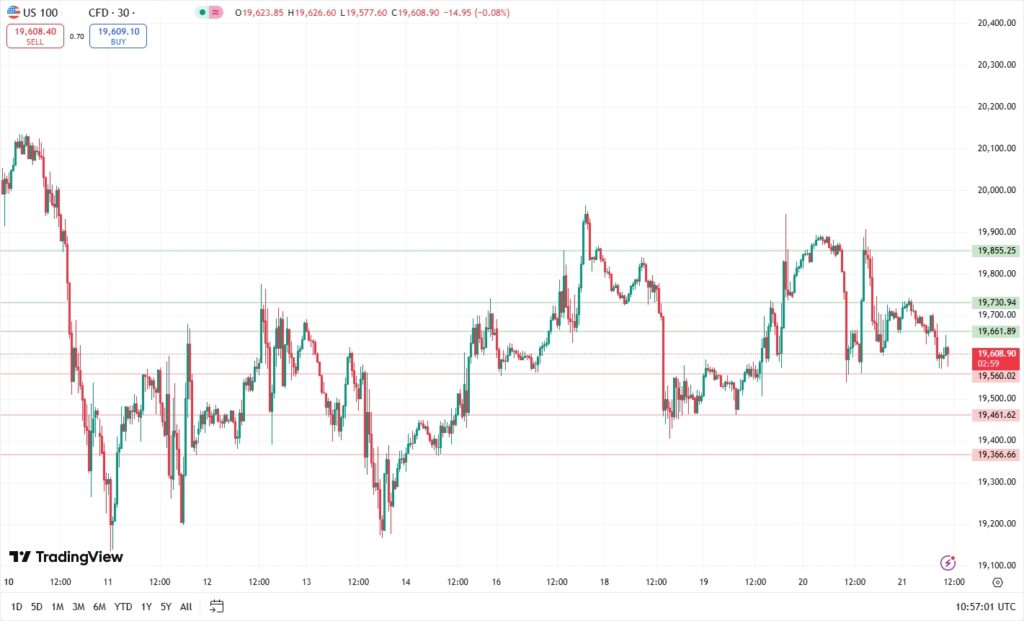
The short preference
Short positions below 19,560.02 with targets at 19,461.62 & 19,366.66 in extension.
Alternative scenario
Above 19,661.89, look for further upside with 19,730.94 & 19,855.25 as targets.
As long as 19,661.89 is resistance, look for choppy price action with a bearish bias.
NEWS HEADLINES
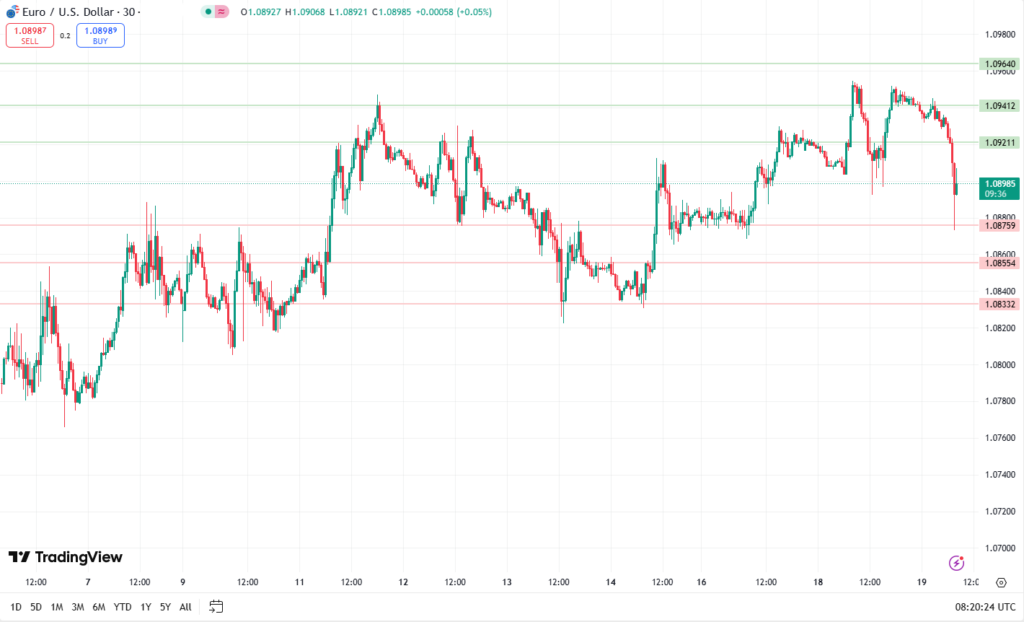
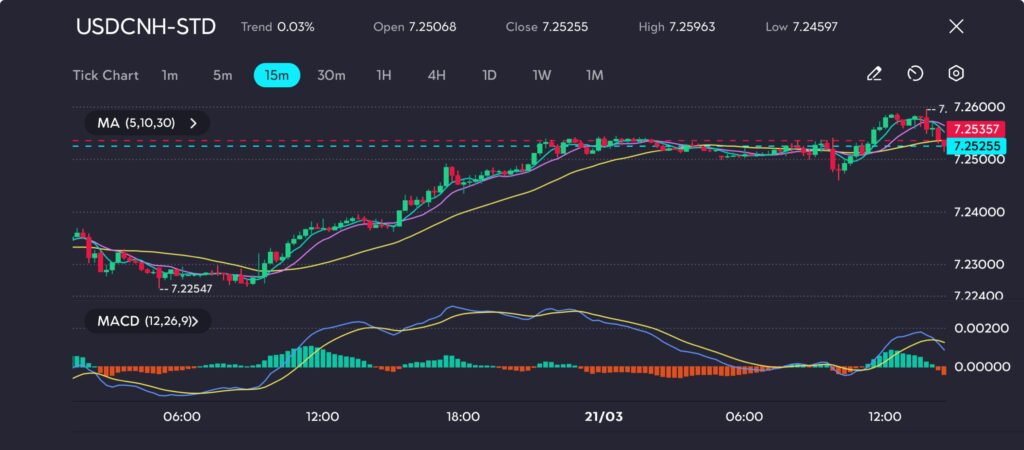
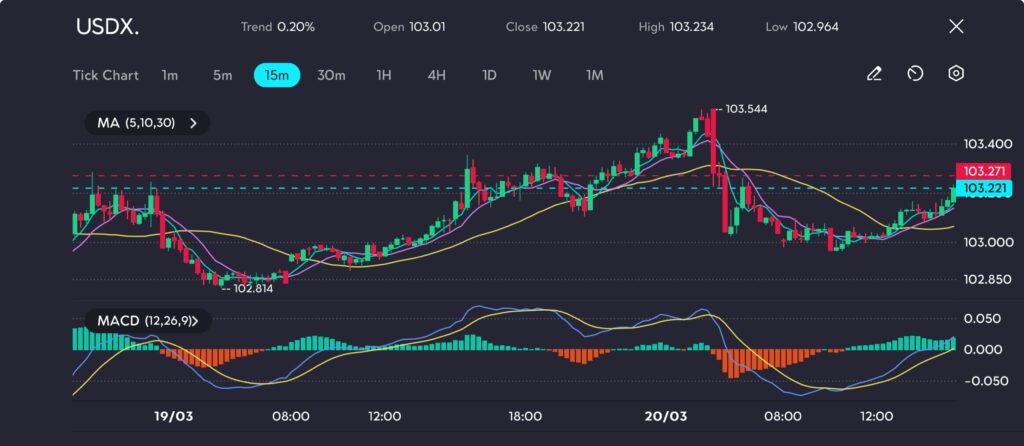
Dollar continues to rebound after Fed meeting, sterling slips
- The US dollar rose on Friday, continuing its recent rebound after the Federal Reserve saw no immediate need to cut interest rates.
- At 9:25 AM GMT, the Dollar Index, which tracks the greenback against a basket of six other currencies, traded 0.2% higher at 103.710 after gaining around 0.4% on Thursday, bouncing further away from the five-month low touched earlier this week.
- The Federal Reserve held its key rates unchanged earlier this week, as widely expected, and projected slower economic growth and higher inflation as the year progresses.
- However, the US central bank also indicated no particular rush to cut interest rates, while jobless claims data released on Thursday suggested resilience in the labour market, which is one of the Fed’s main considerations in deciding monetary policy.
- In Europe, GBP/USD fell 0.3% to 1.2926 after the Bank of England kept its key interest rate unchanged at Thursday’s policy-setting meeting.
Gold prices fall from record highs as dollar firms on easing rate cut bets
- Gold prices fell in Asian trade on Friday, extending a fall from recent record highs amid pressure from a stronger dollar as traders bet that US interest rates will remain unchanged in the near term.
- Spot gold fell 0.5% to USD 3,029.61/oz.
- Gold futures expiring in May fell 0.2% to USD 3,037.09 an ounce by 4:57 AM GMT.
- Spot prices hit a record high of USD 3,057.51/oz earlier this week.
- Gold’s fall from record highs was driven chiefly by a recovery in the dollar, which recouped all of its losses seen after Wednesday’s Federal Reserve meeting.
US stock futures fall, FedEx cuts outlook
- US stock index futures slipped lower on Friday as investors gauged the outlook for Federal Reserve policy against ongoing tariff worries as well as disappointing corporate earnings.
- At 10:35 AM GMT, Dow Jones Futures fell 140 points, or 0.3%.
- S&P 500 Futures slipped 21 points, 0.4%.
- Nasdaq 100 Futures dropped 100 points, or 0.5%.
- The Wall Street indexes gave up early gains to close lower on Thursday, but the benchmark S&P 500 index is on track for a 0.4% advance week-to-date, breaking a four-week losing streak.
Click here to open account and start trading.
 | VT Markets")

 | VT Markets")

 | VT Markets")