Bitcoin is struggling to regain momentum as market uncertainty and investor caution keep selling pressure high. A key support level has been broken, raising concerns about further drops, but some traders see potential for a short-term rebound. With external factors adding to the volatility, it’s an important moment to watch the market closely and stay informed.
BTCUSD extends losses below USD 80,000 as bearish pressure persists
BTCUSD (Bitcoin) continued its downward trajectory, slipping to a session low of USD 76,585 before rebounding slightly to trade near USD 80,213.
The ongoing selling pressure has pushed Bitcoin nearly 27% below its record high of USD 109,000, which was reached in January.
The Federal Reserve will be in no rush to cut interest rates while it waits for more clarity on how the policies of the new Trump administration affect the economy, Chair Jerome Powell said https://t.co/3ctv6xzjXv
Market sentiment remains cautious, largely due to uncertainty and declining confidence. The Federal Reserve’s recent hawkish stance, signalling that interest rates may stay elevated for an extended period, has further weighed on investor appetite for riskier assets like Bitcoin.
CME gap suggests potential rebound
Traders are keeping a close eye on the Chicago Mercantile Exchange (CME) gap between USD 83,000 and USD 90,000, created during recent price movements.
Historically, BTCUSD has shown a pattern of filling these gaps, suggesting the possibility of a short-term rebound.
However, persistent selling pressure continues to cast doubt on a sustained recovery.
Market sentiment weakens as key support breaks
The breach of the crucial USD 83,000 support level, which represents the average purchase price of mid-term holders, indicates deteriorating market confidence.
A failure to reclaim this level swiftly could result in further selling pressure, potentially driving prices lower.
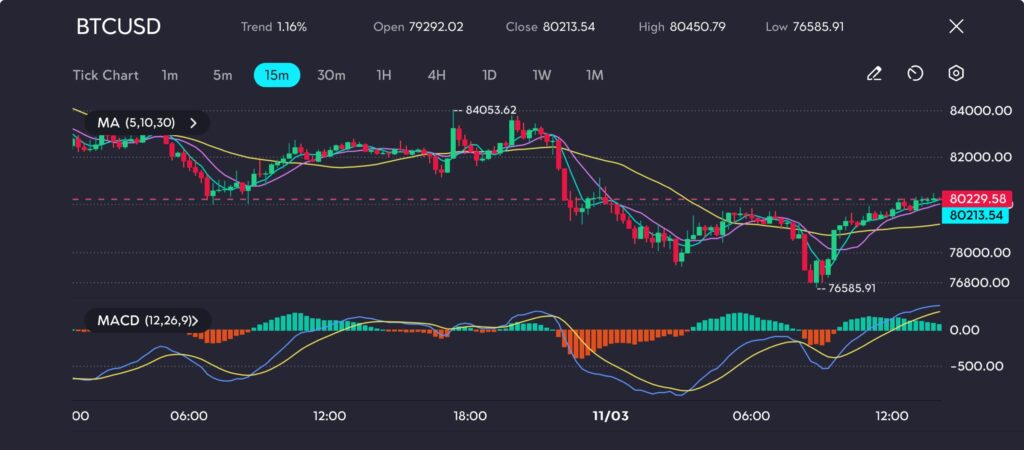
Technical outlook: bearish momentum dominates
BTCUSD remains under selling pressure despite signs of short-term recovery.
BTCUSD strengthens to 80,213.54, testing key resistance at 80,450.79 amid bullish recovery, as seen on the VT Markets app.
The moving averages (MA 5, 10, 30) show a recent crossover, indicating a potential shift in momentum. However, the 30-period MA still acts as a resistance level around USD 80,450, capping upside movements.
The MACD (12,26,9) is turning positive, with the histogram moving above the zero line, suggesting mild bullish divergence. However, the recent low of USD 76,585 remains a critical support level.
A sustained move above USD 80,200 could open the door for a test of the USD 83,000 resistance, aligning with the CME gap.
On the downside, failure to hold above USD 78,000 may trigger a retest of the USD 76,500 level, increasing the likelihood of further declines.
The best penny stocks in the UK are shares of small-cap companies that typically trade below £1 on UK exchanges such as the London Stock Exchange (LSE) and the Alternative Investment Market (AIM).
These stocks are often linked to early-stage businesses or companies undergoing change, which can create growth opportunities but also leads to higher volatility and lower liquidity. In 2026, interest in penny stocks in the UK is driven by sector rotation, innovation-led growth, and increased retail participation.
What Are Penny Stocks?
Penny stocks, also known as penny shares, are low-priced shares of small-cap companies that typically trade below £1 in the UK, most commonly on the London Stock Exchange (LSE) or the Alternative Investment Market (AIM).
Key characteristics of penny stocks in the UK include:
While penny stocks can offer growth potential, they also involve higher risk. Traders researching the best penny stocks in the UK often analyse company fundamentals, sector trends, and financial stability before investing.
Penny stocks can offer significant growth potential, but they also come with high volatility and risk. While the companies listed here have demonstrated recent positive momentum, this does not guarantee future performance. Some of these stocks have experienced price fluctuations over the past year, and their lower valuations may not fully reflect their underlying business fundamentals.
Additionally, with economic uncertainty and high interest rates, funding growth has become more expensive, increasing the risks associated with many penny stocks. As a result, some of the stocks on this list may continue to face challenges despite their recent uptrends.
Ticker
Company
Price ( £)
Recent Growth (%)
Market Cap (£)
BEG
Begbies Traynor Group
£0.922
+5%
£146.16 million
RTC
RTC Group
£0.975
+8%
£13 million
VANL
Van Elle Holdings
£0.38
+12%
£40.58 million
BRCK
Brickability Group
£0.75
+6%
£195.74 million
ULTP
Ultimate Products
£0.83
+4%
£69.18 million
EME
Empyrean Energy
£0.13
+15%
£3.11 million
CRV
Craven House Capital
£0.15
+10%
£4.76 million
DPA
DP Aircraft I Limited
£0.05
+3%
£15.36 million
EUA
Eurasia Mining PLC
£0.06
+7%
£163.45 million
TLW
Tullow Oil
£0.13
+9%
£197.41 million
Here are the 10 best penny stocks in the UK you should look at, reflecting their company overviews, potential growth factors, and a detailed look at their recent performance.
1. Begbies Traynor Group (BEG) – Business Recovery & Insolvency Experts
Begbies Traynor Group is a leading independent professional services consultancy specializing in business recovery, corporate insolvency, restructuring, and financial advisory services. The firm plays a crucial role in helping businesses navigate financial difficulties, offering solutions such as debt restructuring, asset recovery, and turnaround strategies. Given the ongoing economic uncertainty and rising insolvency cases in the UK, Begbies Traynor has seen increased demand for its expertise from businesses struggling with financial distress.
Begbies Traynor Group’s share price has risen by 5%, likely reflecting the increasing number of business closures and financial distress cases in the UK. The company’s strong position in insolvency services has helped it gain investor confidence as economic challenges persist.
Potential Growth Factors
The company may continue to benefit from rising insolvency cases, which could sustain demand for its restructuring and advisory services. Additionally, its expansion into financial consulting could create more revenue stability, while the ongoing economic climate may support the need for its services in the long term.
2. RTC Group (RTC) – Recruitment & Staffing Services
RTC Group is a UK-based staffing and recruitment services provider that specializes in supplying skilled workers to key sectors such as transportation, defense, construction, and government infrastructure projects. The company operates through several divisions, including ATA Recruitment, which focuses on engineering and technical roles, and Ganymede Solutions, which provides contract workforce solutions to the rail and infrastructure sectors.
RTC Group’s share price has increased by 8%, reflecting optimism about its role in providing skilled workers to key industries. Increased hiring demand in the infrastructure and defense sectors has likely contributed to this upward movement.
Potential Growth Factors
Government-funded infrastructure projects and workforce expansion could drive demand for RTC Group’s recruitment services. Additionally, a shift toward contract-based employment models may increase reliance on staffing solutions, helping the company grow in specialized job sectors.
3. Van Elle Holdings (VANL) – Geotechnical Engineering Firm
Van Elle Holdings is one of the UK’s largest geotechnical engineering firms, providing specialist foundation and ground stabilization services for major construction, infrastructure, and transportation projects. The company works with rail, road, housing, and commercial developers, delivering piling, ground improvement, and structural support solutions that are critical to the stability and longevity of buildings and infrastructure.
Van Elle Holdings has seen an impressive 12% increase in share price, suggesting investor optimism regarding its role in infrastructure projects. The UK government’s commitment to construction projects may be driving increased market interest in this stock.
Potential Growth Factors
The company could see continued growth due to government-backed infrastructure investments that require specialist foundation services. Increasing urban expansion and commercial development may also support higher demand for its engineering solutions.
4. Brickability Group (BRCK) – Building Materials Supplier
Brickability Group is a leading supplier of bricks, roofing, and other essential construction materials to residential, commercial, and infrastructure projects in the UK. The company has a strong distribution network and works closely with housebuilders, developers, and contractors to provide high-quality building materials at competitive prices. Its acquisition strategy has allowed it to expand its portfolio, diversify revenue streams, and strengthen its market position in the UK construction industry.
The company’s share price has grown by 6%, aligning with a steady demand for construction materials despite broader economic pressures. Investors appear optimistic about the company’s resilience and ability to navigate shifting market conditions.
Potential Growth Factors
If housing demand recovers, Brickability Group could benefit from increased material sales. Additionally, strategic acquisitions may help the company expand its market presence, while its diversification into multiple construction sectors could provide some protection against economic slowdowns.
Ultimate Products is a consumer goods company specializing in homeware, kitchen appliances, and electrical goods. The company owns and manages a portfolio of affordable, high-quality brands, supplying major UK retailers such as Tesco, Argos, and Amazon. It focuses on value-oriented products, making it well-positioned to benefit from shifting consumer behavior during periods of economic uncertainty when shoppers prioritize budget-friendly essentials.
While the stock has risen by 4%, it remains a relatively stable player in the retail sector. This increase likely reflects strong consumer demand for budget-friendly household products in an inflationary environment.
Potential Growth Factors
Expansion into international markets could create new revenue opportunities, while growing demand for affordable home appliances may support long-term sales. The company’s strong retail partnerships could also help secure a stable market position.
6. Empyrean Energy (EME) – Oil & Gas Exploration Company
Empyrean Energy is an oil and gas exploration company with assets in China, Indonesia, and the United States. The company focuses on developing high-impact exploration projects, including its offshore drilling projects in China’s Pearl River Basin, which hold significant untapped energy potential. With an emphasis on high-risk, high-reward drilling operations, Empyrean Energy aims to capitalize on global energy demand and rising commodity prices.
Empyrean Energy has posted a 15% surge in share price, making it one of the strongest performers on this list. The rise is likely due to positive market sentiment around energy stocks, particularly as oil prices remain a key economic driver.
Potential Growth Factors
If global energy demand remains strong, Empyrean Energy could see continued investor interest. Further exploration success in key regions may drive revenue, while securing new drilling licenses could expand the company’s production potential.
7. Craven House Capital (CRV) – Investment Holding Company
Craven House Capital is an investment firm focused on undervalued global assets, with investments spanning real estate, private equity, and special situations. The company identifies and acquires distressed or undervalued businesses in an effort to unlock long-term value for shareholders. By maintaining a diverse portfolio, Craven House Capital seeks to hedge against market downturns and capitalize on emerging growth opportunities in different sectors.
The share price has risen by 10% as investors look for alternative investments in undervalued assets. With the market searching for hidden value, Craven House Capital is benefiting from renewed interest.
Potential Growth Factors
By maintaining a diversified portfolio, Craven House Capital may reduce its exposure to sector-specific risks. Additionally, strategic acquisitions and potential market recoveries could lead to asset value appreciation, boosting overall company performance.
8. DP Aircraft I Limited (DPA) – Aviation Leasing Firm
DP Aircraft I Limited is a specialist aviation leasing company that provides commercial aircraft leasing solutions to major airlines worldwide. The company owns and leases Boeing 787 Dreamliner aircraft, primarily under long-term contracts with airline operators. DP Aircraft I Limited generates revenue from lease agreements with airlines, making its performance closely tied to the global aviation industry and airline profitability.
Despite a modest 3% gain, DP Aircraft I Limited continues to show signs of recovery as air travel demand strengthens. The increase likely reflects growing confidence in aviation leasing as a long-term business model.
Potential Growth Factors
With the global airline industry rebounding, demand for aircraft leasing could increase. Additionally, the company’s long-term lease agreements may provide reliable revenue streams, while expanding its fleet could further enhance its market position.
Eurasia Mining PLC is a precious metals exploration and mining company focused on platinum group metals (PGMs) and gold mining in Russia and the surrounding regions. The company holds several licenses for mining operations in the Kola Peninsula and Ural Mountains, where it explores and extracts palladium, platinum, rhodium, and gold. Given the rising demand for PGMs in the automotive and technology sectors, Eurasia Mining is positioned as a potential long-term player in the industry.
The company’s share price has increased by 7%, benefiting from stronger commodity prices and sustained demand for precious metals as a hedge against inflation.
Potential Growth Factors
With rising global demand for platinum and gold, Eurasia Mining could see increased investor interest. Ongoing exploration projects may lead to new resource discoveries, and potential joint ventures with major mining firms could accelerate growth.
Tullow Oil is a leading independent oil and gas exploration and production company with a strong presence in Africa and South America. The company’s assets include major offshore and onshore oil fields in Ghana, Kenya, and Guyana. Tullow Oil has a strategy focused on maximizing production efficiency, reducing operational costs, and expanding exploration to discover new reserves.
With a 9% gain in share price, Tullow Oil continues to attract investors due to steady crude oil prices and growing production output. As one of the more stable energy players, its growth remains tied to macroeconomic trends in oil demand.
Potential Growth Factors
If oil prices remain stable, Tullow Oil could sustain revenue growth. The company’s expansion of production capacity may further improve profitability, while its debt reduction efforts could strengthen financial stability.
This list highlights 10 notable penny shares in the UK based on recent market performance, industry trends, and financial data. It does not constitute financial advice or a recommendation to buy or sell any security. Traders should conduct their own research and consult with financial professionals before making investment decisions. Penny shares are highly volatile, and their prices can fluctuate significantly within short periods.
How to Trade or Invest in UK Penny Shares
Investing in penny stocks in the UK requires a strategic approach due to their volatility. Here’s how you can get started:
1. Conduct Market Research
Before you start trading or investing in penny stocks in the UK, it’s essential to understand their volatility, risk, and potential rewards. Researching company fundamentals, industry trends, and stock liquidity can help you make informed decisions and manage risk effectively.
2. Choose a Reliable Trading Platform
Selecting a trusted and regulated broker is crucial when trading penny stocks. VT Markets provides a user-friendly trading platform, competitive spreads, real-time market data, and access to a wide range of UK penny stocks, helping traders execute trades efficiently.
Set stop-loss and take-profit levels to mitigate losses and lock in gains while trading penny stocks.
5. Monitor & Stay Informed
Follow market news, earnings reports, and stock trends to stay ahead. The best penny stocks in the UK often react quickly to economic changes and industry developments.
Investing in penny stocks in the UK requires a careful, research-driven approach. By understanding their inherent volatility and risk-reward profile, choosing a reliable broker like VT Markets, and using a mix of fundamental analysis and technical analysis, you can better identify the best penny stocks to buy. Remember, these guidelines are for informational purposes only and should not be considered financial advice. Hence, thorough research and a cautious approach are essential before investing.
Trade UK Penny Stocks with VT Markets
VT Markets provides a seamless trading platform for penny stocks in the UK, offering competitive pricing with low spreads and no hidden fees. Traders can take advantage of advanced trading tools for in-depth analysis, along with fast execution to capitalize on short-term market opportunities. Additionally, risk management features, such as stop-loss and take-profit orders, help traders manage their exposure effectively. For those looking to trade the best penny stocks in the UK, VT Markets delivers a professional and well-equipped trading environment with access to a wide range of financial instruments.
Penny stocks in the UK refer to shares of small-cap companies that typically trade below £1 per share. These stocks are known for their high volatility, offering both potential high returns and significant risks.
2. Are penny shares a good investment?
Penny stocks can be profitable but come with high risk due to their price fluctuations and lower liquidity. They are best suited for traders who understand market volatility and use risk management strategies to protect their capital.
3. How do I find the best penny shares to buy?
The best penny stocks UK can be identified through a combination of fundamental and technical analysis. Look at company earnings, financial health, trading volume, price trends, and industry potential to make informed decisions.
4. What are the top 10 UK penny stocks that could explode?
Here’s a list of some of the top-performing UK penny stocks that could explode, offering strong potential for growth:
BEG – Begbies Traynor Group
RTC – RTC Group
VANL – Van Elle Holdings
BRCK – Brickability Group
ULTP – Ultimate Products
EME – Empyrean Energy
CRV – Craven House Capital
DPA – DP Aircraft I Limited
EUA – Eurasia Mining PLC
TLW – Tullow Oil
5. What is the difference between investing and trading penny stocks?
Investing in penny stocks involves holding shares for a long-term period, focusing on company growth and financial performance. Trading, on the other hand, focuses on short-term price movements, often using technical analysis for entry and exit points.
6. Can I trade penny shares with VT Markets?
Yes, VT Markets provides access to a wide range of penny stocks in the UK with fast execution, advanced charting tools, and risk management features.
7. Do penny stocks pay dividends?
Most penny stocks in the UK do not pay dividends as they are small-cap companies focused on growth rather than returning profits to shareholders. However, some established small companies may offer dividends over time.
8. What strategies can I use when trading penny stocks?
Some common trading strategies include momentum trading, breakout trading, swing trading, and scalping. Combining fundamental research with technical indicators can improve your chances of success.
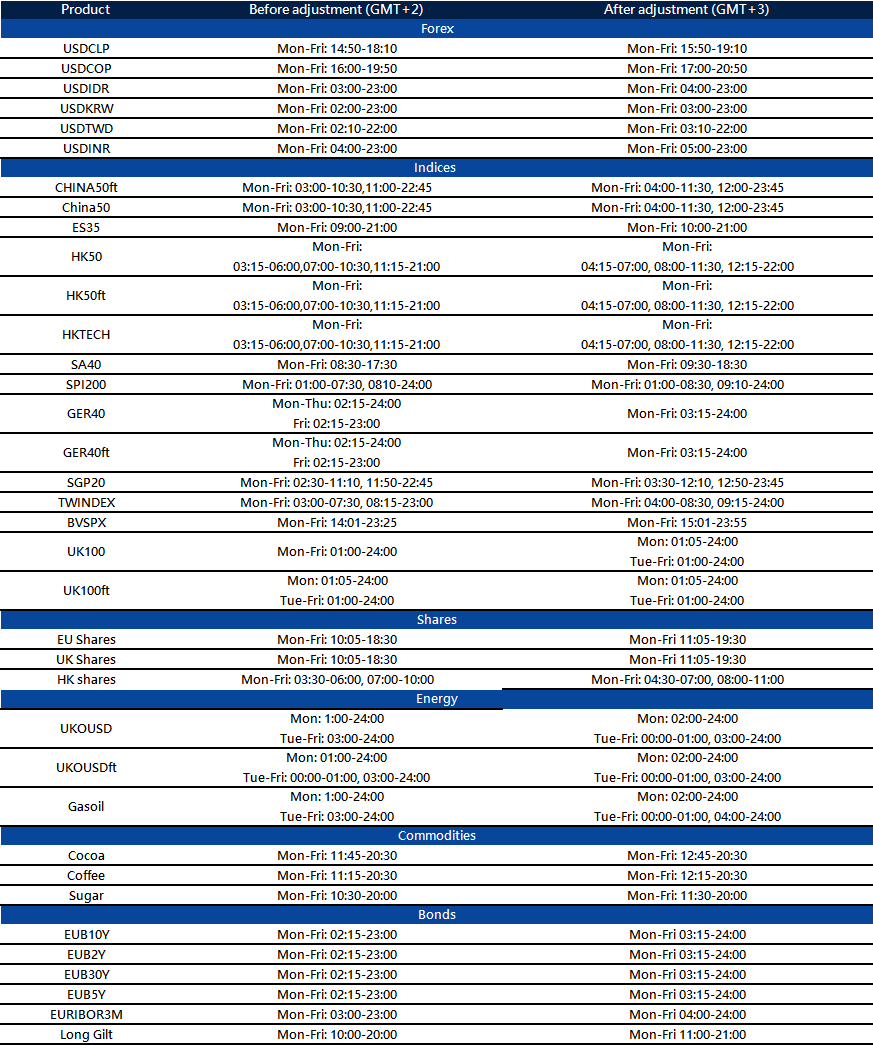
Please note that the dividends of the following products will be adjusted accordingly. Index dividends will be executed separately through a balance statement directly to your trading account, and the comment will be in the following format “Div & Product Name & Net Volume ”.
Please refer to the table below for more details:
The above data is for reference only, please refer to the MT4/MT5 software for specific data.
If you’d like more information, please don’t hesitate to contact info@vtmarkets.com.
The trading week starts with crucial economic data from Asia and Europe, shaping market sentiment worldwide. Investors are watching growth indicators and industrial reports, adjusting their positions ahead of major US inflation data later in the week.
KEY INDICATORS
Japan GDP (Q4 2024 final estimate)
The final reading of Japan’s GDP growth will provide key insights into the country’s economic recovery. Any revisions could impact the JPY and influence broader Asian market sentiment.
UK industrial & manufacturing production (January)
A crucial indicator of the UK’s economic activity, affecting the GBP and shaping investor confidence in Britain’s economic momentum.
Eurozone Sentix investor confidence (March)
A leading gauge of investor sentiment in the Eurozone. A strong reading could signal growing economic optimism, while a weak result may highlight lingering concerns overgrowth.
US market positioning ahead of inflation data
With the US CPI report set for release on Tuesday, traders may take a cautious stance, potentially leading to market consolidation.
MARKET MOVERS
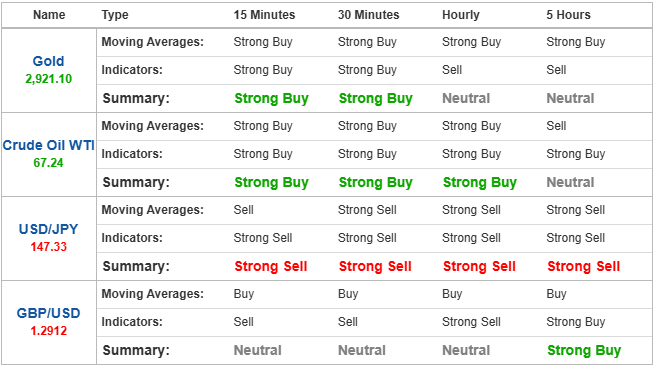
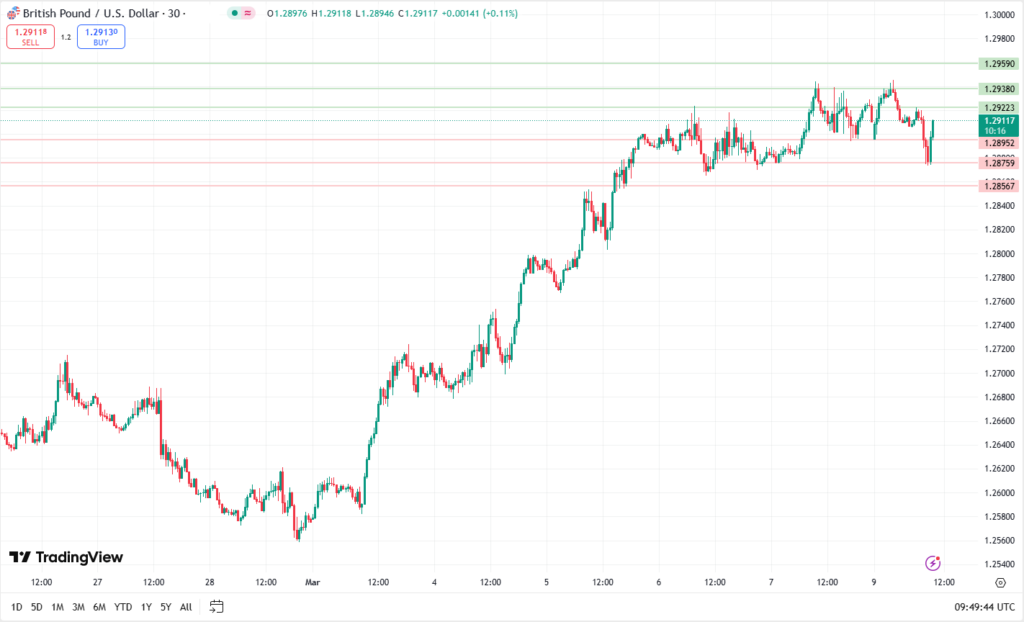
GBP/USD
Possible long preference Long positions above 1.29223 with targets at 1.29380 & 1.29590 in extension. Alternative scenario Below 1.28952 look for further downside with 1.28759 & 1.28567 as targets. A support base at 1.28952 has formed and has allowed for a temporary stabilisation.
European markets reverse course to trade lower as volatility persists
European markets edged lower on Monday, erasing earlier gains and extending the volatility seen in global markets last week.
The pan-European Stoxx 600 was down 0.3% at 9:26 a.m. London time, with all major indices in negative territory.
Germany’s DAX fell 0.5%, retreating after a brief early-session rise.
Regional markets closed in the red last Friday, capping off a turbulent week driven by shifting US tariff policies, the latest European Central Bank rate cut, and weaker-than-expected US nonfarm payrolls, which rose by just 151,000 in February.
Japan’s 30-year bond yield hits highest level since 2008; Nikkei leads Asia losses
Asia-Pacific markets declined on Friday as Japanese government bond yields surged to their highest levels since the 2008 financial crisis.
Meanwhile, customs data from China showed that exports rose 2.3% year-on-year in US dollar terms for the January–February period, falling short of the expected 5% increase.
Japan’s Nikkei 225 led regional losses, dropping 2.17% to close at 36,887.17.
South Korea’s Kospi fell 0.49%, ending the session at 2,563.48.
Australia’s S&P/ASX 200 plunged 1.81%, reaching a six-month low of 7,948.20.
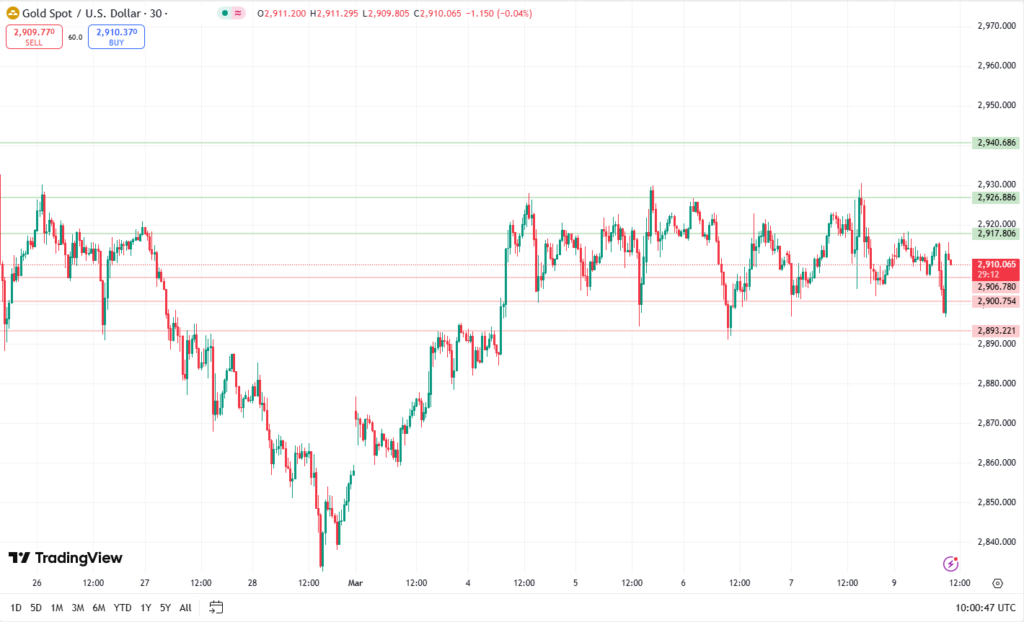
XAU/USD
Possible long preference Long positions above 2917.80 with targets at 2926.88 & 2940.68 in extension. Alternative scenario Below 2906.78 look for further downside with 2900.75 & 2893.22 as targets. A support base at 2900.75 has formed and has allowed for a temporary stabilisation.
TODAY’S NEWS HEADLINES
Oil steady as tariff uncertainty keeps investors on edge
Oil prices remained stable on Monday as concerns over US import tariffs, global economic growth, and fuel demand weighed on investor sentiment. Rising output from OPEC+ producers also dampened appetite for riskier assets.
Brent crude edged down USD 0.11 to USD 70.25 per barrel by 8:56 AM GMT.
West Texas Intermediate (WTI) crude slipped USD 0.17 to USD 66.87 per barrel.
Last week marked WTI’s seventh consecutive weekly decline, the longest losing streak since November 2023, while Brent crude posted its third straight weekly loss.
Gold prices held firm in Asian trading on Monday after modest gains last week, as the US dollar hovered near a four-month low amid uncertainty over US trade policies.
Investors also scrutinised last week’s US jobs report and Federal Reserve Chair’s comments to gauge the central bank’s future interest rate stance.
Spot gold was largely unchanged at USD 2,911.21 per ounce.
Gold futures (April contract) edged up 0.1% to USD 2,918.27 an ounce by 6:05 AM GMT.
Platinum futures remained steady at USD 966.25 an ounce.
Silver futures gained 0.3%, trading at USD 32.943 an ounce.
Dollar steadies after slump; euro retreats after weekly gains
The US dollar edged higher on Monday, rebounding from a four-month low, but remained under pressure amid concerns that Trump administration trade policies could slow economic growth.
At 9:10 AM GMT, the Dollar Index—which tracks the greenback against a basket of six major currencies—rose 0.1% to 103.959, just above last week’s four-month low.
EUR/USD dipped 0.2% to 1.0816, retreating after logging its best weekly performance since 2009, driven by Germany’s fiscal reforms.
GBP/USD fell 0.3% to 1.2880, giving up some gains after sterling hit a four-month high of 1.2946 earlier in the session.
USD/JPY dropped 0.6% to 147.17, nearing its lowest level since early October.
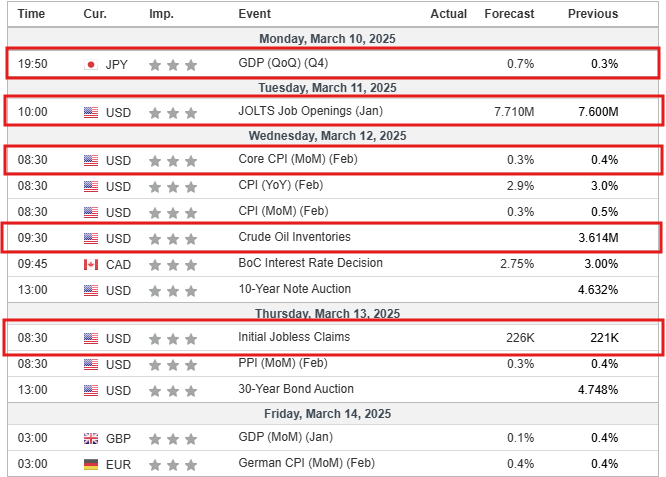
This week, global markets will focus on key economic data releases, central bank decisions, and geopolitical developments. With inflation trends, employment reports, and monetary policy updates on the agenda, investors should prepare for potential volatility across equities, forex, and commodities.
KEY INDICATORS
Monday, 10 March:
Japan GDP (Q4 2024 Final Estimate) – A key indicator of Japan’s economic health, impacting the JPY and regional markets.
UK Industrial Production (January) – Provides insights into Britain’s economic momentum.
Tuesday, 11 March:
US Inflation Report (February CPI) – A crucial release for Federal Reserve policy expectations. Markets will react strongly to any deviations from forecasts.
Germany ZEW Economic Sentiment Index – A leading indicator of economic confidence in the Eurozone’s largest economy.
Thursday, 13 March:
European Central Bank (ECB) Interest Rate Decision – The ECB’s stance on inflation and future rate moves will be closely watched.
US Producer Price Index (PPI, February) – Inflationary pressures at the wholesale level could influence Fed policy expectations.
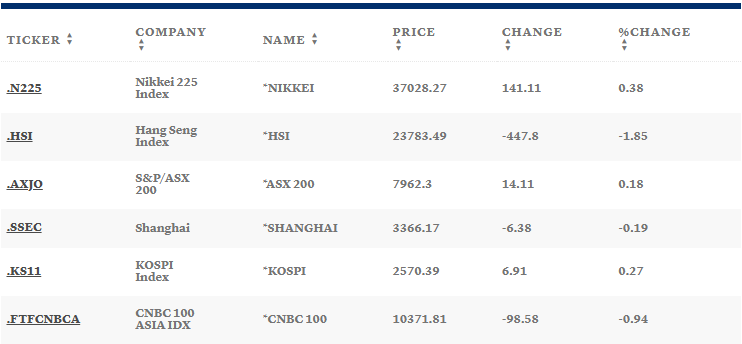
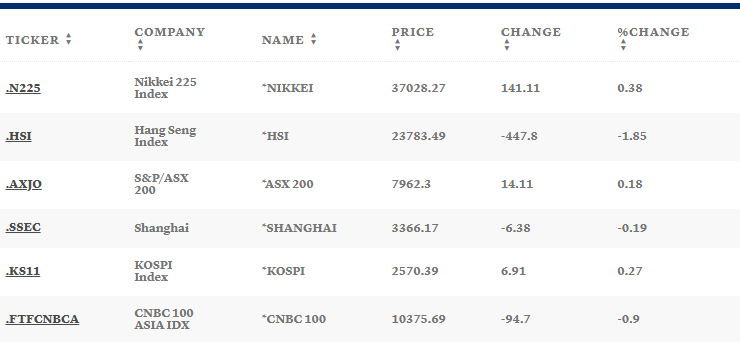
Asia-Pacific markets mixed after volatile trading week
Asia-Pacific markets were mixed on Monday after a volatile trading week around the world.
US stocks — which are expected to open lower on Monday — have been on a roller-coaster ride since the start of the month due to uncertainty surrounding US President Donald Trump’s tariff policies, and their impact on the superpower’s growth and inflation.
Japan’s benchmark Nikkei 225 led gains in Asia, rising 0.38% in choppy trade, to end the day at 37,028.
The broader Topix index, meanwhile, fell 0.29% to close at 2,700, paring earlier gains.
The country’s cash earnings rose 2.8% year-on-year in January, slowing from December’s revised 4.4% climb.
South Korea’s Kospi added 0.27%, to end the day at 2,570, while the small-cap Kosdaq fell 0.26% to 725.
Australia’s S&P/ASX 200 rose 0.18% to end the day at 7,962, after closing at a six-month high in its previous session.
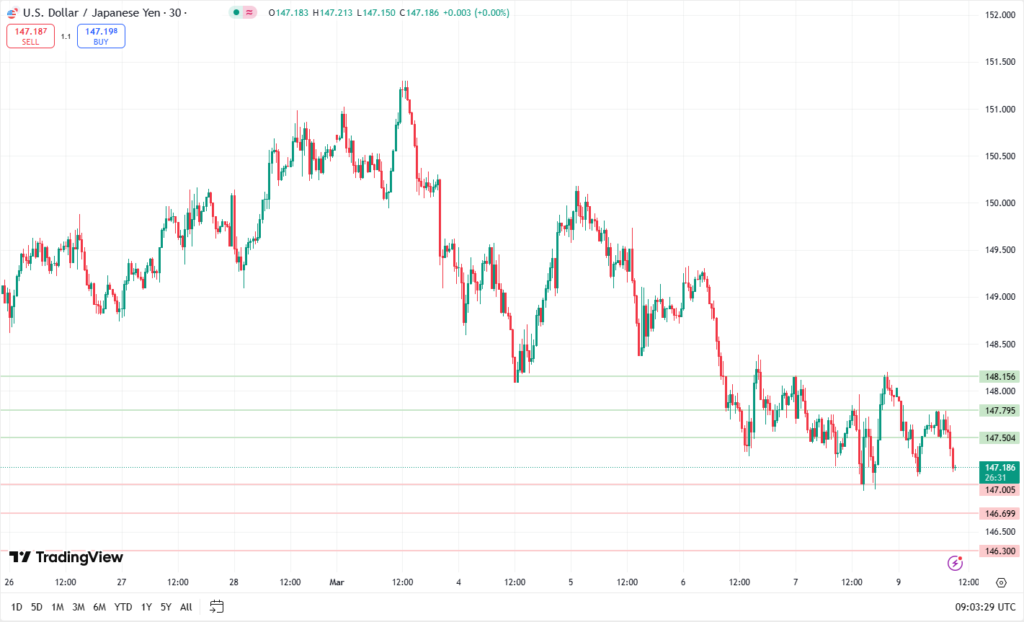
Japanese yen bulls retain control amid bets for more BoJ rate hikes
The Japanese yen continues to draw support from bets for more BoJ rate hikes.
The narrowing US-Japan rate differential further benefits the lower-yielding JPY.
Expectations that the Fed will resume its rate-cutting cycle undermine the USD.
The Japanese yen remains on the front foot against the USD amid divergent BoJ-Fed expectations.
MARKET MOVERS
USD/JPY
Potential short preference Short positions below 147.005 with targets at 146.699 & 146.300 in extension. Alternative scenario Above 147.504 look for further upside with 147.795 & 148.156 as targets. The RSI is bearish and calls for further decline.
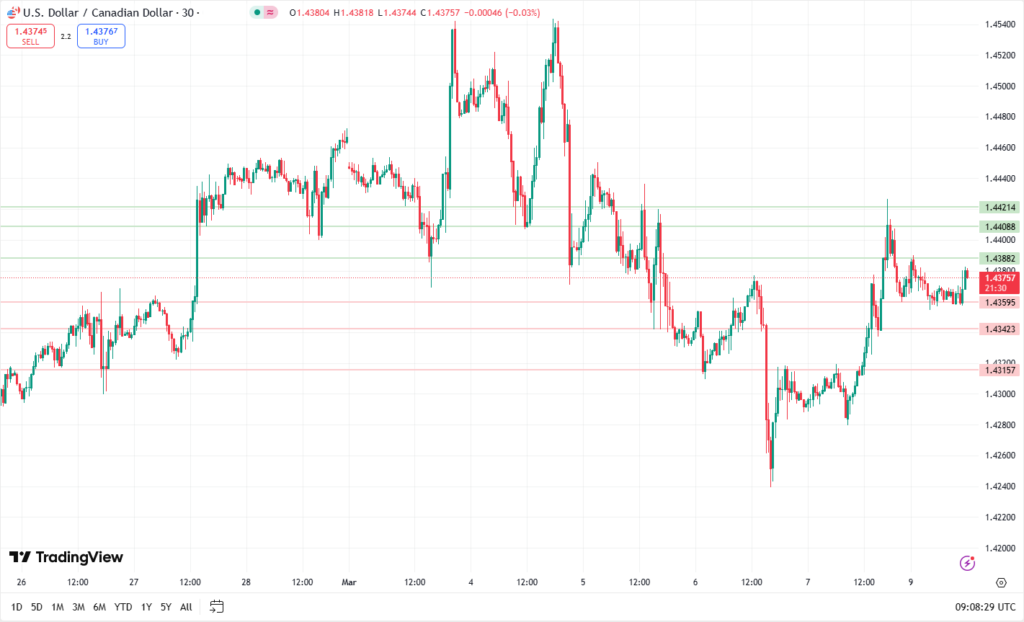
USD/CAD
Potential short preference Short positions below 1.43595 with targets at 1.43423 & 1.43157 in extension. Alternative scenario Above 1.43882 look for further upside with 1.44088 & 1.44214 as targets. The RSI is mixed with a bearish bias.
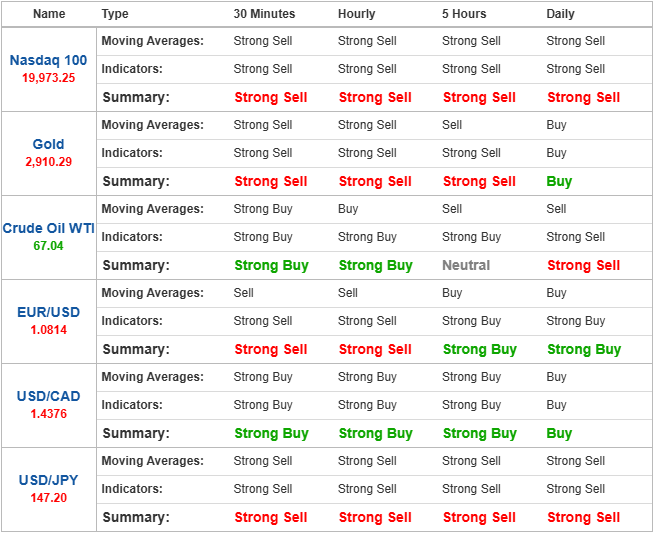
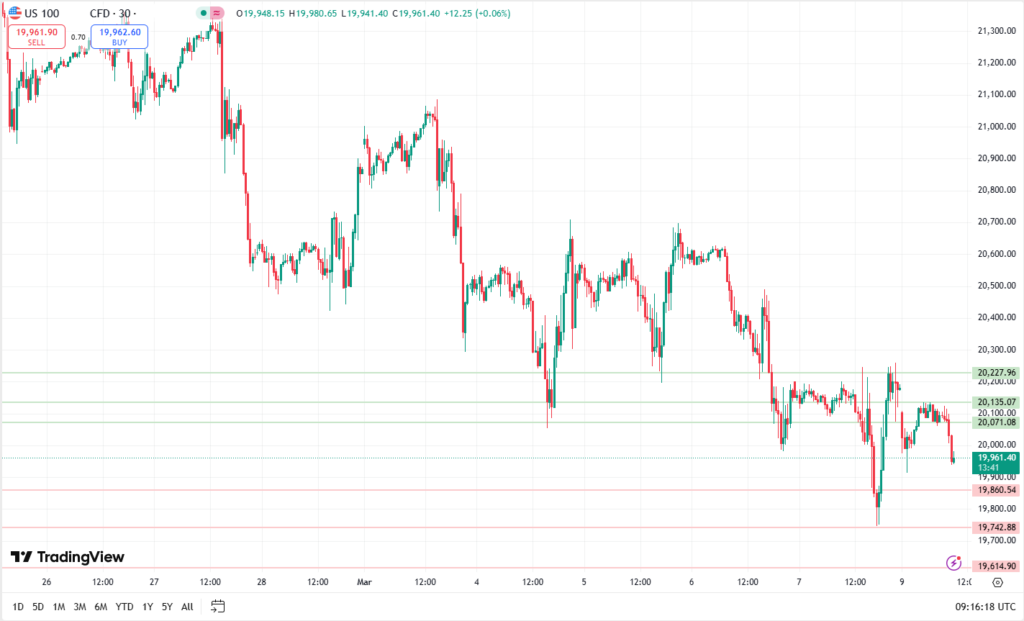
Technical indicators
Nasdaq 100
The short preference Short positions below 19860.54 with targets at 19742.88 & 19614.90 in extension. Alternative scenario Above 20071.08 look for further upside with 20135.07 & 20227.96 as targets. The RSI is mixed to bearish.
NEWS HEADLINES
European markets reverse course to trade lower as volatility persists
European markets were trading lower on Monday, erasing gains seen earlier in the session to continue the volatility seen in global markets last week.
The pan-European Stoxx 600 was 0.3% lower at 9:26 a.m. London time, with all major bourses in negative territory.
Germany’s Dax was 0.5% lower, after edging higher during early morning deals.
China bond yields jump to three-month highs as investors pare rate cut expectations
China’s sovereign bond yields hit their highest levels this year, as investors trimmed holdings on bets that additional fiscal spending will boost growth and push back interest rate cuts.
Yields on China’s 10-year government bond, which moves inversely to prices, gained over 10 basis points on Monday to hit 1.865%, their highest level this year.
The sell-off in bonds followed a rally in the Chinese offshore stock market, signalling a shift of liquidity toward riskier assets.
Yields on 30-year sovereign bonds climbed above the key psychological level of 2% to reach 2.030% on Monday, while yields on the one-year note also gained 10 basis points to hit 1.643%. By 1 p.m. in Beijing, yields had pared some gains.
Stock futures fall on Monday morning after S&P 500’s worst week since September
Stock futures moved lower on Monday morning ahead of a packed week of economic data, with investors smarting from losses in early March.
Futures for the S&P 500 fell 0.42%.
Nasdaq 100 futures dropped 0.53%.
Futures tied to the Dow Jones Industrial Average slipped 144 points, or 0.34%.
Last week, the S&P 500 fell 3.10% for its worst weekly mark since September.
The Dow fell 2.37%.
The Nasdaq Composite shed 3.45%.
On the inflation front, the February consumer price index release is slated for Wednesday, followed by the producer price index on Thursday.
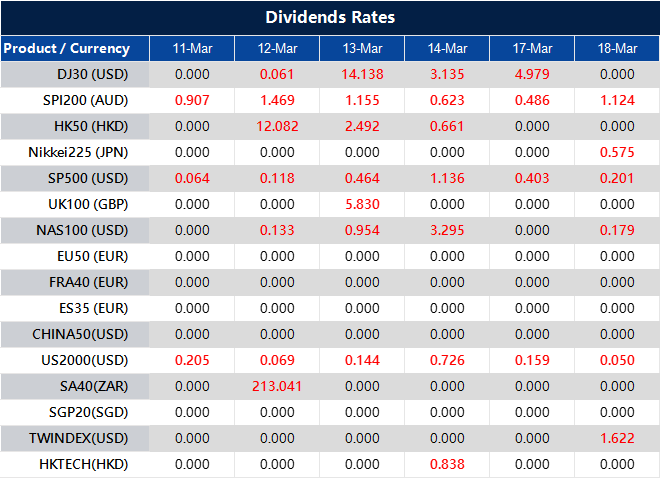
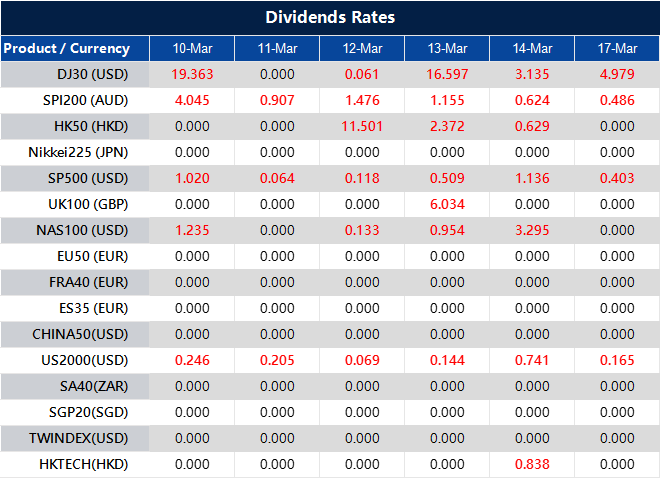
Please note that the dividends of the following products will be adjusted accordingly. Index dividends will be executed separately through a balance statement directly to your trading account, and the comment will be in the following format “Div & Product Name & Net Volume ”.
Please refer to the table below for more details:
The above data is for reference only, please refer to the MT4/MT5 software for specific data.
If you’d like more information, please don’t hesitate to contact info@vtmarkets.com.
Join us for an insightful webinar on Monday, 31 March, 18:00 pm (GMT-6)!
The Rankia Markets Experience unites financial experts, investors, traders, and enthusiasts for high-value educational conferences. It offers up-to-date knowledge on financial markets, technical analysis, investment strategies, financial products, and finance technologies. Suitable for both experienced investors and beginners, the event promotes financial education with practical tools and strategies, providing a unique opportunity to learn from top experts and network with peers.
In the upcoming webinar titled “Bitcoin and CFDs: How to Operate Crypto in Traditional Markets” presented by Eduardo Ramos Romero, the Financial Market Analyst for VT Markets LATAM. You will discover:
• Understanding the role of Bitcoin and CFDs in traditional financial markets.
• Exploring strategies for trading crypto assets within a regulated framework.
• Managing risks and opportunities when integrating crypto with traditional investments.
Speaker Background: Eduardo Ramos Romero
• Financial Market Analyst for the LATAM region.
• 7 years of experience in the financial market.
• Held significant roles as the Director of Market Analysis and Senior Market Strategist at two prominent CFD brands.
• A respected speaker and educator, sharing his expertise through courses and media outlets such as El Economista, El Financiero, Bloomberg Middle East, Forbes Colombia, and Expansión.
Join us for an insightful webinar on Thursday, 27 March, 17:00 (GMT-6)!
The Rankia Markets Experience unites financial experts, investors, traders, and enthusiasts for high-value educational conferences. It offers up-to-date knowledge on financial markets, technical analysis, investment strategies, financial products, and finance technologies. Suitable for both experienced investors and beginners, the event promotes financial education with practical tools and strategies, providing a unique opportunity to learn from top experts and network with peers.
In the upcoming webinar titled “Control Your Capital, Control Your Success: Money Management for Traders” presented by Jonathan Vargas, the Team Leader for BDM in VT Markets LATAM. You will discover:
• Proven strategies to manage your capital effectively and minimize risks in trading.
• Techniques to optimize your profits and ensure sustainable growth.
• How to build financial discipline to stay consistent and successful in your trading journey.
Speaker Background: Jonathan Vargas
• Seasoned trading and finance professional with over five years of industry experience.
• Key contributor to the expansion of major financial firms.
• Development Manager for Latin America at VT Markets, driving regional growth.
• Expert in market strategy, identifying opportunities, and strengthening brand presence.
Gold remains a key player in uncertain times, holding steady as traders weigh their next moves. Balancing recent gains with economic uncertainty, investors are closely watching shifting trade policies, Federal Reserve decisions, and key economic reports. As markets stay cautious, gold continues to be a go-to safe-haven asset, reflecting broader trends in risk and currency movements.
Gold prices remain steady as traders secure profits
Gold prices held their ground on Friday, hovering around USD 2,914 per ounce, as investors took profits following the week’s upward momentum.
The precious metal remains on course for a 1.6% weekly gain, driven by ongoing trade uncertainty and anticipation of key US economic data.
An eye-popping imports surge that has driven the US trade deficit to a record and elevated anxiety about the economy largely has its roots in a frantic scramble by international gold traders to rush bullion to New York depositories. https://t.co/1LZ6yjFEpv
The session concluded with gold at USD 2,913.87, marking a 0.2% decline from previous levels, while US gold futures dropped 0.5% to USD 2,911.90.
Earlier in the day, bullion touched a peak of USD 2,914.82 before briefly retreating to USD 2,896.84 as traders adjusted positions ahead of the upcoming US non-farm payrolls report.
Meanwhile, US President Donald Trump announced the suspension of the newly imposed 25% tariffs on Canada and Mexico. However, uncertainty surrounding trade policies continues to provide support for gold, as market participants assess potential economic consequences.
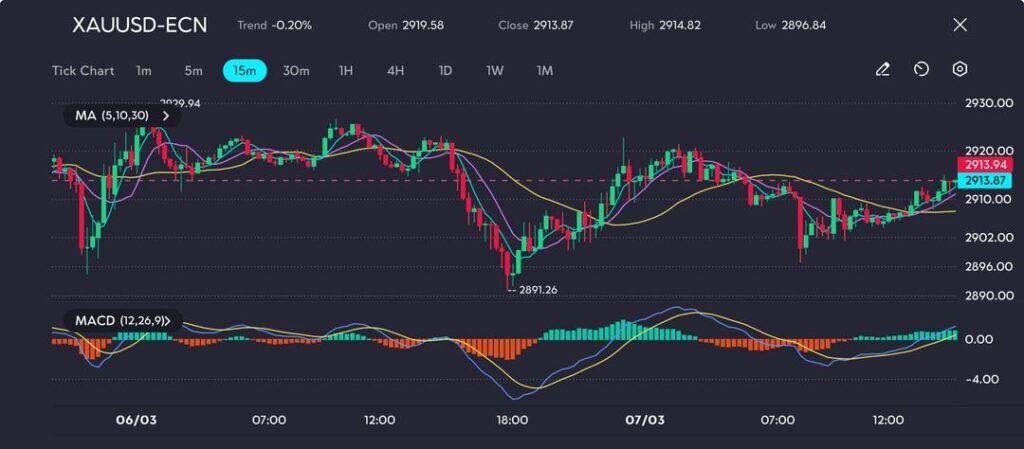
Technical analysis
Gold (XAU/USD) is trading at USD 2,913.87, down 0.20% for the session.
The price briefly dipped to USD 2,896.84, where buyers stepped in to offer support, before climbing to a session high of USD 2,914.82 and pulling back.
Gold steadies near USD 2,914 as buyers test key resistance, as seen on the VT Markets app.
Moving averages (5, 10, 30) suggest mixed signals, with price action stabilising near resistance levels.
Additionally, the MACD indicates a possible bullish crossover, hinting at a shift in momentum towards buyers if gold surpasses USD 2,920.
A breakout above USD 2,920 could lead to a test of the USD 2,930 – USD 2,940 range, where selling pressure may emerge.
On the downside, key support is seen at USD 2,891, with a breach of this level potentially pushing prices towards USD 2,880.
Traders should remain attentive to US economic indicators, Federal Reserve policy signals, and overall market sentiment, as these elements will heavily influence gold’s next move.
Furthermore, the US dollar index remains under pressure, which has provided additional support for gold prices.
Persistent currency market volatility suggests investors remain cautious about the global economic outlook.
Federal Reserve outlook and jobs data in focus
Federal Reserve Governor Christopher Waller has indicated that while he does not support an interest rate cut in the March meeting, easing later in the year remains a possibility if inflation continues to trend lower.
Market participants are now awaiting the US non-farm payrolls report, which is projected to show a 160,000 job increase for February.
Should the data fall short of expectations, it may reinforce the case for Federal Reserve rate cuts in the coming months, potentially boosting gold prices further.


 | VT Markets")

 | VT Markets")

 | VT Markets")


 | VT Markets")