The crypto market has hit a turbulent patch, with Bitcoin leading a broad selloff that has shaken investor sentiment. While volatility and liquidations weigh on the short term, many see this correction as a natural pause before the next major move.
Market shake-up as crypto liquidations mount
Bitcoin’s sharp drop this week triggered widespread volatility across the cryptocurrency market, as a cascade of liquidations erased leveraged long positions.
In just 24 hours, around $205 billion in market value disappeared, dragging total market capitalisation back to $3.84 trillion – its lowest point since 6 August.
Bitcoin sank to its lowest level in nearly seven weeks as the token retreats further from a record high set in mid-August https://t.co/ANNf2WZoB8
CoinGlass data reveals that more than 205,000 traders were liquidated, with total losses exceeding $930 million.
The downturn was accelerated by a whale offloading 24,000 BTC – worth approximately $2.7 billion – which caused Bitcoin to nosedive by nearly $4,000 in a matter of hours.
The selloff also pushed BTC beneath the $110,800 cost basis for one-to-three-month holders, a historically important level for preserving bullish sentiment.
Even so, Bitcoin’s 12% decline remains milder than corrections from previous bull cycles: September 2017 endured a 36% drawdown, while September 2021 saw a 24% retreat.
Should a similar pattern unfold this September, Bitcoin could revisit levels near $87,000 before momentum returns.
Altcoins absorbed even heavier selling pressure: Solana fell 11% to $186, Dogecoin slipped 10% to $0.21, Cardano dropped 9% to $0.83, and Chainlink declined 11% to $23.30.
Ethereum also weakened, losing 7% on the day to trade above $4,400 – down more than 11% since recording a new all-time high earlier in the week.
Technical analysis
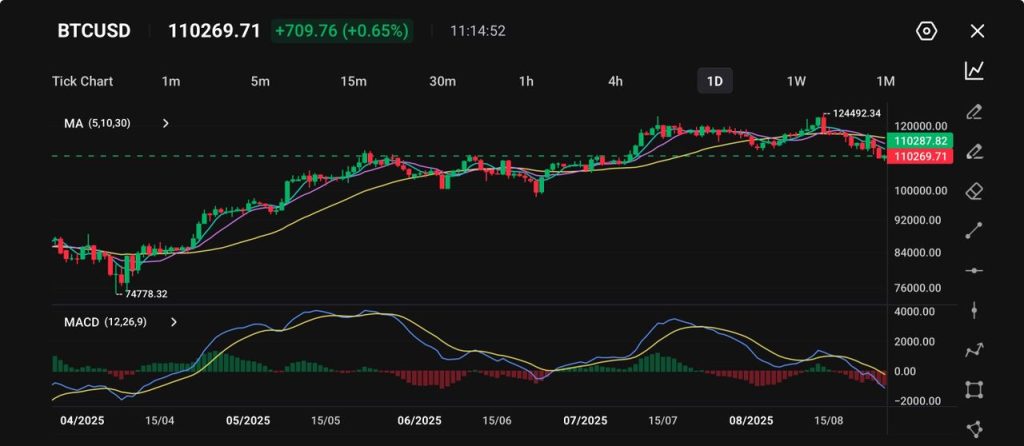
Bitcoin (BTC/USD) has delivered an impressive rally in 2025, climbing from April’s low near $74,778 to its August peak at $124,492.
Since that high, however, BTC has corrected back to around $110,269, now trading below its shorter-term moving averages. This shift signals a cooling phase following months of strong gains.
The MACD indicator has flipped into negative territory, showing that bearish momentum is building as sellers exert short-term control.
Picture: Bitcoin trades near $110,270, easing after a recent peak around $124,492, with support forming near $110,000 and a bearish MACD signal, as shown on the VT Markets app.
Key support is positioned between $108,000 and $110,000, with a stronger safety net closer to $100,000 if the decline deepens.
On the upside, resistance is capped at $115,000 and then the August top around $124,500.
Should Bitcoin stabilise above $110,000, buyers may regain the confidence to test higher levels. A decisive break below this zone, however, would confirm a deeper corrective move.
Despite this pullback, the long-term outlook for Bitcoin remains bullish, although the near-term picture points to consolidation or another test of lower levels before the uptrend resumes.
Cautious forecast
If Bitcoin struggles to reclaim the $110,800 cost-basis level, the risk of a broader retracement increases.
In that case, a move towards $100,000–$95,000 becomes more likely, with these zones acting as the next critical support areas to watch.
Such a scenario could also pressure sentiment across altcoins, prolonging the current phase of market weakness.
On the flip side, if dip buyers step in – as they have in previous bull cycles – Bitcoin could rebound quickly, regaining lost ground towards $115,000–$120,000.
A return above this zone would likely reignite bullish confidence and set the stage for a retest of August’s highs near $124,500.
Much will depend on whether whale-driven selling continues or eases. If supply pressure fades, the market could enter a period of stabilisation, allowing fundamentals such as institutional inflows, ETF demand, and macroeconomic conditions to guide the next major move.
While volatility remains high, Bitcoin’s broader uptrend is still intact, suggesting that this correction may ultimately provide a reset before the next leg higher.
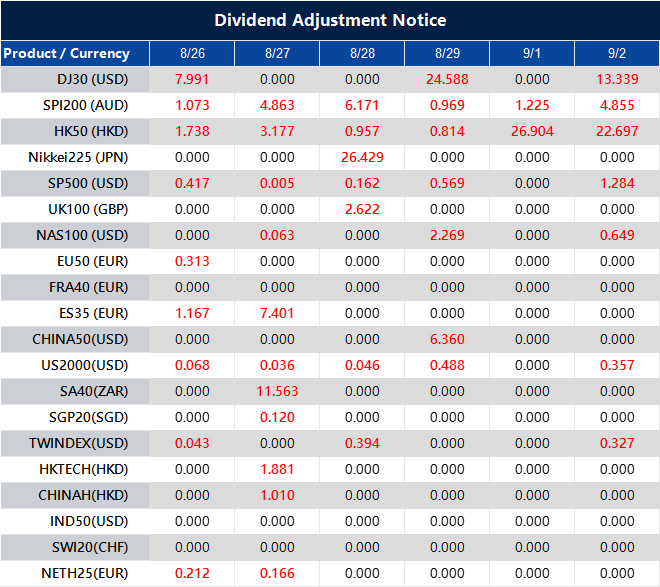
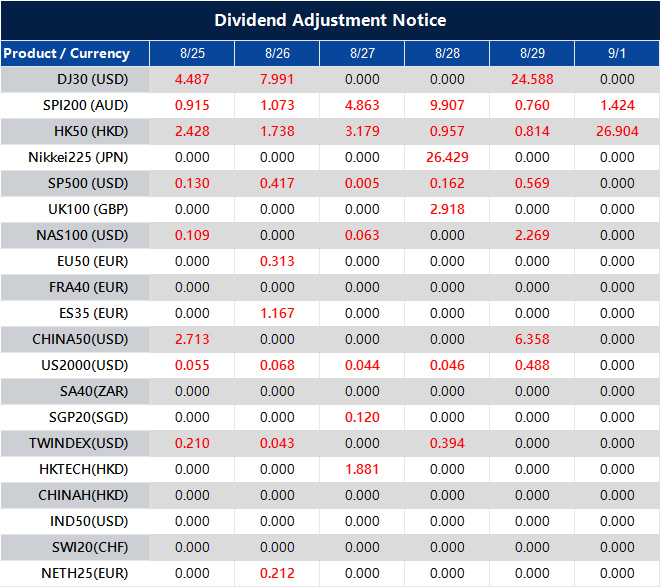
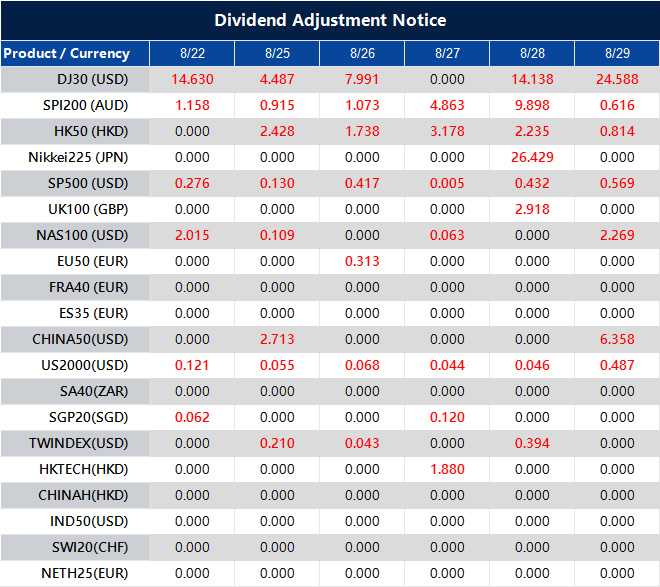
Please note that the dividends of the following products will be adjusted accordingly. Index dividends will be executed separately through a balance statement directly to your trading account, and the comment will be in the following format “Div & Product Name & Net Volume”.
Please refer to the table below for more details:
The above data is for reference only, please refer to the MT4/MT5 software for specific data.
If you’d like more information, please don’t hesitate to contact info@vtmarkets.com.
Markets opened cautiously optimistic today after Fed Chair Powell signalled potential rate cuts as early as September. Traders are watching Germany’s Ifo survey and US manufacturing data, while tech sentiment hinges on Nvidia’s upcoming earnings, seen as a key test for AI-driven momentum.
KEY INDICATORS
US Federal Reserve policy outlook
Fed Chair Jerome Powell’s dovish remarks have increased expectations of a September rate cut.
Investors are rotating into cyclical sectors in anticipation of looser monetary policy.
The shift is affecting currency markets, equities, and investor sentiment more broadly.
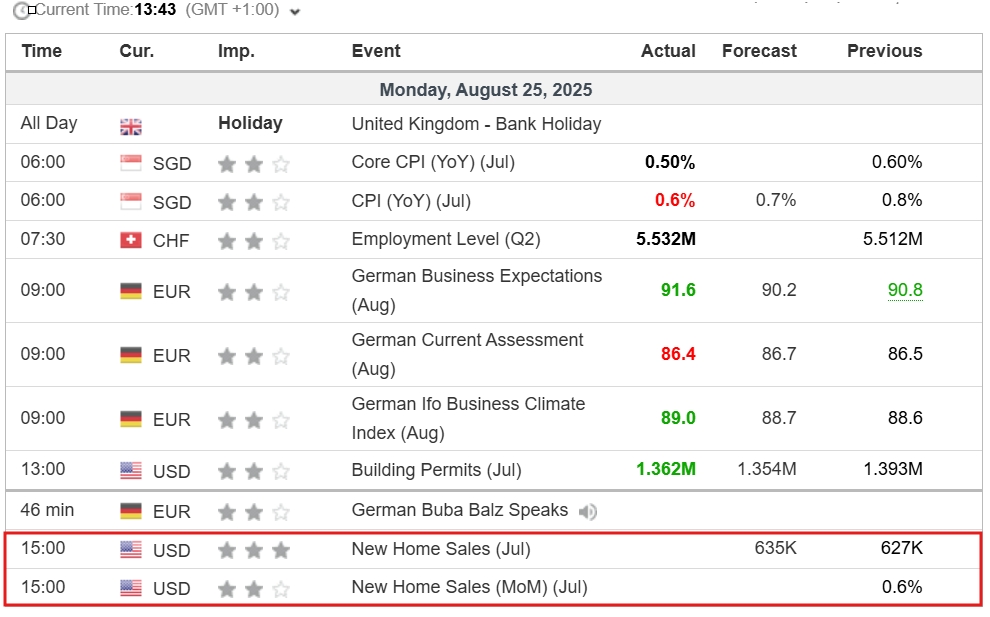
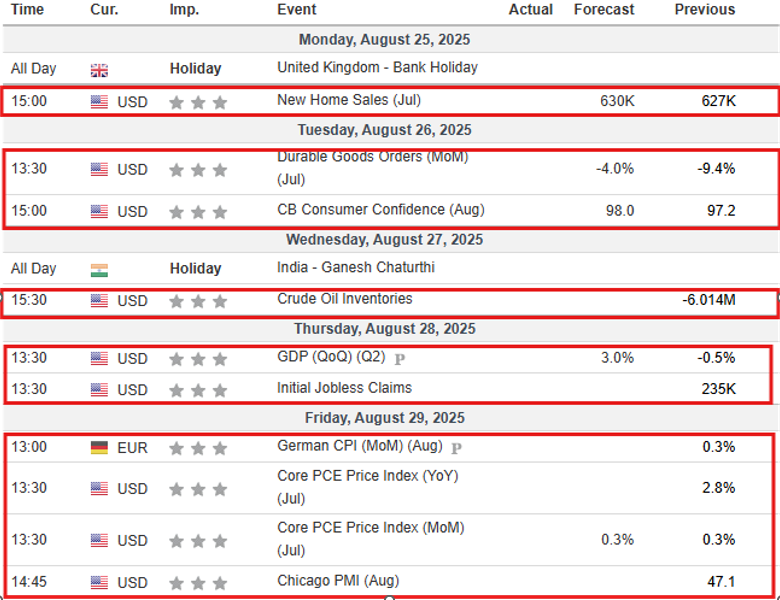
US economic data releases
New Home Sales (July): An indicator of housing market health.
Dallas Fed Manufacturing Survey: A snapshot of regional manufacturing activity.
Chicago Fed National Activity Index: Measures overall economic performance and inflation pressures.
Nvidia earnings report
Nvidia reports quarterly results this Wednesday, a major market event.
Its AI-driven business performance could influence technology stocks and sector sentiment.
The earnings release may shape broader market expectations amid ongoing Fed policy developments.
MARKET MOVERS
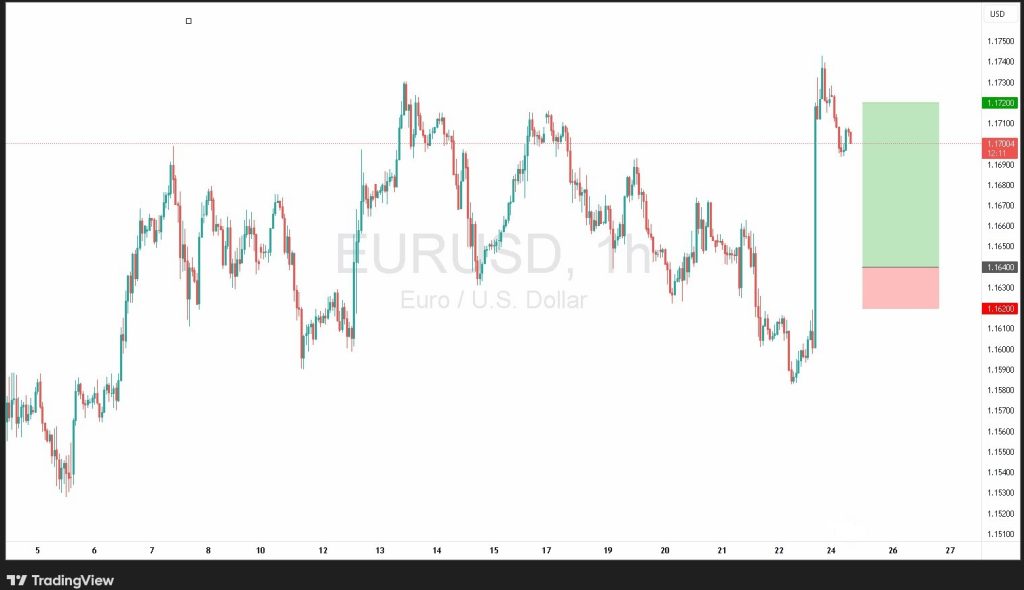
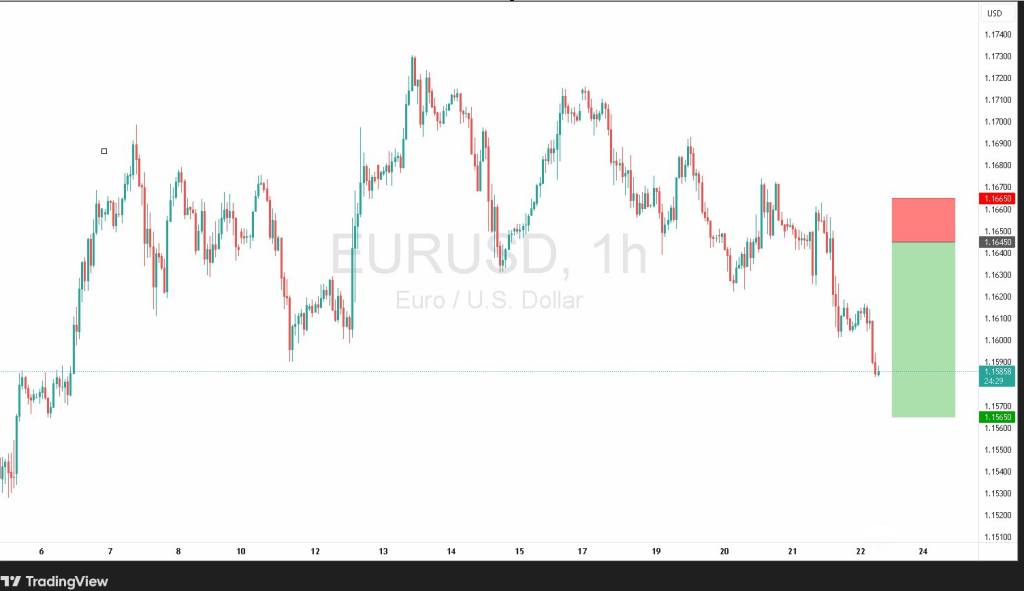
EUR/USD
Primary trend: Bullish, but a short-term pullback is likely
Support level: 1.1640
Resistance zone: 1.1750–1.1780
Long strategy: Enter on dips towards 1.1640, target 1.1750–1.1780
Short strategy: Sell if price breaks below 1.1640, target 1.1580–1.1600
Range trade: Buy near 1.1640 and sell near 1.1750 if price oscillates in this band
Risk management: Use tight stops when trading within the range
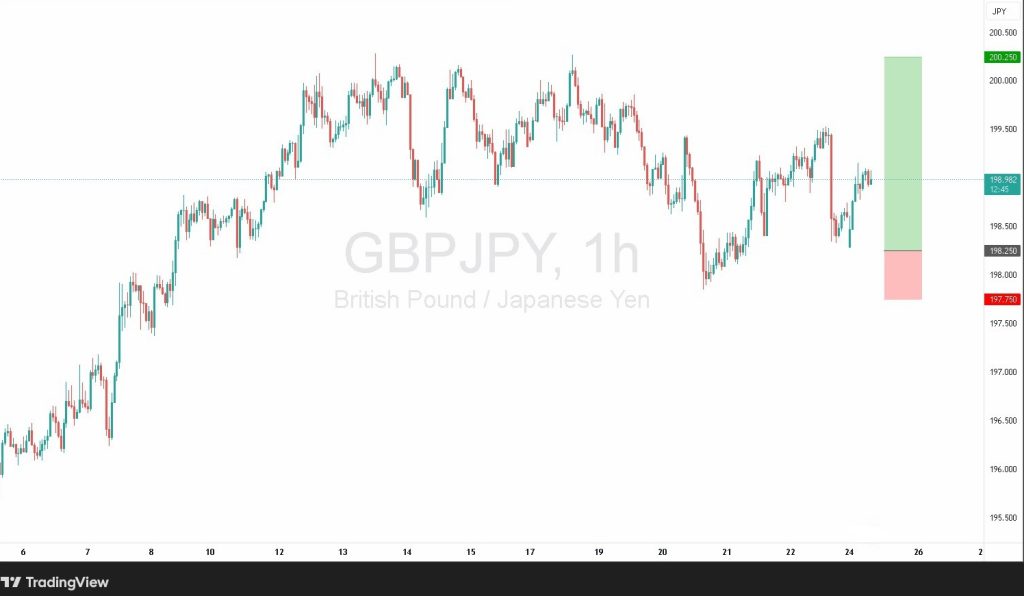
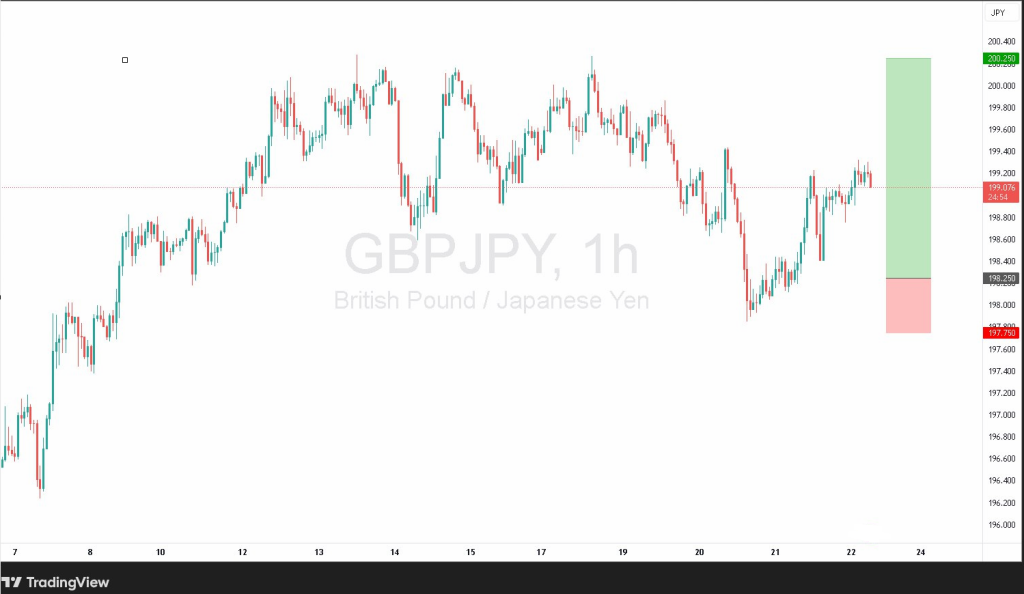
GBP/JPY
Primary trend: Bullish, with recent sell-offs showing signs of exhaustion on the daily chart
Support level: 198.25
Resistance zone: 200.50–201.00
Long strategy: Buy on dips near 198.25, target 200.50–201.00
Short strategy: Sell if price breaks below 198.25 with momentum, target 196.50–197.00
Range trade: Buy near 198.25 and sell near 200.50 if price oscillates in this band
Risk management: Keep tight stops within the range to minimise risk
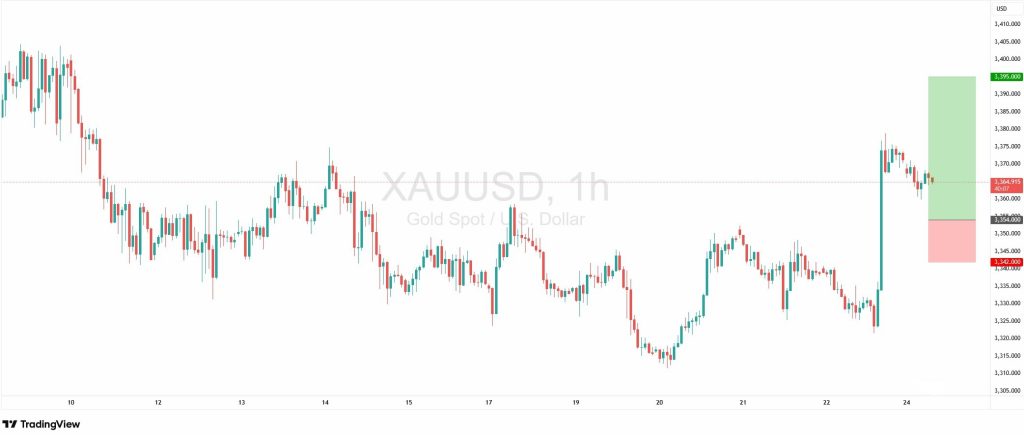
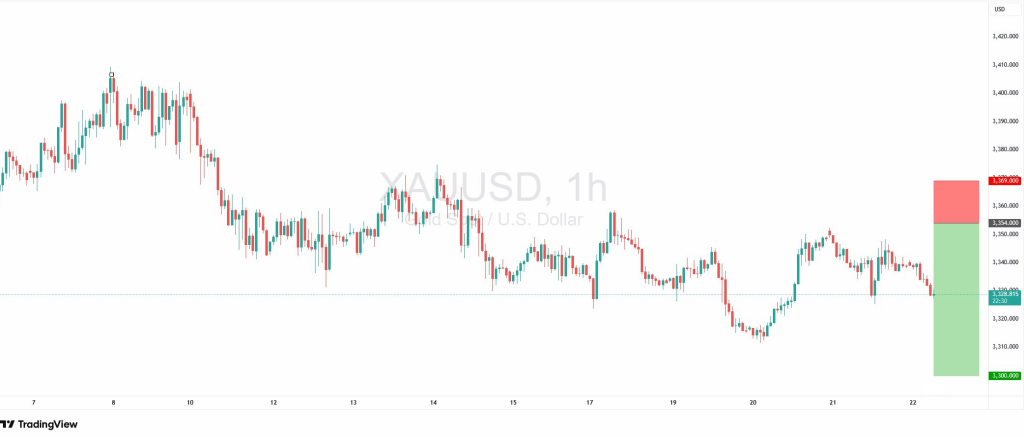
XAU/USD
Primary trend: Bullish, but recent sessions have shown mixed and volatile price-action
Support level: 3322
Resistance zone: 3395–3426
Long strategy: Buy on dips near 3354, target 3395 | 3426
Short strategy: Sell if price breaks below 3342 with momentum, target 3322–3330
Range trade: Buy near 3354 and sell near 3395 if price oscillates in this band
Risk management: Keep tight stops to manage risk within the range
NEWS HEADLINES
Wall Street hits records on Powell’s dovish hint
The Dow jumped 846 points (+1.89%) to a record 45,631, while the S&P 500 rose 1.52% and Nasdaq 100 gained 1.54%.
Tech stocks led the advance, with Tesla up 6.2%, Alphabet +3.2%, Meta +2.1%, Apple +1.3%, and Nvidia +1.7% ahead of Wednesday’s earnings.
Asian session sees euro softening and gold pullback
EUR/USD eased to 1.1698, and GBP/USD dipped to 1.3494.
USD/JPY rebounded to 147.47.
Gold retreated to $3,362 amid mixed trading.
Market focus: Key data releases and events
UK: Stock market closed for the Late Summer Bank Holiday.
Germany: Ifo business climate index expected to slip to 87.0 in August.
US: New home sales projected to fall 1.1% in July; Dallas Fed manufacturing index forecast at 0.2 for August.
Markets face potential volatility this week as investors look to Fed Chair Powell’s Jackson Hole speech for policy clues. Nvidia’s earnings on 27 August will influence tech sentiment, particularly regarding AI demand amid geopolitical tensions. Defence stocks remain sensitive to developments in Ukraine, while Japan’s political uncertainty – PM Ishiba resisting resignation after election losses – adds pressure to bond markets, pushing yields higher.
KEY INDICATORS
Forex moves
Dollar strengthens as US manufacturing data lifts the DXY to 98.65 and Powell’s hawkish tone cuts chances of a September rate cut to around 25%.
Pound falls to a 10-week low near $1.3316 after the US–EU trade pact announcement.
Powell’s Jackson Hole speech remains in focus for signals on US interest rate policy.
The US–EU trade pact introduces a 15% tariff on European exports while including $600 billion in investment pledges.
Commodities and equities
Oil climbs 1.29% to $63.52 per barrel on supply concerns linked to geopolitical tensions.
Gold slips $9 to $3,338 per ounce as higher US Treasury yields and a stronger dollar reduce safe-haven demand.
US equities fall, with the S&P 500 down 0.40% to 6,370, while European indices show mixed results amid policy and earnings uncertainty.
Asian markets
China’s Shanghai Composite reaches a 10-year high of 3,728.03, supported by policy expectations and easing trade frictions.
Japan’s PM Ishiba faces mounting calls to resign after election losses, adding pressure to bond markets and driving yields towards multi-year highs.
Political uncertainty around Ishiba’s leadership continues to weigh on market sentiment, particularly in fixed income.
Technical breakout: Medium-term bias remains bearish. Price action is forming a potential top, suggesting a temporary upward retracement. Bespoke resistance is identified at 1.1645.
Target projection (bullish): Expect a retracement move to test resistance at 1.1645.
Opening expectation: Price likely opens slightly higher, offering opportunities to sell into rallies.
Primary support zone: 1.1565–1.155.
Strategy (bearish approach – primary outlook): Enter on rejection from resistance, aiming for 1.1565–1.155.
Strategy (bullish approach – countertrend): Short-term rallies toward 1.1645 may allow for selling opportunities.
Range trade: Monitor minor swings between 1.1600 and 1.1645 for intraday scalps.
Key catalysts next week: Fed Chair Powell’s Jackson Hole speech (US rate guidance), US GDP revision, inflation numbers, Eurozone sentiment reports, Ukraine security talks, and global trade developments.
Market context: EUR/USD remains under pressure, with short-term retracements possible. Traders should monitor resistance at 1.1645 and key support at 1.1565–1.155, as upcoming macro and geopolitical events may trigger volatility.
GBP/JPY
Technical breakout: Primary trend remains bullish despite the recent pullback. Daily chart shows exhaustion in the sell-off, suggesting limited downside. Bespoke support is identified at 198.25.
Target projection (bearish): Setbacks likely limited to yesterday’s low at 198.25, with broader downside risk minimal given the bullish trend.
Opening expectation: Price expected to dip slightly, providing opportunities to buy on retracements toward support levels.
Primary support zone: 198.25–197.75 (short-term pivot and intraday channel base).
Secondary support zone: 197.50–197.75 (minor corrective area for tactical entries).
Strategy (bullish approach): Buy on dips toward support levels with targets at 200.25–200.5.
Strategy (bearish approach – countertrend): Minor pullbacks may offer short-term scalps, but the overall trend remains bullish.
Range trade: Monitor intraday swings around 198.5–200 for tactical entries.
Stop-loss levels: Below 197.70 for bullish positions; above 200.60 for countertrend short setups.
Key catalysts next week: UK economic data (PMI, retail sales), JPY reactions to Japanese inflation and BoJ commentary, and global risk sentiment including US macro data and geopolitical developments.
Market context: GBP/JPY remains in a bullish medium-term trend, but short-term retracements are likely. Traders should manage risk carefully as upcoming macro and geopolitical events may trigger volatility and intraday reversals.
XAU/USD
Technical breakout: Recent price action shows mixed daily results over the past three days. Selling pressure observed during the Asian session suggests cautious sentiment. Bespoke resistance is identified at 3354.
Target projection (bullish): Price may test resistance at 3354, offering tactical buying opportunities on retracements.
Target projection (bearish): Setbacks likely limited to yesterday’s low at 3300–3293, with broader downside risk minimal given the overall trend.
Opening expectation: Trading is expected to remain mixed and volatile, with short-term swings providing tactical opportunities.
Primary support zone: 3300–3293 (short-term pivot and intraday channel base).
Secondary support zone: 3295–3293 (minor corrective area for tactical entries).
Strategy (bullish approach): Buy on dips toward support levels, targeting 3354.
Strategy (bearish approach – countertrend): Minor pullbacks or rallies toward resistance at 3354 may offer short-term selling opportunities, but the broader trend remains bullish.
Range trade: Monitor intraday swings between 3325 and 3354 for tactical entries.
Stop-loss levels: Below 3290 for bullish positions; above 3356 for countertrend short setups.
Key catalysts this week: US economic data (GDP revision, inflation), Powell’s Jackson Hole speech, and geopolitical tensions (Ukraine, Middle East) influencing gold volatility.
Market context: Gold remains under mixed pressure, with short-term swings expected. Traders should monitor resistance at 3354 and support at 3300–3293, as upcoming macro and geopolitical events may trigger volatility and intraday reversals.
NEWS HEADLINES
Global policy and market sentiment
Powell’s Jackson Hole speech is under scrutiny as Trump pressures for rate cuts and threatens Powell’s removal, raising risks to Fed independence.
Concerns over US fiscal dominance are pushing investors towards emerging markets with stronger fundamentals and valuations.
At an 18 August White House summit, European leaders and Zelenskyy discussed new security guarantees for Ukraine, heightening defence-sector focus.
The US–EU trade pact sets 15% tariffs on EU exports to the US and includes energy and investment pledges, boosting corporate sentiment.
US inflows into UK equities are reaching record levels, supported by stability and attractive valuations, though weak employment and high borrowing costs temper optimism.
Foreign exchange movements
The US dollar strengthened ahead of Powell’s Jackson Hole speech, with the DXY at 98.65.
EUR/USD fell to 1.1605 despite German manufacturing edging up to 49.9.
GBP/USD slipped to 1.3411.
USD/JPY jumped to 148.34, while USD/CHF reached 0.8085.
AUD/USD eased to 0.6419, and USD/CAD rose to 1.3907 after stronger Canadian PPI (+2.6% YoY vs 1.9% expected).
USD/JPY ticked up further to 148.53 after Japan’s inflation eased to 3.1% (vs 3.3% expected).
EUR/USD remained steady at 1.1610; GBP/USD at 1.3415.
Commodities and stock markets
Meta fell 1.15% (fourth straight loss) and Walmart sank 4.49% on weak earnings.
First Solar dropped 6.99% and SolarEdge 5.77% after Trump’s criticism.
Coty plunged 21.6% following a surprise loss and weak sales outlook.
US 10-year yield rebounded to 4.328% as jobless claims rose to 235k (vs 225k expected) and July home sales grew 2% (vs -0.2% expected).
FTSE 100 rose 0.23% to a new record, DAX gained 0.07%, and CAC slipped 0.44%.
WTI crude gained 1.29% to $63.52 per barrel on geopolitical tensions.
Gold fell $9 to $3,338/oz ahead of Powell’s Jackson Hole speech and key economic events.
Canada retail sales are expected to contract by -0.4% MoM in July.
Please note that the dividends of the following products will be adjusted accordingly. Index dividends will be executed separately through a balance statement directly to your trading account, and the comment will be in the following format “Div & Product Name & Net Volume”.
Please refer to the table below for more details:
The above data is for reference only, please refer to the MT4/MT5 software for specific data.
If you’d like more information, please don’t hesitate to contact info@vtmarkets.com.
Crude oil remains at the centre of global market attention as shifting geopolitics and uncertain peace talks continue to shape investor sentiment. With supply risks, sanctions, and policy decisions all in play, traders are watching closely to see whether oil can stabilise or if fresh volatility lies ahead.
Cease-fire uncertainty underpins crude oil prices
Crude oil prices strengthened on Friday as hopes for a quick resolution to the Russia–Ukraine conflict began to fade. Brent crude rose to $67.85 per barrel, while WTI crude climbed to $63.74, leaving both benchmarks on track to end the week in positive territory.
Our research desk notes that optimism around peace talks has cooled, with efforts to arrange a summit between Presidents Putin and Zelensky facing continued obstacles.
European natural gas prices are headed for the first weekly gain in three as the initial optimism over US President Donald Trump’s efforts to end Russia’s war in Ukraine wanes https://t.co/SBm0k47xgp
Disagreements over Ukraine’s future security guarantees remain a sticking point, with Moscow pushing for influence over any defence framework. The stalling negotiations have revived concerns about tougher sanctions on Russia, which could tighten supply conditions and provide further support to oil prices.
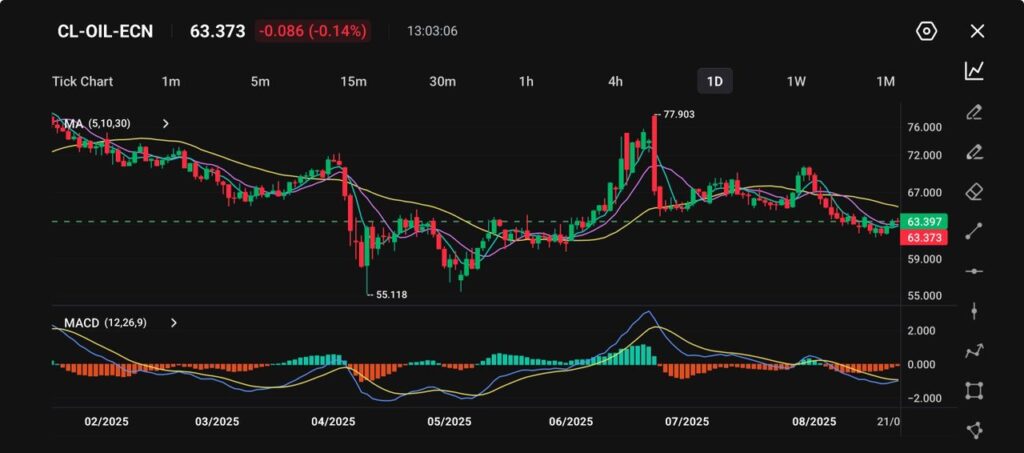
Technical analysis
The crude oil market has displayed wide swings throughout 2025, ranging from April’s trough at $55.11 to July’s rally peak near $77.90. After a strong mid-year surge, momentum has cooled, and prices are now attempting to stabilise around the $63 level.
Short- and medium-term moving averages (5, 10, 30) still reflect a bearish structure after recent declines. However, the flattening of shorter-term averages suggests that downward momentum may be losing strength.
Picture: Crude oil trades near $63.37, stabilising after recent declines with support emerging above $60 and a flattening MACD signal, as shown on the VT Markets app.
The MACD, which remains below the zero line, continues to show weak momentum but offers early signs of a base forming as the histogram narrows.
In the near term, resistance is expected around $66–67, aligned with recent swing highs and clustered moving averages. A breakout above this level could trigger a retest of $70 or higher.
On the downside, immediate support stands at $60, with stronger protection near April’s low of $55. As long as prices hold above $60, crude may be carving out a consolidation zone. A break below, however, would increase the risk of a deeper retracement.
Overall, crude oil remains in a watchful consolidation phase, with traders closely tracking US inventory reports, OPEC decisions, and demand trends in key economies for the next major directional cue.
Cautious forecast
Looking ahead, crude oil prices are likely to remain highly sensitive to geopolitical developments. If Russia–Ukraine talks continue to falter, WTI crude could retest the $67.00–$70.00 zone, with supply concerns keeping an upward bias intact.
That said, a breakthrough in negotiations would likely deflate the current risk premium, potentially dragging prices back toward the $60.00 support area. Traders should also be mindful of secondary drivers such as Chinese demand recovery, seasonal refinery activity, and currency fluctuations, all of which could amplify volatility.
While the broader trend remains cautious, the market’s underlying risk profile leans to the upside in the near term. Any escalation in geopolitical tensions or disruption to supply chains would likely act as a strong catalyst for higher oil prices, reinforcing the need for close monitoring of global events.
When comparing ways to trade financial markets without owning the underlying asset, many traders look at spread betting vs CFD trading. Both allow you to speculate on rising and falling prices across forex, indices, commodities, and shares, but they differ in taxation, accessibility, and trading style. This guide breaks down the main differences and similarities, supported by real-life examples, so you can decide whether CFD trading or spread betting is the right choice for your strategy.
What is CFD Trading?
A Contract for Difference (CFD) is an agreement between a trader and a broker to exchange the difference in an asset’s price from the time the trade is opened until it is closed. This means you can profit from both rising and falling markets without owning the asset, while using leverage to control a larger position with a smaller deposit.
How it works
Profit calculation: Difference between entry and exit price, multiplied by the number of contracts.
Leverage: You only need a margin deposit, which magnifies gains and losses.
Example: A trader buys 10 contracts of gold (XAUUSD) at $3,300 and sells at $3,320. The $20 move multiplied by 10 contracts equals a $200 profit. If gold had dropped to $3,280 instead, the same trader would have lost $200.
What is Spread Betting?
Spread betting is another derivative product, most popular in the UK and Ireland. Instead of buying contracts, you stake a certain amount per point of price movement, which means your profit or loss depends directly on how many points the market moves in your chosen direction, magnified by the leverage applied.
How it works
Profit calculation: Your stake × number of points the market moves in your chosen direction.
Leverage: You only deposit margin, amplifying profits and losses.
Markets: Similar to CFDs, including forex, indices, commodities, and shares.
Example: A trader places a spread bet of £5 per point on the FTSE 100 at 7,500. If the FTSE rises to 7,520, the gain is based on the point movement of the FTSE 100: 20 points × £5 = £100 profit. If the FTSE falls by 20 points, the loss is also £100.
Spread Betting vs CFD Trading: Key Differences
While both products work in similar ways, there are fundamental differences between spread betting and CFD trading. The table below highlights the most important differences in taxation, availability, and trading style.
Aspect
CFD Trading
Spread Betting
Tax treatment
Subject to capital gains tax; losses may offset gains
Commonly used for hedging portfolios as well as speculation
Primarily designed for short-term speculation
Transparency of costs
Commissions and financing fees shown separately, offering cost breakdown
Costs are bundled into the spread, making pricing simpler but less transparent
1. Tax treatment
With CFDs, any gains are typically subject to capital gains tax, but losses can be offset against other gains, offering a tax advantage in certain situations. Spread betting, by contrast, is tax-free in the UK and Ireland, which makes it especially appealing to retail traders seeking efficient speculation.
2. Accessibility
CFDs are available across most global markets, making them the standard choice for international traders. Spread betting is restricted mainly to the UK and Ireland due to its regulatory framework and tax treatment.
3. Profit calculation
CFDs calculate profit or loss based on the size of the contract traded and the difference between the opening and closing price. Spread betting simplifies this by using a stake-per-point system, which makes it straightforward for beginners to understand.
4. Costs
With CFDs, you may face both spreads and commissions depending on the asset class, plus overnight financing fees. Spread betting usually has costs built directly into the spread, which can be wider than CFD spreads but easier to calculate.
5. Regulation
CFDs are offered under various regulators worldwide, from the FCA in the UK to ASIC in Australia and CySEC in Europe, giving traders a wide choice of platforms. Spread betting, on the other hand, is regulated almost exclusively in the UK and Ireland.
6. Trading style suitability
CFDs are often used not just by retail traders but also by institutions as a hedging tool, for example protecting a stock portfolio against potential downturns. Spread betting is mostly used by retail traders for short-term speculation rather than long-term strategies.
7. Transparency of costs
CFD brokers typically show commissions, financing charges, and spreads separately, which can help traders understand where fees are coming from. Spread betting wraps everything into the spread itself, which is simpler but can make it harder to judge the real cost of trading.
These differences highlight why the choice between CFD trading and spread betting often comes down to personal circumstances. Tax efficiency makes spread betting more appealing for UK traders, while CFDs offer global availability and flexibility for hedging strategies. Understanding how profits are calculated, how costs are charged, and the transparency of each product helps traders decide which is best for their individual needs.
Similarities Between CFD Trading and Spread Betting
Despite their differences, both products share important features that appeal to active traders. The table below highlights the main similarities.
Aspect
Explanation
Leverage
Both products allow you to control a larger position with a smaller margin deposit, amplifying profits and losses.
Directional trading
You can take both long (buy) and short (sell) positions, giving opportunities in rising and falling markets.
Market access
Both provide exposure to a wide range of global markets including forex, indices, shares, commodities, and crypto.
Trading platforms
Both are available through modern online trading platforms with real-time charts, indicators, and risk management tools.
Short-term suitability
Both are commonly used for short- to medium-term trading strategies, rather than long-term investing.
Both CFD trading and spread betting share these core features, making them attractive to traders who want flexible ways to participate in the financial markets. The ability to trade with leverage, take long or short positions, and access global instruments through modern platforms explains why both products are widely used for short-term trading strategies.
CFD Trading or Spread Betting: Which One is Best for Me?
The choice between CFD trading or spread betting depends on where you are and how you trade. Spread betting suits UK and Irish traders seeking tax-free profits and simplicity, while CFDs are better for global traders who want transparency and flexibility. Below are the key reasons why each option may be right for you.
Choose spread betting if:
You are based in the UK or Ireland, where spread betting profits are tax-free.
You prefer a simple stake-per-point model to calculate profit and loss.
You want to speculate on short-term price movements without capital gains tax.
Choose CFD trading if:
You are outside the UK and Ireland where spread betting is unavailable.
Both CFDs and spread betting allow you to speculate on financial markets without owning the underlying asset, but the choice depends on your location and trading goals. Spread betting is best suited for UK and Irish traders who want tax-free profits and a simple stake-per-point model, while CFDs provide global availability, transparent pricing, and the flexibility to hedge or speculate. Whichever you choose, it is essential to manage leverage carefully and trade with a clear strategy.
Start CFD Trading or Spread Betting Today with VT Markets
If you are ready to explore financial markets, VT Markets offers a secure and regulated platform with competitive spreads, access to global markets, and advanced trading tools such as MetaTrader 4 (MT4) and MetaTrader 5 (MT5). Our Help Centre is also available to guide you through account setup, platform features, and trading support whenever you need it.
Not ready for the live market yet? Try a VT Markets demo account in a risk-free environment and practice with virtual funds until you are prepared to trade live.
Frequently Asked Questions (FAQs)
1. Is CFD trading better than spread betting?
Neither is automatically better. CFDs are available worldwide and suitable for both hedging and speculation, while spread betting is restricted to the UK and Ireland but offers tax-free profits.
2. Do both CFDs and spread bets offer leverage?
Yes. Both products use leverage, allowing you to control larger positions with a smaller deposit, but this also magnifies potential losses.
3. Which is riskier: CFD trading or spread betting?
Both carry similar risks due to leverage and volatility. The real risk depends on your strategy, position sizing, and how you manage stop-losses.
4. Can I trade both CFDs and spread bets with the same broker?
Yes. Some brokers, such as VT Markets, offer access to both, giving traders the flexibility to choose the product that suits them best.
5. Which offers more transparency: CFDs or spread betting?
CFDs provide a clearer breakdown of costs, including spreads, commissions, and financing fees. Spread betting bundles costs into the spread, which is simpler but less transparent.
6. Do I pay overnight fees on both CFDs and spread bets?
Yes. Financing charges apply if leveraged positions are held overnight in both CFDs and spread bets. These costs vary depending on the broker and the asset traded.
7. Can beginners trade CFDs or spread bets?
Yes, but it is important for beginners to start small or use a demo account. Both products involve leverage, which can lead to losses greater than your initial deposit if not managed carefully.
8. Are profits from CFDs or spread betting guaranteed?
No. Both products carry risk, and while leverage can magnify gains, it can also increase losses. Success depends on skill, strategy, and risk management.
Please note that the dividends of the following products will be adjusted accordingly. Index dividends will be executed separately through a balance statement directly to your trading account, and the comment will be in the following format “Div & Product Name & Net Volume”.
Please refer to the table below for more details:
The above data is for reference only, please refer to the MT4/MT5 software for specific data.
If you’d like more information, please don’t hesitate to contact info@vtmarkets.com.
The euro is in the spotlight as traders look to upcoming eurozone PMI data for fresh clues on the region’s recovery. With sentiment still fragile and mixed signals coming from industry and consumers, markets are weighing whether the latest surveys will confirm momentum or highlight renewed weakness.
Market focus shifts to eurozone recovery signals
The euro slipped on Thursday as traders took a cautious stance before the release of the latest eurozone purchasing managers’ index (PMI) data – a report widely viewed as a barometer of the region’s economic recovery.
EUR/USD dipped 0.2% to 1.1631, with market sentiment subdued amid concerns the results may underwhelm expectations.
The euro-zone economy is likely to see slower growth this quarter, with question marks over global trade remaining despite recent deals with the US reducing uncertainty, ECB President Christine Lagarde said https://t.co/vw8xaUHnJM
However, a weaker reading could realign them with signals pointing to slower growth momentum.
Investors have been hoping that the surveys would reinforce the recovery story, but optimism remains fragile due to lacklustre industrial production and softer consumer confidence figures.
Technical analysis
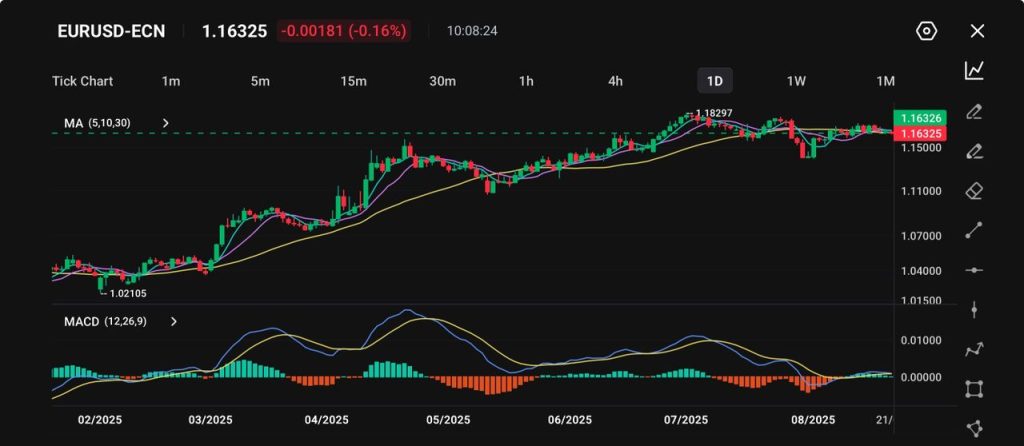
EUR/USD has been climbing steadily from its February low around 1.0210, peaking at 1.1829 in July before moving sideways in a consolidation phase.
At present, the pair trades close to 1.1632, staying comfortably above the 1.1500 support area.
EUR/USD trades near 1.1633, rebounding from February lows with support from key moving averages and a near-zero MACD, as shown on the VT Markets app.
Short-term moving averages (5, 10, 30) are levelling out, suggesting diminished momentum, while the MACD indicator hovers around the zero line, signalling indecision following the earlier strong rally.
Immediate resistance is located between 1.1700 and 1.1830, with a breakout above this zone likely to revive the broader bullish trend.
Conversely, a fall beneath 1.1500 would shift the outlook bearish, opening the door toward 1.1350.
Until then, EUR/USD remains range-bound, with traders awaiting fresh cues from economic data and European Central Bank guidance.
Cautious forecast
Should PMIs come in softer than expected, EUR/USD could slide back towards the 1.1500 mark, with ripple effects potentially extending to bond and equity markets as investor confidence weakens.
Such an outcome would reinforce the view that eurozone growth is losing steam, prompting markets to reassess expectations for European Central Bank policy tightening.
On the other hand, stronger-than-expected figures may lift the pair towards 1.1750.
A decisive break higher could encourage fresh buying interest, yet sustaining momentum above 1.1800 may prove difficult without broader macroeconomic support, such as firmer industrial output, stronger consumer sentiment, or clearer signals from policymakers.
For now, traders remain cautious, with the PMI release set to act as a key trigger for short-term direction.
Why can a single speech from the Federal Reserve send global markets into a frenzy? For traders, the annual Jackson Hole symposium in Wyoming is one of those moments where words carry the weight of billions.
This year, all eyes are on Chair Jerome Powell’s address on 22 August, which comes just after the release of the July FOMC minutes. With inflation cooling to 2.7% year on year, but producer prices running hotter than expected, markets are pricing in a possible 25 basis point rate cut in September.
For traders, this can feel like trying to read tea leaves. Yet understanding the Fed’s signals is less about prediction and more about preparation.
Why the Jackson Hole symposium matters
The Jackson Hole symposium is not just another economic conference – it is the stage where central bankers, academics, and policymakers set the tone for global markets.
Hosted each August by the Federal Reserve Bank of Kansas City, the event has a track record of producing market-moving speeches. For traders, it is less about the setting in the Wyoming mountains and more about the signals given.
Think of the Fed as a captain steering a large ship through uncertain waters. Interest rate decisions are the adjustments to the wheel, and Jackson Hole is when the captain explains where the ship is heading next.
For retail traders, the lesson is simple: Jackson Hole offers clues about future rate decisions. Whether the Fed signals that cuts are imminent or that caution still rules the day, these cues directly shape price action in equities, USD currency pairs, and safe-haven assets.
The July FOMC minutes: What they revealed
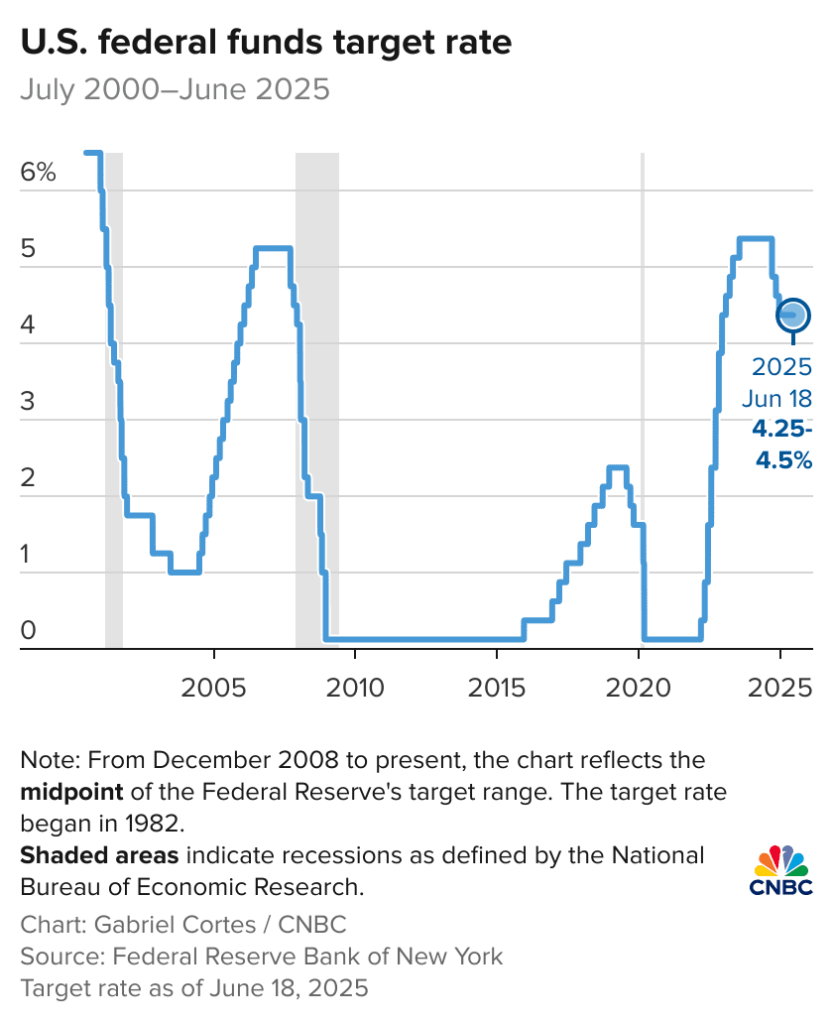
The July meeting of the Federal Open Market Committee (FOMC) left interest rates unchanged at 4.25%–4.50%, but the minutes released on 20 August gave traders a peek behind the curtain.
They showed a committee still divided: most members preferred to keep policy steady, but a minority pushed for cuts, citing a softer labour market.
Inflation data has also painted a mixed picture. Consumer price growth cooled to 2.7% year on year, edging closer to the Fed’s 2% target. Yet producer prices rose faster than expected, reminding markets that underlying pressures remain.
This tug-of-war between cooling consumer inflation and sticky business costs is central to the Fed’s dilemma.
For traders, the minutes were a reminder that policy isn’t on autopilot. Markets responded cautiously, with equities ticking higher and the dollar slipping slightly. But the bigger question is what happens next – and that’s where Powell’s Jackson Hole speech takes centre stage.
Spotlight on Jackson Hole and Powell’s speech
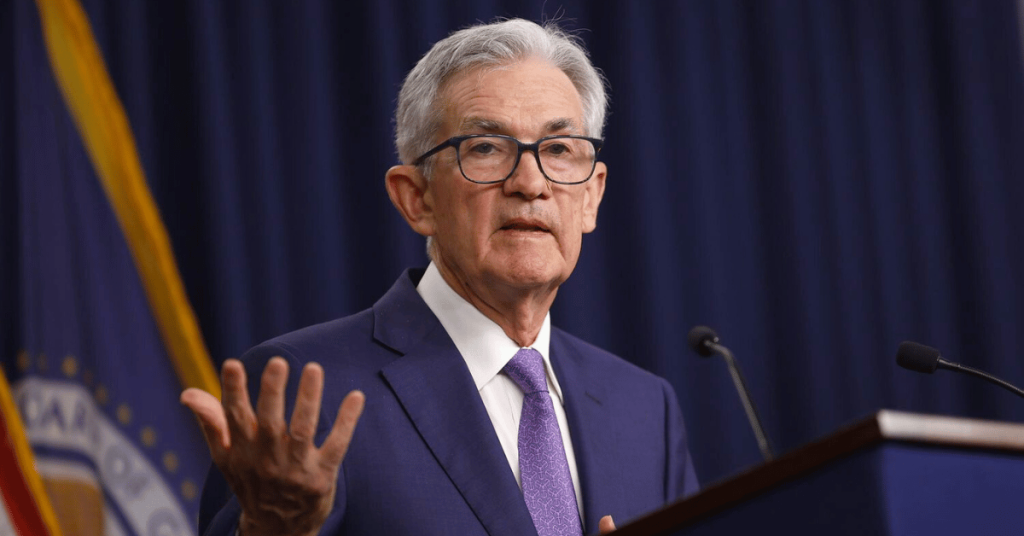
Every year, one speech dominates the Jackson Hole symposium: the remarks from the Fed Chair. On Friday 22 August, Jerome Powell will deliver his outlook on the economy, and traders will be listening for every nuance.
The theme of this year’s gathering is “Labour markets in transition”, a subject closely tied to the Fed’s dual mandate of stable prices and maximum employment.
With wage growth slowing and job openings shrinking, Powell faces the challenge of balancing progress on inflation with signs of softening in the labour market.
Why does this matter for markets? History shows that Jackson Hole speeches often set the tone for months ahead. A hawkish Powell in 2022 sent the S&P 500 tumbling within hours, while a more dovish message in 2023 sparked rallies in gold and tech stocks.
This year, even a subtle hint about the size or timing of rate cuts could swing equities, forex pairs, and commodities.
For traders, the key is not just what Powell says, but how markets interpret his words – sometimes it’s the tone, not the text, that moves prices.
How Fed signals impact your trades: Equities, forex, and gold
Understanding how the Fed’s words affect markets is crucial for traders.
Equities: Lower interest rates often support stocks because borrowing costs fall, and companies can invest more. If Powell hints at a rate cut, indices like the S&P 500 or Nasdaq may rally. Conversely, a hawkish tone can trigger sell-offs, particularly in growth stocks sensitive to interest rates.
Forex (USD pairs): A dovish Fed typically weakens the US dollar. For example, EUR/USD may rise as traders buy euros against a softer dollar. Hawkish signals, on the other hand, can strengthen the USD, pushing pairs like USD/JPY higher.
Gold: Often seen as a safe haven, gold benefits when rates fall or the dollar weakens. A dovish speech can lift gold prices, while hawkish commentary may put pressure on the metal.
Mixed data, such as cooling CPI but hot PPI, can swing markets 1–2% within hours. Traders should be ready for quick moves and use the right risk management tools.
Practical tips for managing trades during volatility
Trading around major Fed events like Jackson Hole requires preparation and discipline. Here are some practical steps for non-professional traders:
Avoid over-leverage: Volatility can widen spreads and amplify losses. Stick to small positions – risking 1–2% of your account per trade is safer.
Use pending orders: Instead of chasing sudden moves, set buy or sell stops at key levels. This lets the market come to you.
Monitor correlations: EUR/USD often moves inversely to the dollar index (DXY), while equities react to risk sentiment. Understanding these links helps in planning trades.
Prepare for both scenarios:
Dovish Powell: consider EUR/USD long positions or tech stock exposure.
Hawkish Powell: USD/JPY long positions or hedging gold holdings may be appropriate.
Set stop-losses and take profits: Predefine exit points to protect gains and limit losses.
Conclusion
Jackson Hole is more than just a conference – it is a signal flare for traders, indicating the likely direction of Fed policy and market sentiment. Understanding Powell’s tone and the subtle hints in his speech can make the difference between a reactive trade and a prepared strategy.
The key lesson is simple: trading is less about predicting the Fed perfectly and more about preparing for both outcomes. By recognising how dovish or hawkish signals affect equities, forex, and gold, you can position your portfolio with discipline and confidence.
Start preparing your strategy today – and if you’re ready to act on opportunities in USD pairs, indices, and gold, consider opening a live account with VT Markets to execute trades efficiently and access professional tools designed for both beginners and seasoned traders.
Written on August 21, 2025 at 11:00 am, by valerie