US President Donald Trump announced plans to eventually lower tariffs on Chinese imports, citing the need for mutual business dealings. No immediate trade deals are expected this week, and there are no plans for talks with China’s Xi Jinping.
The uncertainty surrounding tariffs has impacted the currency market, with the US Dollar Index decreasing by 0.31% to 99.73. This change reflects the ongoing economic tension between the United States and China.
Understanding The Trade War
A trade war refers to economic conflict due to protective trade barriers like tariffs, leading to increased import costs. The US-China trade conflict, initiated in 2018 by Trump, involved tariffs due to disagreements over trade practices and intellectual property. China’s retaliatory tariffs escalated the situation, though the Phase One deal in 2020 aimed to ease tensions.
Donald Trump’s return to the presidency has rekindled trade conflict, threatening to impose 60% tariffs on China. This action from January 2025 sparks renewed economic tensions, impacting global supply chains and contributing to Consumer Price Index inflation. The resumption of policies post-Trump could affect global economic stability and trade dynamics.
Given Trump’s announcement about potential tariff reductions—though with no talks planned nor deals imminent—it’s a signal, not a shift. We’re looking at a rhetorical easing rather than a change in policy. Still, even this hint influences how markets react, particularly in currency and derivatives.
Last week’s Dollar Index slip to 99.73, a 0.31% decline, is less about numbers than about sentiment. The drop captures weakened confidence in trade relations with China following renewed threats of heavy tariffs. That’s the game we’re watching now: not what’s happening immediately, but what’s looming on the near horizon. Currency and interest rate volatility are typically some of the earliest pressure points in these scenarios, and we should expect that to continue in short bursts.
Implications For Derivative Traders
For derivative traders, this backdrop adds a layer of directional uncertainty. It’s clear now that the election implications are not merely speculative—they are being priced into long-term expectations. The rate market is particularly exposed to movements stemming from trade-related inflation. With a proposed 60% tariff in January next year, downstream effects on transport and manufacturing costs should be modelled more precisely. Inflation-linked instruments might see increased hedging activity, and we’re already observing wider spreads in long-duration protection.
Then there is the matter of future monetary policy response, which doesn’t act in a vacuum. Trade frictions affect consumer prices directly, which, in turn, influence central banks’ stances. In our view, the market is watching for strong signals from the Federal Reserve, particularly if tariff policies move from threat to implementation. Traders active in macro-driven strategies should prepare scenarios where trade restrictions push core CPI higher, compelling a hawkish shift from monetary authorities even if growth slows.
Lighthizer, a key architect in earlier trade frameworks, has not re-entered the discussion publicly, but the foundational approach he supported remains intact. Supply chains are familiar with the constriction from 2018 to 2020, and the Phase One agreement only partly unwound those strains. If the rhetoric translates into real-world restrictions, option premiums on multi-national manufacturing equities may begin to reflect expectations for lowered margins and shipment delays.
What we’re doing now is paying close attention to commodities as well. These goods are first affected by any bilateral import restrictions, especially agricultural and tech-related inputs. Derivatives linked to energy and industrial metals could begin to display asymmetric pricing as the speculation around Chinese retaliation develops. Risk skew is growing wider in some agricultural futures, though volume has yet to confirm broader sentiment shifts. That’s where historical cyclicality helps—past trade disputes offer a framework for timing exposure.
Early signals from corporate earnings calls reveal broader concerns about materials sourcing and ability to pass increased input costs to consumers. While that’s not new, we’re seeing a broader reassessment of forward guidance when references to tariffs resurface. Traders positioning around earnings volatility should consider that delayed impacts from trade may not be linear—and could arrive later than expected, particularly if consumer spending remains firm.
In times like this, we draw on market memory. The period between late 2018 and early 2020 established a template. Index options, especially those pegged to exporter-heavy benchmarks, displayed wider beta relative to trade developments. The same may reoccur if tariffs return in full next year. Calendar spreads and structured derivatives may be efficient tools to navigate this—delaying commitment while maintaining optional upside until further policy decisions clarify.
We should also flag that broader risk appetite wanes when trade actions inject pricing noise into inflation metrics. Bond implied volatility often leads that shift, and it is not coincidental that Treasury yields briefly wobbled following Trump’s tariff remark. Traders who operate in correlation-based models may need to actively account for breakpoints between commodity inflation and rate expectations, as assumptions of stable co-movement may not hold in renewed trade tension periods.
So while the lack of ongoing talks between the US and China appears to dampen near-term deal hopes, the forward-looking view from derivatives markets suggests otherwise. No sharp reactions should not be mistaken for complacency—pricing mechanisms are merely adjusting for longer arcs. And that’s where thoughtful positioning comes into play.
West Texas Intermediate (WTI), the US crude oil benchmark, is trading at approximately $55.75 during Asian trading hours on Monday. This follows an agreement by the Organization of the Petroleum Exporting Countries and allies (OPEC+) to raise production by 411,000 barrels per day in June.
The decision by OPEC+ to increase output was made on Saturday, marking a continuation from April’s unexpected hike for May. This move could result in up to 2.2 million barrels per day being reintroduced to the market by November.
Geopolitical Factors
April saw the largest monthly loss in oil prices since 2021, partly due to US tariffs increasing recession fears and slowing demand amid rising production. Geopolitical tensions, such as those in the Middle East, might limit further declines in WTI prices.
WTI Oil is a major crude oil type, also known as “light” and “sweet” due to its low gravity and sulfur content. As a benchmark for oil markets, its price is influenced by factors like global growth, political instability, and currency value.
API and EIA’s weekly oil inventory reports impact WTI Oil prices by indicating supply and demand changes. OPEC’s decisions on production quotas can also significantly impact WTI Oil prices.
From where we currently stand, this latest production decision signals how OPEC+ is proceeding with caution—though simultaneously moving forward in reinstating barrels taken off the table during previous cuts. That increase of 411,000 barrels daily for June, originating from Saturday’s meeting, appears aimed at pacing the build-back of supply whilst avoiding a fresh supply-demand mismatch.
By now, we can presume that if this pattern continues and the full reintegration of 2.2 million barrels per day occurs by November, market participants are likely to experience gradually shifting dynamics in futures pricing. The production volumes re-entering the system, though perhaps manageable in the short term, suggest growing pressure on the lower end of WTI’s current trading corridor, especially as inventories react.
Near Term Volatility
Following April’s sharp descent—the worst seen since 2021—there’s little surprise that geopolitical uncertainty continues to serve as a backstop for further declines. The combination of slowing global demand, sparked in part by trade tensions and recession-related concern, with rising supply hasn’t created the kind of stabilising effect one might normally expect. Instead, it’s added complexity to positions and increased delta sensitivity in shorter-end contracts.
We’re keeping close attention on the API and EIA reports, as changes in inventory figures have typically triggered intraday shifts. Strong builds in crude stocks, particularly at Cushing, can offset the stabilising nerves around geopolitical hotspots, while sharp draws hint at tightening supply that might not be visible in production statistics alone. For those positioned in shorter expiries, the week-over-week data remains essential.
With WTI still holding above $55 but below prior support ranges, near-term volatility linked to any divergence in reported inventory or lingering macro policy rhetoric—particularly from Washington—shouldn’t be underappreciated. There’s also the matter of how quickly newly added barrels reach real consumption markets, as refining capacity and transportation bottlenecks can create time lags that aren’t always priced accurately in the curve.
Brent-WTI spreads may come into play more decisively as arbitrage opportunities arise. A narrower spread could hint at softer export interest in U.S. barrels, while any widening could entice more shipments abroad. For those with exposure to inter-commodity spreads, this movement remains instructive. Furthermore, with WTI’s low sulfur content—its famed “sweetness”—the physical attractiveness of the crude doesn’t always align with headline numbers; thus, basis trades and regional dislocations should be examined closely.
Weekly positioning shifts in the derivatives space have shown a tilt towards hedging, possibly suggesting a wait-and-see approach among institutions rather than aggressive speculation. As we continue tracking these movements, attention should remain on not just the volume added by OPEC+, but also on how regional refiners and global buyers respond through crack spreads and procurement behaviour.
By looking at the futures curve, we’re beginning to notice a mild downward slope near the front—an indication that supply confidence is reasserting itself, at least temporarily. However, watching backwardation’s degree over the next several sessions could offer clues about whether the market still sees tightness ahead or is beginning to price in balance returning faster than expected.
Oil prices are once again in the spotlight as markets respond to shifting global dynamics. Hopes for progress in US-China trade talks have helped lift investor sentiment, while renewed geopolitical tensions and uncertainty around future OPEC+ output continue to shape expectations. With both demand outlook and supply decisions hanging in the balance, the crude oil market remains highly sensitive to economic and political signals.
Crude oil rallies on renewed hopes of US-China trade breakthrough
Crude oil prices advanced on Friday amid growing optimism over easing trade tensions between the United States and China.
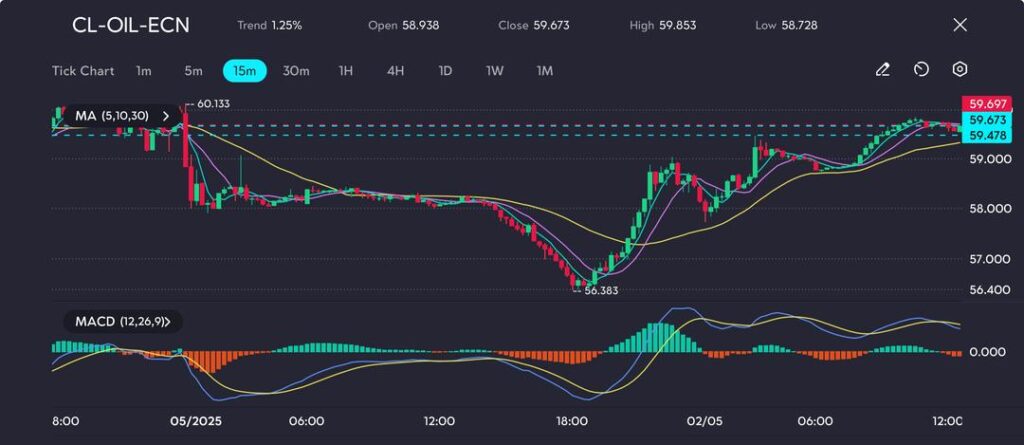
WTI crude climbed 0.8% to settle at USD 59.74 per barrel, while Brent crude edged up by 49 cents to close at USD 62.62.
House Republicans plan to raise more than $15 billion in revenue through increasing US oil, gas and coal lease sales, as well as other measures, to help pay for President Donald Trump’s massive tax cut package https://t.co/o2LQu57S9u
Both benchmarks built on Thursday’s gains, recovering from midweek losses triggered by concerns over potential changes in OPEC+ supply policy.
Investor confidence received a boost after China’s Commerce Ministry confirmed it was assessing a US proposal for tariff negotiations, raising hopes for progress in resolving the long-running dispute.
With fears of a global demand slowdown briefly easing, oil markets found renewed upward momentum.
Technical analysis: Oil eyes resistance after strong rebound
WTI crude staged a robust rebound from a recent low near USD 56.38, closing in on the USD 59.67 mark.
Following a sharp pullback from USD 60.13, prices stabilised before staging a strong upside reversal.
The short- to medium-term moving averages (5, 10, 30) have shifted into bullish alignment, with the price now trading firmly above these key technical indicators.
Oil claws back above USD 59 after a strong bounce from USD 56. Momentum slows near resistance, as seen on the VT Markets app.
The MACD (12,26,9) supports the bullish outlook, showing a clear crossover and expanding green histogram bars.
However, a slight flattening in the slope suggests potential for short-term consolidation.
Immediate resistance sits between USD 59.85 and USD 60.13—a break above this zone could pave the way for a retest of the USD 61.00 level.
Despite the current momentum favouring bulls, the market may pause after such an aggressive rally.
Geopolitical pressure and OPEC+ dynamics remain in focus
Meanwhile, geopolitical risks re-emerged after US President Donald Trump warned of secondary sanctions on countries purchasing Iranian oil, following a collapse in nuclear negotiations with Tehran.
This move aligns with Washington’s ongoing maximum pressure strategy, which has previously helped underpin oil prices by tightening supply expectations.
However, upside potential remains constrained. According to Reuters, Saudi Arabia appears hesitant to extend existing output cuts, even as prices remain below the kingdom’s preferred range.
The upcoming OPEC+ meeting on 5 May will be crucial, with eight member nations expected to finalise plans for June’s production levels.
Some participants are reportedly pushing for a second consecutive output increase, while non-OPEC production continues to climb, posing challenges for supply management.
Oil market outlook: Cautious optimism prevails
As China’s trade policy shifts and OPEC+ production talks loom, crude oil markets are likely to remain sensitive to fresh headlines.
While the recent rally has cleared initial resistance, sustained gains will require greater clarity from both Washington and Riyadh.
Traders should watch the USD 60.13 level closely for confirmation of a bullish continuation in the near term.
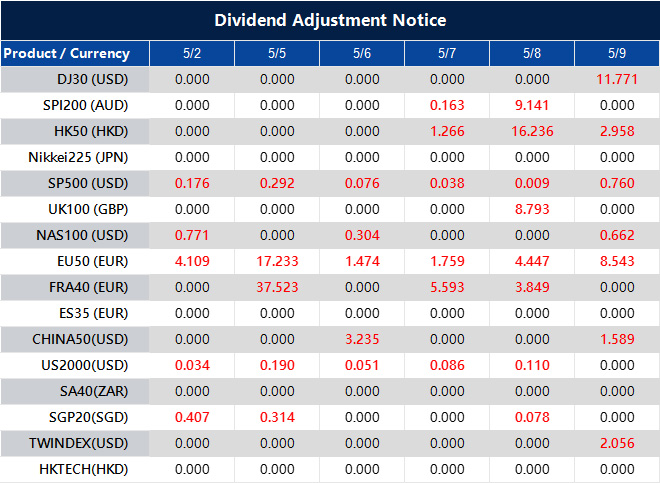
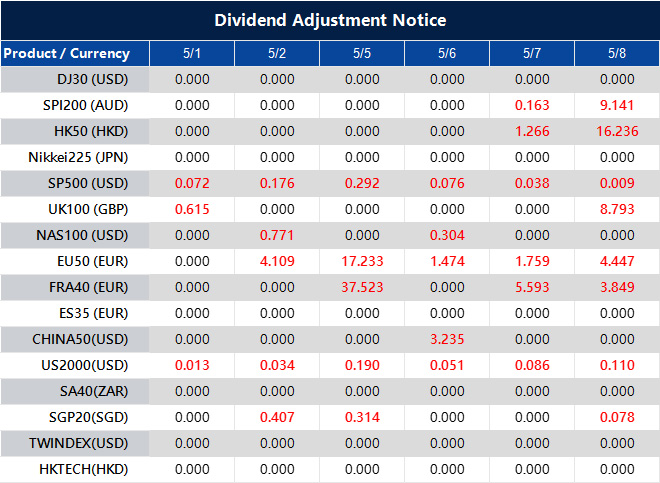
Please note that the dividends of the following products will be adjusted accordingly. Index dividends will be executed separately through a balance statement directly to your trading account, and the comment will be in the following format “Div & Product Name & Net Volume”.
Please refer to the table below for more details:
The above data is for reference only, please refer to the MT4/MT5 software for specific data.
If you’d like more information, please don’t hesitate to contact info@vtmarkets.com.
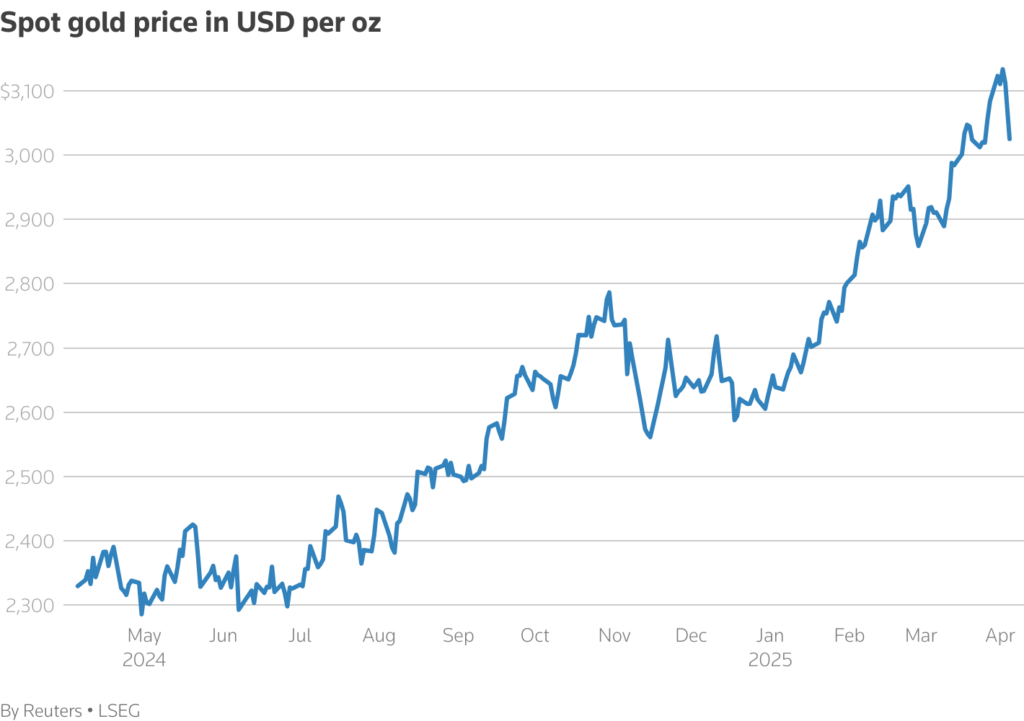
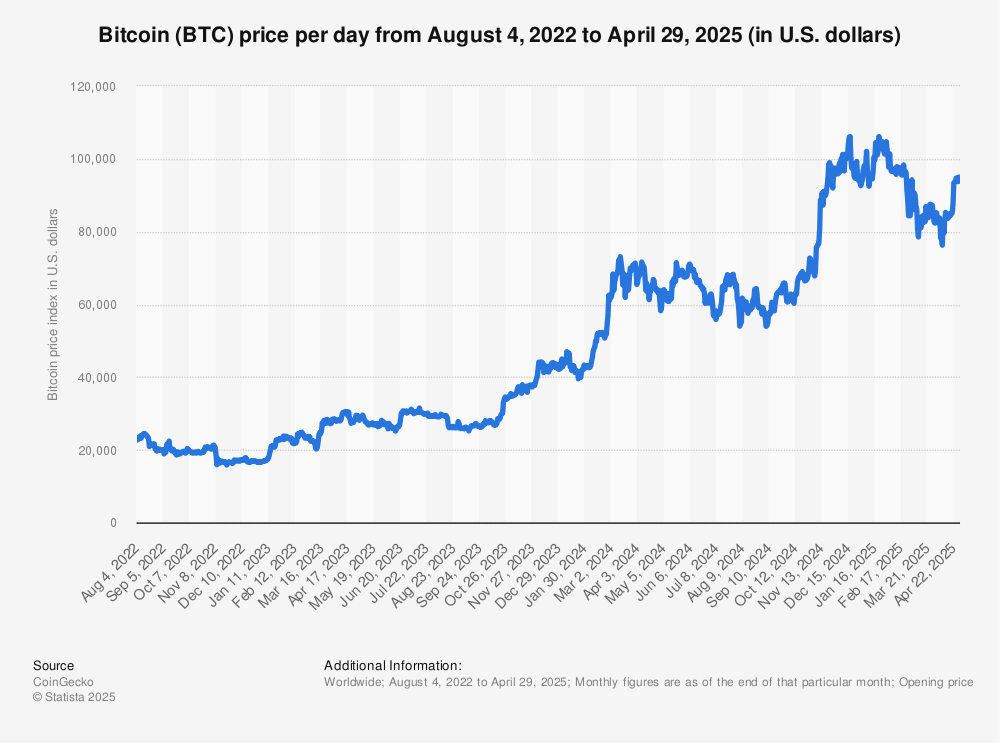
In April 2025, as global markets shuddered under the weight of escalating US-China trade tensions and President Trump’s aggressive tariff announcements, gold prices soared past USD 3,300 per ounce, cementing its status as a beacon of stability. Meanwhile, Bitcoin, often dubbed “digital gold,” surged 23% amid the chaos.
These are prime examples of safe-haven assets—investments that hold or gain value when markets turn turbulent. For traders, understanding and trading these assets can be a lifeline in volatile times, protecting portfolios from steep losses or even yielding profits.
What are safe-haven assets?
Safe-haven assets are investments that investors flock to during economic or geopolitical uncertainty. They are prized for their low volatility, high liquidity, and ability to retain value when stocks or riskier assets falter. Think of them as lifeboats on a stormy sea—while other investments may sink, these keep your portfolio steady.
Here are the most common safe-haven assets:
Gold: A tangible asset that shines in crises. In 2025, gold surged 26% as trade war fears intensified, proving its enduring appeal.
US Treasuries: Government-backed bonds traditionally seen as ultra-safe, though recent sell-offs in 2025 have raised questions about their reliability.
Swiss franc and Japanese yen: Currencies from stable economies, often strengthening when global confidence wanes.
Bitcoin: Once a speculative asset, Bitcoin has gained traction as a safe haven, rallying above USD 90,000 in April 2025 during tariff-driven market dips.
These assets act as a hedge, balancing losses in riskier holdings like stocks or emerging market currencies. For retail traders, they offer a way to safeguard wealth or capitalise on market fear.
Why safe-haven assets shine in market turmoil
Markets turn turbulent when uncertainty spikes—think geopolitical conflicts, trade disputes, or economic slowdowns.
In April 2025, Trump’s announcement of 145% tariffs on Chinese imports triggered a global sell-off, with the S&P 500 dropping 4% in a week. Investors, seeking shelter, poured capital into safe-haven assets, driving up their prices.
This flight to safety is a hallmark of investor behaviour. When confidence in stocks or fiat currencies erodes, assets like gold or the Swiss franc become go-to havens.
For instance, as US Treasuries faltered in 2025—losing their safe-haven allure due to tariff-related instability—gold and Bitcoin stole the spotlight. Gold hit record highs, while Bitcoin’s 23% rally underscored its growing role as a hedge against uncertainty.
However, safe havens aren’t immune to short-term dips. Gold, for example, briefly fell 5% in 2025 due to margin calls during peak volatility.
Still, their long-term stability makes them a powerful tool for traders. By trading safe havens, you can protect your capital or profit from market fear, turning turmoil into opportunity.
How to trade safe-haven assets
Trading safe-haven assets doesn’t require a finance degree—just a clear strategy and discipline. Here is a step-by-step guide to get started, tailored for non-professional traders:
Step 1: Choose your asset
Select a safe-haven asset based on your trading style and market conditions:
Gold: Trade via exchange-traded funds (ETFs) like the VanEck Junior Gold Miners ETF, which soared 40% in 2025, or use contracts for difference (CFDs) on platforms like VT Markets for leveraged exposure.
Forex pairs: Trade USD/CHF or USD/JPY to gain exposure to the Swiss franc or Japanese yen, both liquid and accessible via forex brokers.
Bitcoin: Available on crypto exchanges or as CFDs for short-term trades. Its volatility suits experienced traders comfortable with risk.
Step 2: Analyse market conditions
Stay ahead by monitoring news and technical signals:
Follow news feeds for triggers like tariff announcements or central bank policy shifts. For example, US-China trade talk breakdowns in April 2025 signalled a gold rally.
Use technical indicators like the Relative Strength Index (RSI) or 50-day moving averages to time entries. Gold’s breakout above USD 3,200 in 2025 was a clear buy signal for traders.
Step 3: Manage risk
Protect your capital with disciplined risk management:
Set stop-loss orders to cap losses. For instance, if you buy gold at USD 3,200, place a stop-loss at USD 3,136 (2% below) to limit downside.
Avoid high leverage, especially on volatile assets like Bitcoin. Stick to 10:1 leverage or lower to manage risk.
Use VT Markets’ risk management tools, like real-time alerts, to stay on track. VT Markets offers powerful tools to support your trading—demo accounts, advanced charting, and educational resources. Start with these to hone your skills and trade smarter.
Step 4: Diversify
Don’t put all your eggs in one basket. Combine safe havens (e.g., gold and the Yen) with other assets to balance risk and reward.
Risks and considerations
Safe-haven assets are not a magic bullet. Even gold can be volatile short-term, as seen in its 5% dip during 2025’s margin call frenzy. US Treasuries, once a bedrock, lost appeal amid tariff-driven uncertainty. Over-relying on safe havens can also mean missing growth opportunities in calmer markets.
Trading costs are another factor. CFDs and ETFs carry fees, and high leverage can amplify losses if markets move against you. Emotional trading—panic-buying gold at peak prices, for instance—often leads to poor decisions.
To stay safe, stick to a trading plan, use stop-losses, and rely on trusted platforms like VT Markets for market insights and tools.
Conclusion
In a world of market uncertainty, safe-haven assets like gold, the Swiss franc, and even Bitcoin are your anchors. As 2025’s trade war turmoil showed, these assets can protect your portfolio or deliver profits when stocks falter. By choosing the right asset, analysing market signals, and managing risk, you can navigate volatile markets with confidence.
Ready to take control? Start exploring safe-haven trading with VT Markets’ demo account to practise risk-free, or dive into the educational resources to sharpen your skills. For those eager to trade live, open a live account with VT Markets today and access powerful tools to trade gold, forex, and more. In turbulent times, safe-haven assets are your edge—trade them wisely to stay ahead.
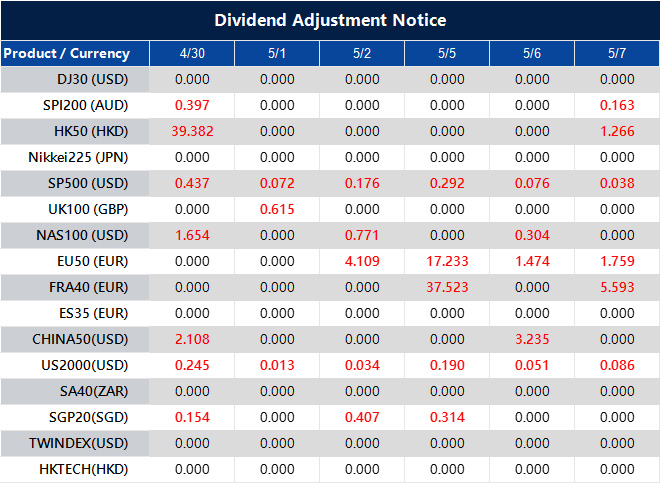
Please note that the dividends of the following products will be adjusted accordingly. Index dividends will be executed separately through a balance statement directly to your trading account, and the comment will be in the following format “Div & Product Name & Net Volume”.
Please refer to the table below for more details:
The above data is for reference only, please refer to the MT4/MT5 software for specific data.
If you’d like more information, please don’t hesitate to contact info@vtmarkets.com.
The US dollar is showing signs of resilience as global markets weigh the impact of recent economic data and shifting trade dynamics. While investors remain cautious, the currency’s steadiness suggests growing confidence that policymakers may respond with supportive measures if conditions worsen.
US Dollar Index holds ground as trade policy speculation builds
The US Dollar Index (USDX) remained relatively stable around the 99.18 mark on Tuesday, reflecting underlying strength despite increasing speculation that softer economic indicators could prompt a shift in US trade strategy.
The index reached an intraday peak of 99.221 before easing back slightly in later sessions.
Analysts, including Commerzbank’s Thu Lan Nguyen, suggest that continued economic underperformance may compel the White House to adopt a more accommodative stance on tariffs.
President Donald Trump has already exhibited a degree of flexibility, having temporarily halted several reciprocal tariff measures in response to recent market volatility earlier this quarter.
Technical analysis
The USDX is currently exhibiting signs of a mild rebound, having found support at 98.644. The index has since moved up to 99.181, now testing resistance near the 99.226 level.
Short-term moving averages (5, 10, 30) have begun to incline upward, indicating a potential bullish trend as momentum shifts in favour of buyers.
The MACD (12,26,9) also supports this narrative, with a bullish crossover and an expanding positive histogram suggesting growing upward momentum.
Although gains remain moderate, sustained movement above the psychological threshold of 99.00 could open the door for a potential retest of the 99.45 to 99.50 range.
While the short-term sentiment has turned positive, market participants should remain cautious of possible consolidation should the index struggle to clear the current resistance zone.
Market outlook
Investors are closely monitoring forthcoming data releases for clues as to whether the economic landscape could deteriorate sufficiently to prompt a more dovish response—either from the White House or the Federal Reserve.
A notable downside surprise could reinforce expectations that President Trump may further soften his trade policy stance in an effort to stabilise the economy and restore investor confidence.
What Is Swing Trading? Learn How It Works for Traders
Swing trading is a popular approach for traders who aim to capture short to medium-term price movements without being tied to their screens all day. It offers a balance between the fast pace of day trading and the patience required for long-term investing. If you’re curious about how swing trading works and why it appeals to so many traders, this article will walk you through the fundamentals. We’ll explore what swing trading is, highlight the popular swing trading strategies, and explain how traders use this method to take advantage of market momentum and short-lived trends.
What Is Swing Trading?
Swing trading is a trading approach that focuses on capturing gains from short to medium-term price movements, typically lasting from a few days to a few weeks. Unlike day trading, which requires entering and exiting positions within the same day, swing trading allows traders to hold positions longer, giving the market time to develop a clearer direction. This strategy revolves around identifying “swings” in market momentum—whether it’s a short-term uptrend or a temporary dip—and entering trades at points where a price reversal or continuation is likely. Because of its flexibility and moderate time commitment, swing trading is often favoured by part-time traders and those looking to balance analysis with actionable opportunities.
How Does Swing Trading Work?
Swing trading works by leveraging technical analysis to find entry and exit points within trending markets. A swing trader typically looks for patterns, candlestick patterns, and momentum indicators like the RSI or MACD to forecast short-term movements. Unlike scalpers or intraday traders, swing traders hold positions overnight or even across several weeks, aiming to benefit from predictable market corrections or breakouts.
Example: If the S&P 500 pulls back to a key support level during an uptrend, a swing trader may enter a long position, aiming to ride the next leg upward. They typically place trades with predefined stop-loss and take-profit levels to manage risk and lock in potential gains.
Popular Swing Trading Strategies
Successful swing trading strategy selection depends on the asset and timeframe, but here are the most common approaches:
Breakout Trading
Breakout trading strategy involves entering a trade when the price breaks above a resistance level or below a support level, often followed by a surge in volatility.
Example: A trader spots the EUR/USD breaking above 1.0900 after several failed attempts. Once the breakout occurs on high volume, they enter a long position, targeting the next resistance zone.
RSI-Based Trading
The Relative Strength Index (RSI) helps traders identify potential reversals by highlighting overbought or oversold conditions. Readings below 30 suggest oversold levels, while readings above 70 suggest overbought.
Example: A trader notices Amazon (AMZN) with an RSI of 28 during a market dip. Once the RSI starts climbing, they initiate a buy, aiming to ride the recovery over the next few days.
Moving Average Crossover
This method uses two moving averages—a short-term and a long-term one. A bullish signal occurs when the short-term MA crosses above the long-term MA, and vice versa for a bearish signal.
Example: On the S&P 500 ETF (SPY), the 20-day moving average crosses above the 50-day, indicating bullish momentum. The trader enters a swing trade anticipating a continued uptrend.
Momentum-Based Trading
This strategy focuses on entering trades when price momentum is strong, often supported by indicators like MACD or sudden volume spikes.
Example: A trader sees a surge in trading volume on Tesla (TSLA) with the MACD turning positive. Believing the rally has strength, they enter a long trade to capture the ongoing price acceleration.
How to Swing Trade
To implement an effective swing trading strategy, follow these practical steps:
Step 1: Understand How Swing Trading Works
Start by learning the core principles of swing trading. Know how it operates, what timeframes it uses, and how it differs from other trading styles.
Step 2: Choose a Market to Swing Trade
Select the asset class you want to focus on, whether it’s forex, stocks, indices, or commodities. Different markets suit different strategies and risk levels.
Step 3: Choose a Broker
Select a reliable and regulated broker that offers fast execution, low spreads, and access to trading platforms like MT4 or MT5. A good broker makes a big difference in execution and costs.
Step 4: Create and Fund Your Trading Account
Create a live trading account with your selected broker. Deposit capital into your trading account based on your trading plan. Be sure the funds match your risk tolerance and strategy size.
Step 5: Identify a Tradable Setup
Use technical analysis to spot potential trade setups based on your swing trading strategy, such as breakouts or RSI signals.
Step 6: Time Your Entry
Refine your entry point by confirming momentum or volume conditions. This helps reduce the chance of entering on false signals.
Keep an eye on your active trades. If the trade moves favourably, consider trailing your stop-loss to protect profits while allowing room for growth.
Step 9: Review Your Performance
After each trade, note the setup, outcome, and what you learned. A trading journal is an essential tool for long-term growth and strategy refinement.
Swing Trading vs Day Trading: What’s the Difference?
Criteria
Swing Trading
Day Trading
Holding Time
Days to weeks
Intraday only
Time Commitment
Moderate
High
Strategy Type
Trend following, technical setups
Quick momentum scalps
Capital Needs
Flexible
Often higher due to frequent trades
Stress Level
Lower
Higher due to rapid decisions
Swing trading provides greater flexibility, allowing traders to hold positions for days or weeks without needing to monitor charts constantly. This makes it more suitable for those with full-time jobs or other commitments. On the other hand, day trading demands intense focus and quick decision-making, as trades are opened and closed within the same day, often in minutes or hours. While day traders seek rapid, small gains, swing traders aim to capture larger moves over time with fewer transactions.
Advantages and Disadvantages of Swing Trading
Like any trading style, swing trading comes with its own set of strengths and limitations. Understanding both the advantages and disadvantages can help you decide whether this approach suits your trading goals, risk tolerance, and lifestyle.
Advantages of Swing Trading:
Flexible time commitment
You don’t need to watch the markets every minute. Swing trading allows you to analyse charts after market hours and manage trades with less screen time.
Captures meaningful price movements
Unlike scalping or day trading, swing trades aim to ride larger price swings, which can lead to higher profit potential per trade.
Lower transaction costs
Fewer trades mean fewer fees. Since positions are held longer, you’re not paying commissions multiple times a day.
Clearer trade setups
Swing trading often uses higher timeframes like 4-hour or daily charts, reducing noise and making technical patterns easier to identify.
Disadvantages of Swing Trading:
Overnight and weekend risk
Holding trades for several days exposes you to market gaps or unexpected news events outside regular trading hours.
Requires strong technical skills
Since the strategy relies heavily on chart analysis, traders need to be confident in identifying patterns, trends, and support/resistance zones.
Patience is required
Swing trading doesn’t offer instant results. You may need to hold a position for days while resisting the urge to exit early.
False signals can still occur
Even with strong setups, markets can reverse unexpectedly. Without proper risk management, one bad trade can wipe out multiple gains.
Swing Trading on Different Asset Classes
Swing trading is versatile and can be applied across various instruments:
Stocks: Swing trading is highly effective in the stock market, especially with blue-chip stocks. These companies tend to have stable fundamentals and predictable earnings cycles, making them attractive for traders looking to capitalise on short-term price movements tied to quarterly reports, sector rotation, or macroeconomic sentiment.
Forex: The forex market is a favourite for swing traders due to its high liquidity and 24-hour access. Many focus on the most traded currency pairs like EUR/USD, GBP/USD, and USD/JPY, which offer smoother trends and lower spreads. These major currency pairs respond well to technical setups and are often driven by economic news such as central bank decisions or employment data.
Indices: Swing trading indices through ETFs or futures lets traders capture broad market sentiment. Instruments like the S&P 500 or NASDAQ Composite are ideal for trend-following strategies during earnings seasons or macro news cycles.
Commodities: Commodities like crude oil, silver, and XAUUSD (gold) are well-suited for swing trades, especially when inflation or geopolitical events drive momentum. Their volatility creates short-term trading windows that experienced swing traders can exploit.
Conclusion
Swing trading offers a balanced approach for traders who want to capture meaningful price movements without the pressure of constant monitoring. It combines the structure of technical analysis with the flexibility to trade across various markets, including stocks, forex, indices, and commodities. With the right swing trading strategy, effective risk management, and a disciplined mindset, traders can navigate market swings with greater confidence. Whether you’re new to trading or looking to refine your approach, swing trading can be a valuable tool to help you make the most of short-term trends.
Swing Trade Today with VT Markets
Ready to put your swing trading strategy into action? VT Markets provides everything you need to get started, including a free demo account that lets you practise in real market conditions without risking real capital. Whether you’re testing new trading strategies or fine-tuning your entries, the demo account is the perfect place to build confidence.
When you’re ready to go live, enjoy access to advanced platforms like MetaTrader 4 (MT4) and MetaTrader 5 (MT5), competitive spreads, and lightning-fast execution. Trade forex, indices, stocks, and commodities—all in one seamless, secure environment.
Swing trading is a trading style where positions are held for a few days to several weeks, aiming to profit from short-term price movements or market swings.
2. How does swing trading work?
Swing traders use technical analysis to identify entry and exit points, aiming to catch a portion of a market trend. They manage risk with stop-loss and take-profit levels and don’t need to monitor the market all day.
3. Is swing trading risky?
Like any trading style, swing trading involves risk, but proper stop-loss use and trade planning help manage it.
4. Is swing trading suitable for part-time traders?
Yes, swing trading is ideal for part-time traders as it doesn’t require constant monitoring. Most analysis can be done after market hours.
5. What markets can I swing trade?
You can swing trade a variety of assets, including stocks, forex, indices, and commodities. Each market offers different opportunities depending on volatility and liquidity.
6. What are the main risks in swing trading?
Overnight and weekend market gaps, false signals, and emotional decision-making are key risks. Using a clear strategy and proper risk management helps reduce exposure.
7. How do I manage risk in swing trading?
Set predefined stop-loss and take-profit levels, calculate appropriate position sizes, and avoid overtrading. This helps you stay disciplined and protects your capital.
8. Can I practise swing trading without using real money?
Yes, you can open a demo account to practise strategies in a risk-free environment. It’s a great way to gain confidence before trading with real funds.
Please note that the dividends of the following products will be adjusted accordingly. Index dividends will be executed separately through a balance statement directly to your trading account, and the comment will be in the following format “Div & Product Name & Net Volume”.
Please refer to the table below for more details:
The above data is for reference only, please refer to the MT4/MT5 software for specific data.
If you’d like more information, please don’t hesitate to contact info@vtmarkets.com.
Affected by international holidays, the trading hours of some VT Markets products will be adjusted. Please check the following link for the affected products:


 | VT Markets")

 | VT Markets")


