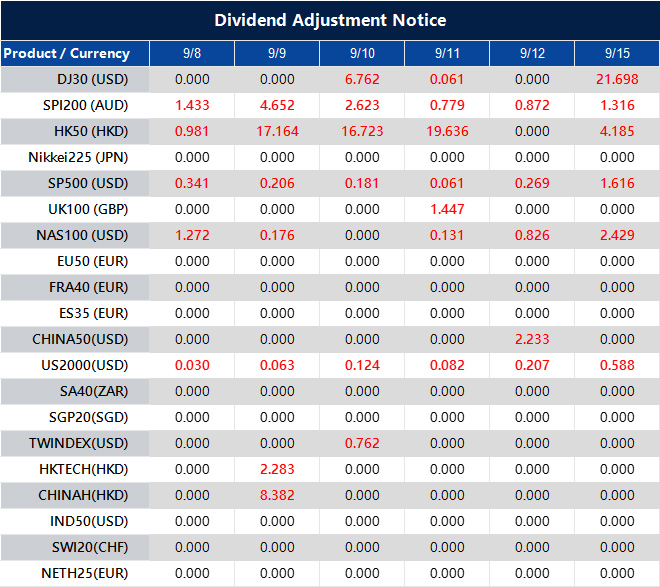
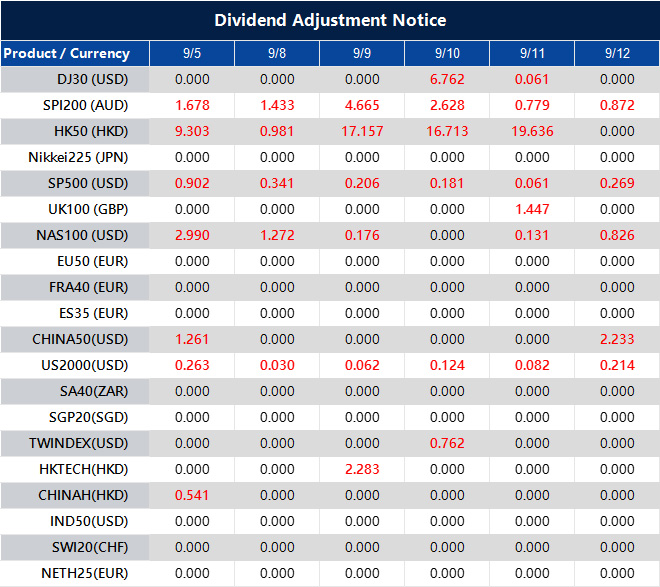
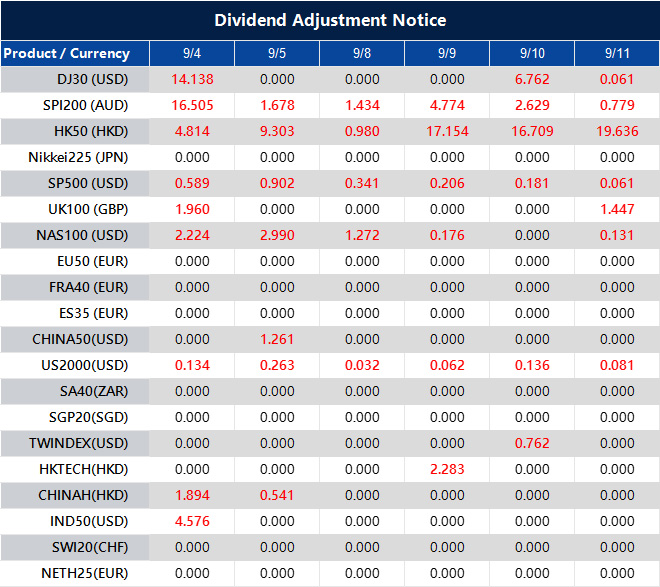
Please note that the dividends of the following products will be adjusted accordingly. Index dividends will be executed separately through a balance statement directly to your trading account, and the comment will be in the following format “Div & Product Name & Net Volume”.
Please refer to the table below for more details:
The above data is for reference only, please refer to the MT4/MT5 software for specific data.
If you’d like more information, please don’t hesitate to contact info@vtmarkets.com.
Written on September 8, 2025 at 8:35 am, by anakin
Markets diverge: weak US labour data lifts rate cut bets, a probe into Fed Governor Cook adds uncertainty, and Trump hits Japan with new tariffs. The UK and Europe track political risks as Russia eyes a fuel export ban. Gold demand climbs, Nasdaq tightens crypto rules, and tech focus falls on Nvidia’s China chips and DeepSeek’s year-end launch.
KEY INDICATORS
Markets and commodities
Dollar Index rebounds, up 0.15% to 98.29.
US Treasury yields decline across the curve; 10-year at 4.162%, 2-year at 3.598%.
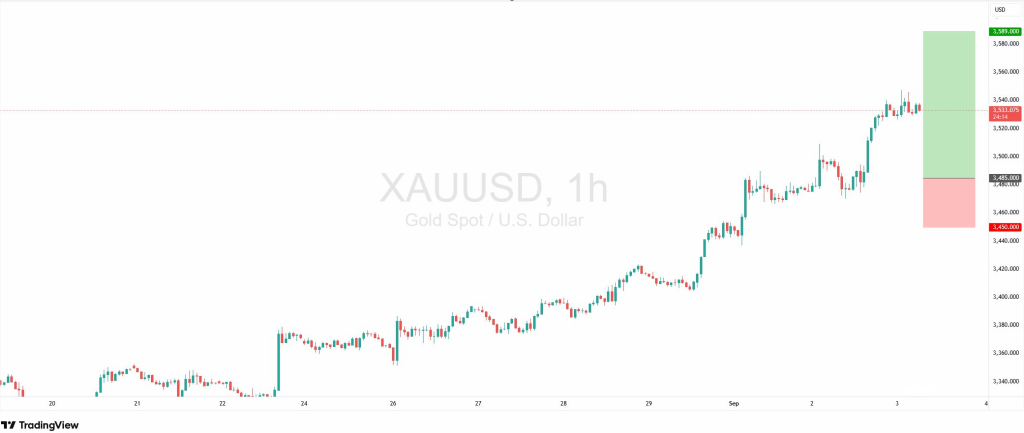
Gold ends seven-day rally, down 0.38% to $3,545.78/oz.
Silver slips below $41, down 1.32% to $40.67/oz.
WTI down 0.76% to $63.07; Brent down 0.88% to $66.69.
Global equities
US stocks rally; Dow +0.77%, S&P 500 +0.83%, Nasdaq +0.98%.
Tesla +1%, Intel +2%, while C3.ai falls over 7%.
Nasdaq Golden Dragon China Index down 1.1%; Alibaba -4%, NIO -3%.
European stocks mostly higher; DAX +0.74%, FTSE 100 +0.42%, Euro Stoxx 50 +0.41%.
Central banks and data
The Bank of Japan will hold a market operations meeting on 16 October.
The Bank of England seeks feedback on plans to strengthen gilt repo market resilience.
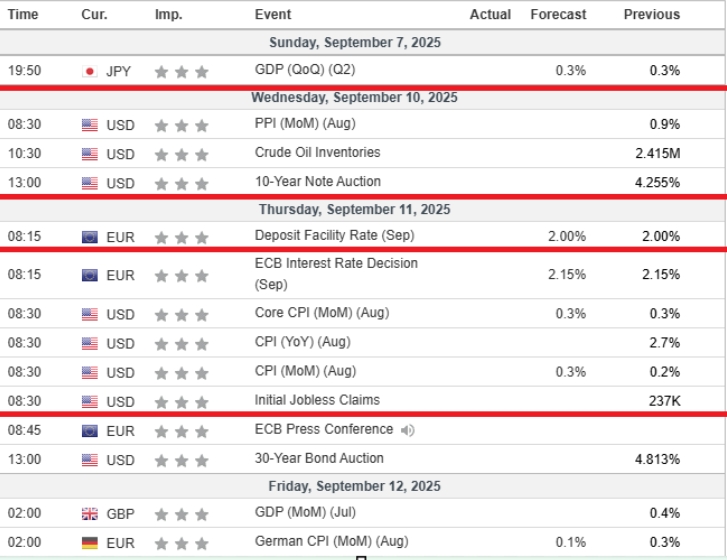
The European Central Bank will decide on interest rates on 11 September, with inflation and growth in focus.
Federal Reserve officials’ commentary ahead of the next FOMC meeting remains crucial.
US CPI on 11 September is the main inflation gauge for Fed expectations.
US PPI on 10 September offers an early signal of producer inflation.
US jobless claims remain a key labour market stress indicator.
University of Michigan consumer sentiment on 12 September is a key gauge of confidence.
Europe and the UK face ongoing debates on fiscal risks and bond yields.
MARKET MOVERS
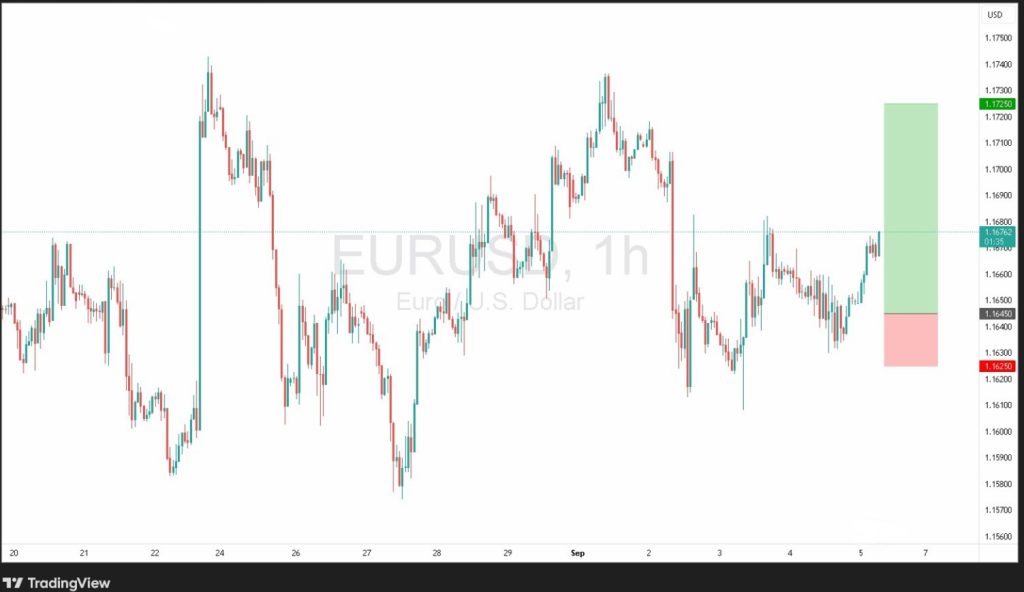
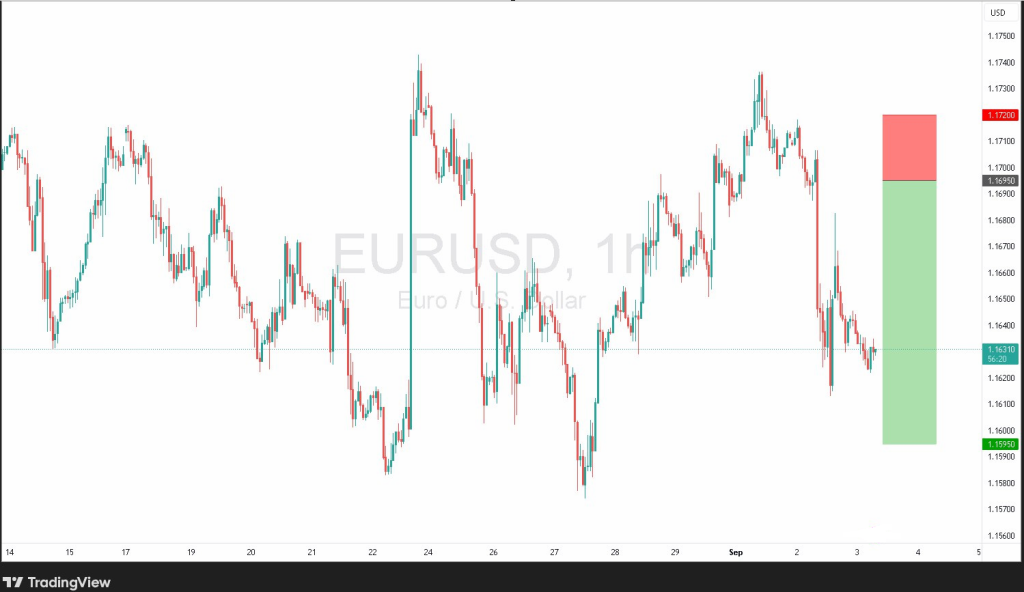
EUR/USD
Primary trend: Bullish, with pullbacks likely to find support before buyers return.
Support level: 1.1645 (secondary: 1.1660)
Resistance zone: 1.1725 (secondary: 1.1740)
Long strategy: Enter longs near 1.1645 support, target 1.1725 initially, extend towards 1.1740, stop-loss below 1.1645.
Short strategy: Consider tactical shorts on rallies into 1.1725–1.1740 resistance, target 1.1660 initially, extend back to 1.1645 if momentum stalls.
Range trade: Buy dips near support and sell rallies near resistance if price consolidates between 1.1645–1.1740.
Risk management: Keep stops tight given the prevailing bullish bias.
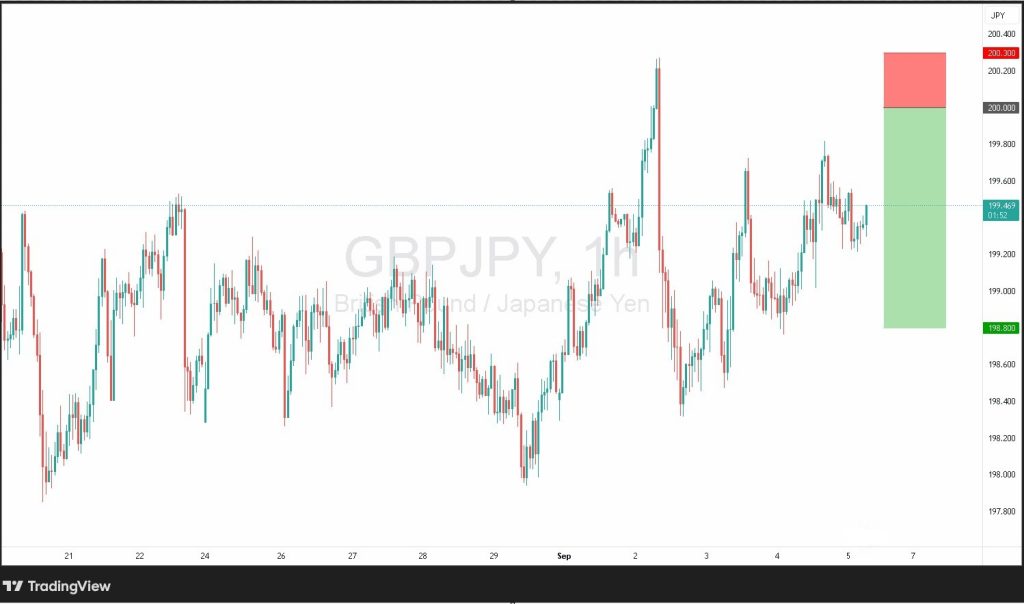
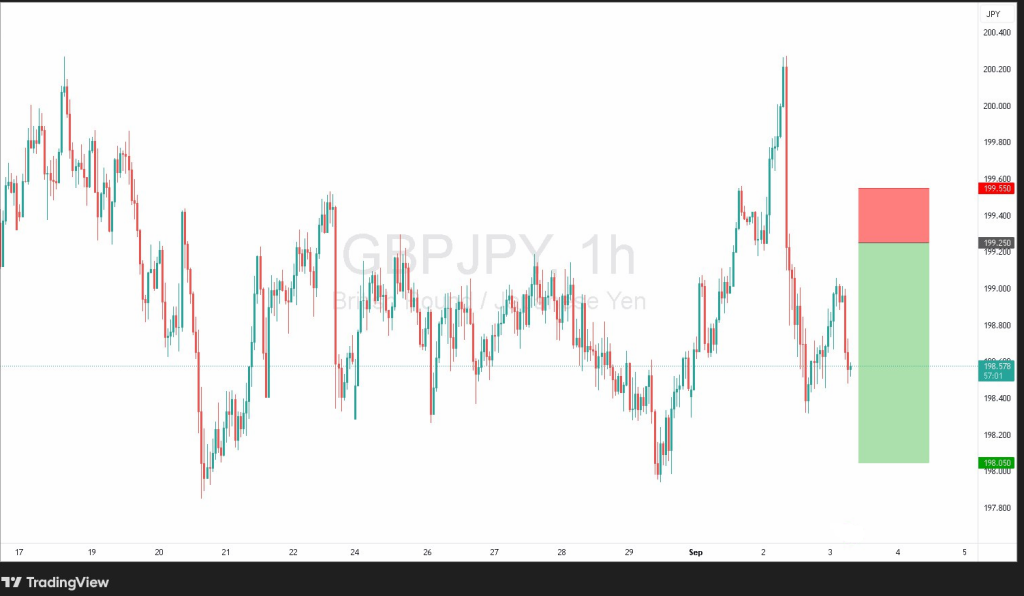
GBP/JPY
Primary trend: Broadly bullish, but weakening momentum signals risk of near-term reversal.
Support level: 198.8 (secondary: 198.5)
Resistance zone: 200.0 (secondary: 201.0)
Long strategy: Enter longs only if price holds above 198.8 support, target 200.5 initially, extend towards 201.0, stop-loss below 198.8.
Short strategy: Sell into rallies near 200.0 resistance, target 198.8 initially, extend back to 198.5 if momentum stalls, stop-loss above 200.0.
Range trade: Buy dips near support and sell rallies near resistance if price consolidates between 198.5–200.0.
Risk management: Keep stops tight given the potential for a breakout.
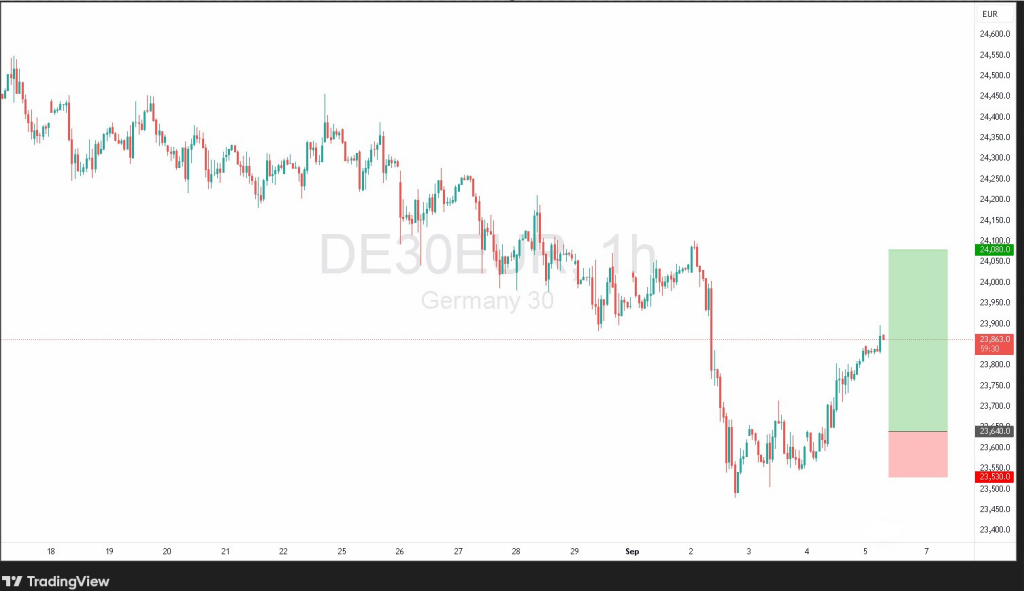
DAX 40
Primary trend: Bullish, but current levels limit the risk/reward profile.
Support level: 23,640 (secondary: 23,800)
Resistance zone: 24,080 (secondary: 24,150)
Long strategy: Enter longs on dips near 23,640 support, target 24,080 initially, extend towards 24,150, stop-loss below 23,640.
Short strategy: Consider tactical shorts if rallies stall near 24,080–24,150 resistance, target 23,800 initially, extend back to 23,640 if momentum stalls, stop-loss above 24,150.
Range trade: Buy dips near support and sell rallies near resistance if price consolidates between 23,640–24,150.
Risk management: Keep stops tight given the prevailing bullish bias.
NEWS HEADLINES
US developments
ADP jobs report shows 54k in August, below the 65k expected, while jobless claims rise to 237k, the highest since June.
The Justice Department launches a criminal probe into Federal Reserve Governor Cook over a mortgage case.
Fed nominee Milan says the central bank should not be under presidential control.
Fed’s Williams warns of rising labour market risks and supports gradual rate cuts.
Nasdaq will tighten scrutiny of listed firms’ cryptocurrency investments.
Elon Musk will skip Trump’s White House tech CEO dinner.
Global trade and politics
Trump signs an order imposing 15% tariffs on nearly all Japanese goods under a new trade deal.
Norway holds parliamentary elections on 8 September, with implications for regional stability and energy policy.
The UN General Assembly opens on 9 September as a key diplomatic forum.
Macron is expected to avoid a snap election if PM Bayrou loses a confidence vote.
Political risks in the Eurozone continue to weigh on sentiment.
The Chinese yuan gained ground on Friday as improved sentiment in domestic markets, and a softer US dollar offered support. With traders balancing expectations around US jobs data and monitoring signals from Beijing, the currency remains at the centre of attention in global forex markets.
Dollar weakness lifts yuan momentum
The Chinese yuan posted modest gains on Friday in both onshore and offshore trading, supported by a rebound in domestic equities and a softer US dollar.
A surge in Chinese equities is stoking bullish sentiment toward the yuan, raising prospects of a virtuous cycle where gains in one asset class reinforce confidence in the other https://t.co/r7TDYWKuze
According to market observers, fading regulatory concerns helped lift Chinese stocks, which in turn created positive momentum for regional assets.
The People’s Bank of China (PBoC) also contributed to the yuan’s strength by setting the daily reference rate at 7.1064 – well above market forecasts. The offshore yuan (USD/CNH) mirrored this move, trading near 7.1334 by midday in Asia.
Meanwhile, the broader dollar weakened ahead of the highly anticipated US non-farm payrolls (NFP) release later in the day, a report that could heavily influence expectations for Federal Reserve policy.
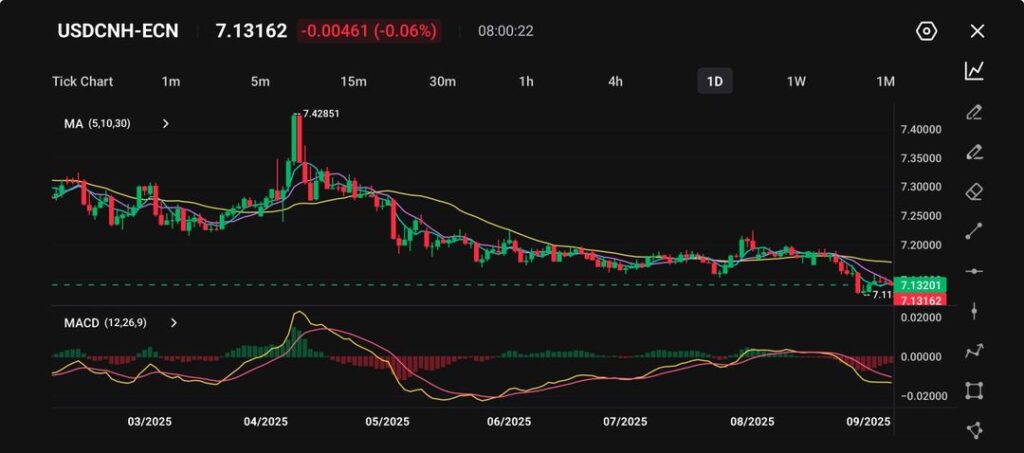
Technical analysis
The USD/CNH pair is currently trading around 7.13, slipping 0.06% and extending the gradual decline that began after April’s peak near 7.43.
The currency pair remains close to the 7.11 support area, maintaining a steady downtrend. Short-term moving averages (5, 10, 30) are aligned bearishly, pointing to sustained selling pressure. In addition, the MACD remains negative, underlining continued downside momentum.
Picture: USDCNH-ECN trades at 7.1316, edging down 0.06% from its recent level, with support near 7.11 as seen on the VT Markets app.
A clear break below 7.11 could expose the next support level around 7.05. On the upside, initial resistance is located at 7.20, followed by 7.25 – levels that would need to be reclaimed for any shift back towards bullish sentiment.
For now, the technical setup stays bearish, with traders remaining alert to policy signals from Beijing as well as upcoming US economic data that may influence capital flows and yuan stability.
Cautious outlook
Should the NFP report show weaker-than-expected job growth, the US dollar may come under additional pressure, opening the door for USD/CNH to test the 7.10 area.
Conversely, a strong or hawkish outcome from the US labour data could stall further yuan appreciation, particularly against a backdrop of ongoing macroeconomic uncertainty in China.
In this case, the currency pair may consolidate within its current range as investors reassess both Federal Reserve policy direction and China’s domestic economic resilience.
Market participants will also be watching closely for further PBoC guidance, as the central bank’s daily fixings remain a critical driver of sentiment.
Combined with signals from Chinese authorities on growth measures and fiscal support, these factors will likely determine whether the yuan can sustain its current strength or face renewed selling pressure in the weeks ahead.
Please note that the dividends of the following products will be adjusted accordingly. Index dividends will be executed separately through a balance statement directly to your trading account, and the comment will be in the following format “Div & Product Name & Net Volume”.
Please refer to the table below for more details:
The above data is for reference only, please refer to the MT4/MT5 software for specific data.
If you’d like more information, please don’t hesitate to contact info@vtmarkets.com.
Written on September 5, 2025 at 8:28 am, by anakin
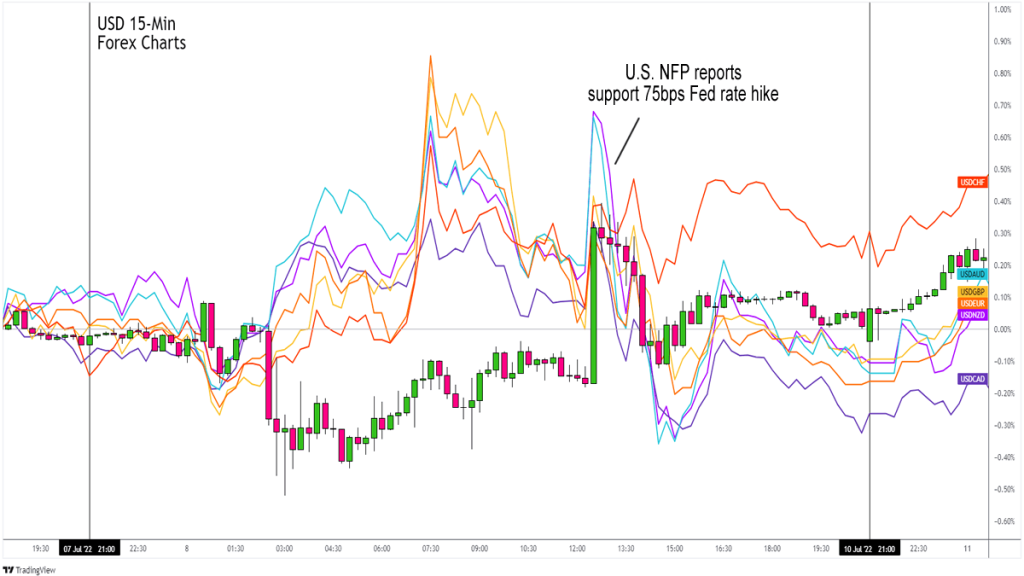
What if a single report could open the door to trading opportunities in just minutes? This Friday, 5 September 2025, the US Non-Farm Payrolls (NFP) release could spark sharp market moves – creating volatility that rewards traders who are ready.
Jobs data shows how the US economy is performing and guides the Federal Reserve on interest rates, making NFP a key driver for the US dollar, stocks, bonds, and commodities such as gold and oil.
Last month, July’s report added only 73,000 jobs [link: https://www.bls.gov/news.release/empsit.nr0.htm], well below earlier expectations. The miss weakened the US dollar and fuelled speculation that the Fed may cut rates sooner than anticipated.
This Friday’s release could be just as pivotal. Here’s what to watch – and how you can prepare.
Understanding NFP
NFP measures how many new jobs were created in the US economy during the previous month, excluding farm work, the military, and certain government roles.
Strong job creation suggests businesses are expanding, consumers are spending, and the economy is running hot – which may keep rates higher for longer. Weak job growth often signals slowdown risks and opens the door to cuts.
Think of NFP as a monthly health check on the US economy. If the results surprise, the patient’s heartbeat suddenly changes – and markets react in seconds.
Breaking down the report: Key metrics to watch
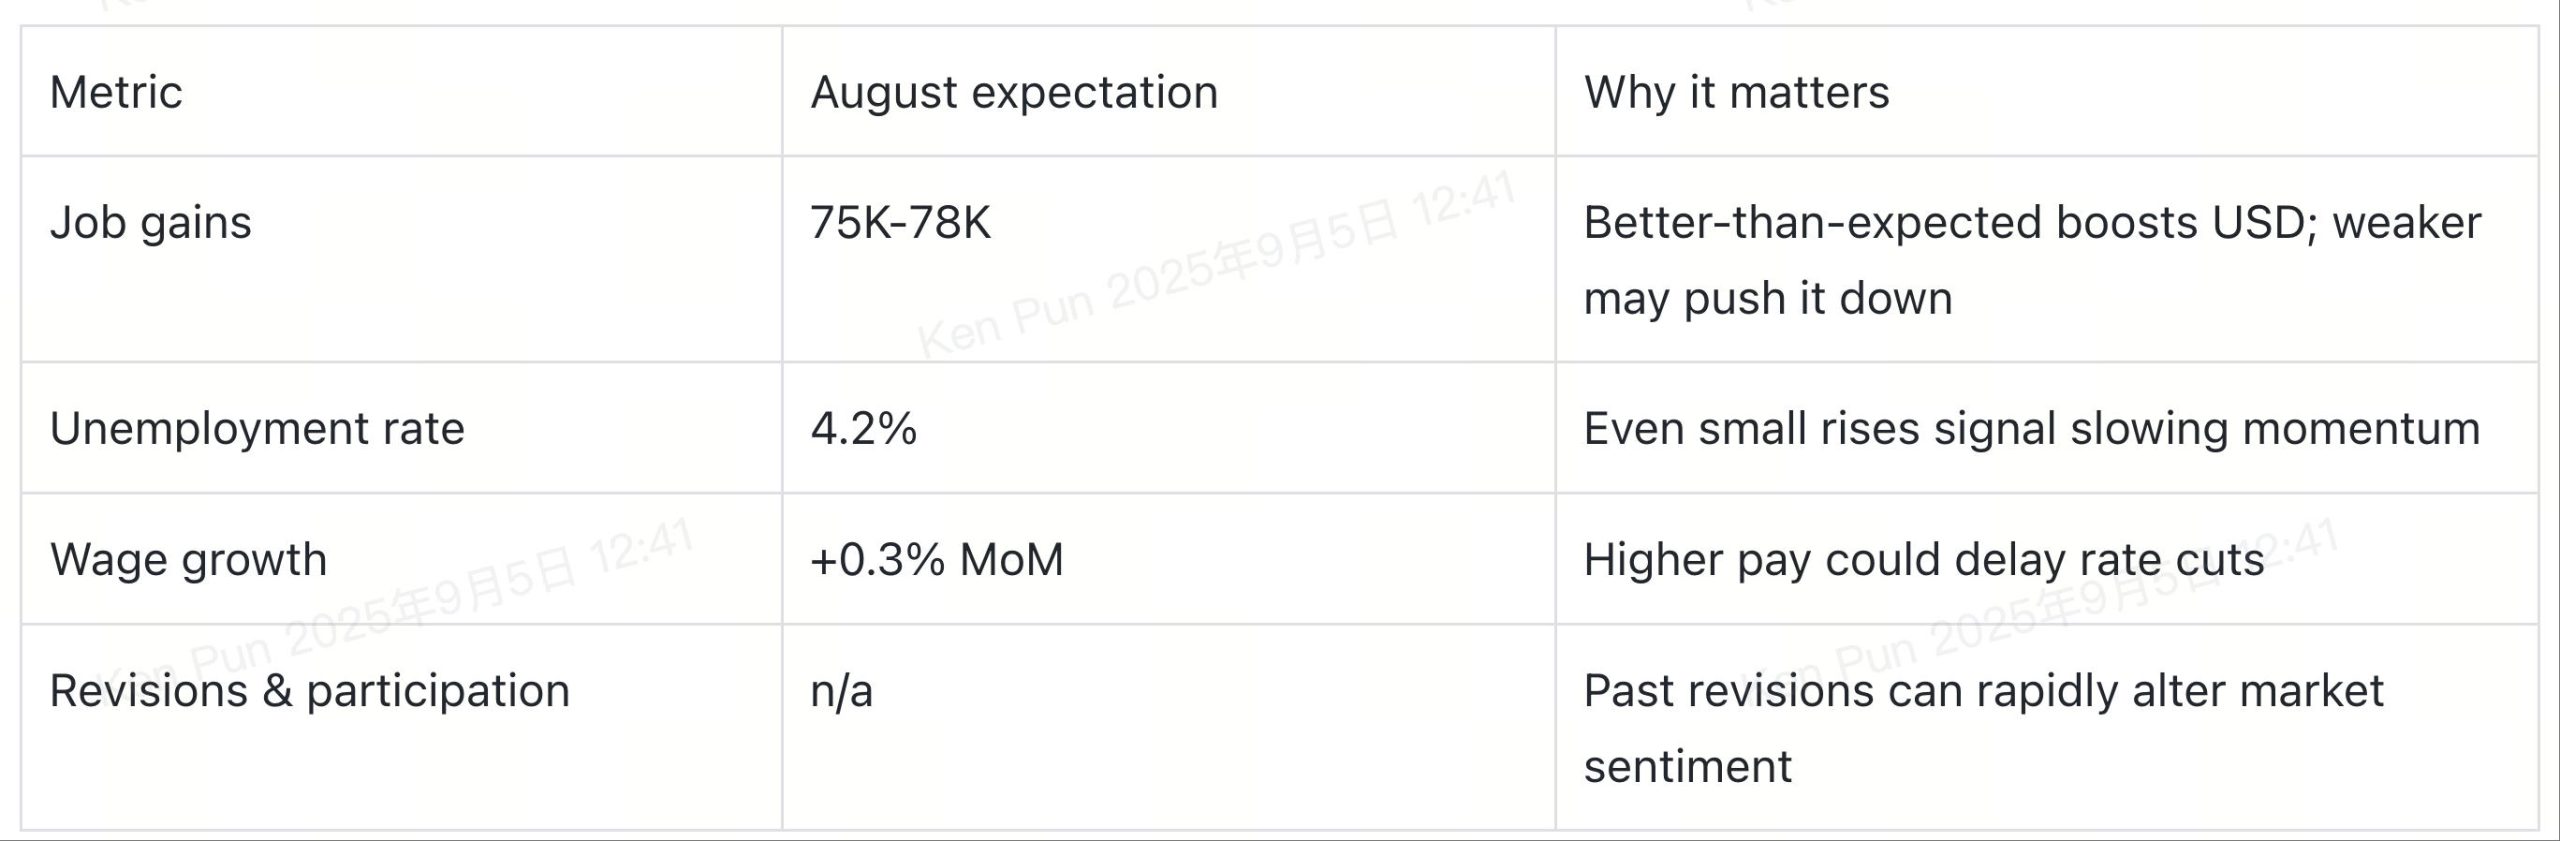
Traders look beyond the headline figure – here’s what really matters this Friday:
Headline job gains: Consensus forecast is 75,000–78,000 jobs. This continues the slowdown seen in July (73,000) and remains well below early-year levels, showing that the labour market is losing momentum. A strong upside surprise (e.g., 120,000+) could lift the US dollar, while a print under 50,000 might trigger market concern.
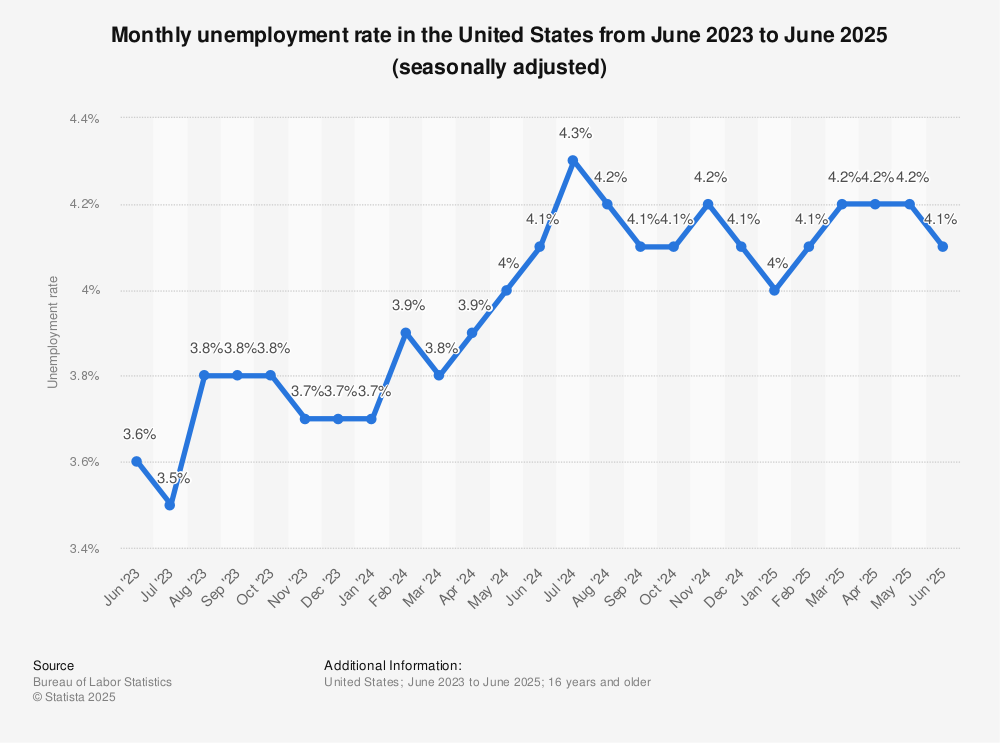
Unemployment rate: Expected to remain at 4.2%, steady with July. Even small changes can influence market sentiment.
Average hourly earnings: Forecasted monthly increase is 0.3%, consistent with July. On a yearly basis, wages have risen around 3.9%. Stronger pay growth could signal inflation risks, potentially delaying Fed rate cuts.
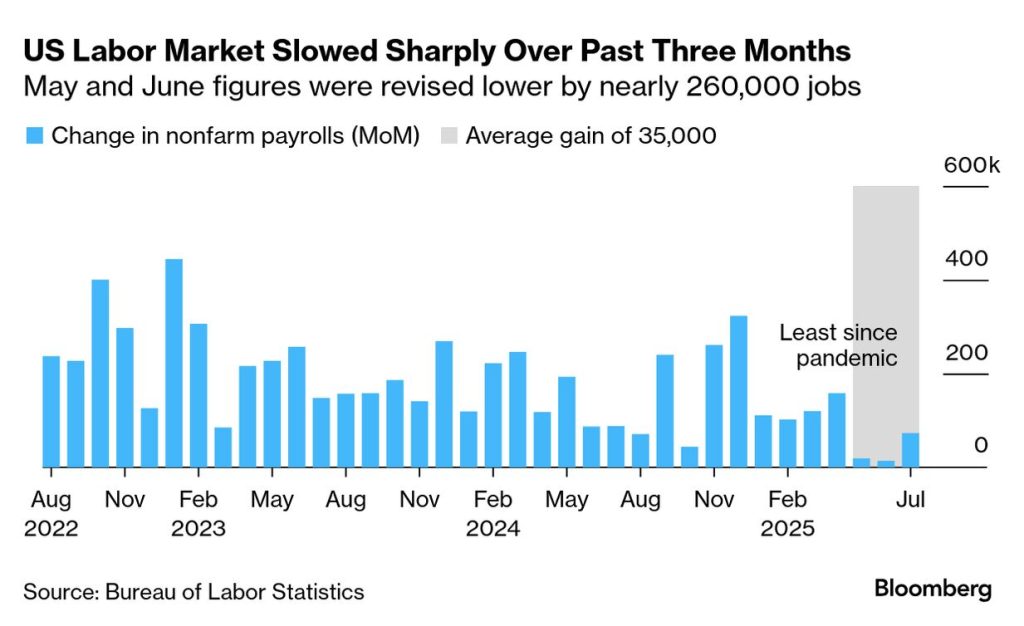
Revisions to past data: Recent reports have seen large downward adjustments, for example, July’s revisions to May and June combined for 258,000 fewer jobs than initially reported. These revisions can move markets unexpectedly.
Labour force participation rate: Trending stable or slightly lower over the past year; July’s rate was 62.2%. Even subtle shifts can affect how unemployment figures are interpreted.
Key numbers at a glance
Market reactions to watch US dollar (USD): A strong jobs print (100K+) would likely support the dollar, especially against currencies like the euro and yen. A weak result could add to selling pressure. Bonds: Yields typically rise on strong job growth as markets price in tighter Fed policy, while a weak report pushes yields lower and fuels rate-cut bets. Shares: Stock markets often cheer weak jobs numbers if they boost rate-cut hopes. However, if the slowdown looks too sharp, concerns about corporate earnings could take over. Gold: Traditionally a safe haven, gold often rises on weak jobs data as traders price in lower yields and a softer dollar. A stronger-than-expected NFP could drag it lower. Oil: Jobs data influences growth expectations and energy demand. A weak labour report may cap oil prices, while stronger hiring could offer support.
How to prepare with VT Markets Volatility around NFP is often sharp but short-lived, making preparation essential. With VT Markets you can: Stay informed with our live Economic Calendar and instant market news. React quickly on our lightning-fast platforms designed for execution speed. Trade flexibly with access to forex, indices, commodities, and other markets – all impacted by the NFP. Manage risk using advanced tools such as stop-loss and take-profit orders. The key is timing: the faster you see the data and execute, the better you can capture opportunities or protect positions.
Stay ready, trade the NFP The US NFP release is more than just an economic update – it’s a catalyst for volatility and opportunity. With forecasts pointing to another soft jobs report, the stage is set for potential market swings that traders can use to their advantage. Be ready this Friday, 5 September, with VT Markets’ tools at your fingertips.
Oil markets remain caught between supply uncertainty and demand signals, leaving traders on alert for the next move. Speculation around OPEC+ production policy, upcoming US stockpile data, and shifting global consumption trends are all shaping sentiment, keeping volatility alive and market direction unclear.
Traders on edge ahead of OPEC+ talks
Oil prices moved lower in Thursday’s early trading session as market participants positioned cautiously before the upcoming OPEC+ policy meeting.
West Texas Intermediate (WTI) slipped 1.0% to $63.32 per barrel, while Brent crude dropped 0.9% to $66.96, wiping out the previous day’s gains.
The pullback followed a Reuters report indicating that the group could weigh further production increases. Even without an official decision, the possibility of more barrels hitting the market unsettled traders.
Uncertainty remains high, particularly with the US Energy Information Administration (EIA) due to release its weekly stockpile data later today. Investors are keen to see whether demand from the world’s top oil consumer can offset the renewed supply-side risk.
Technical analysis
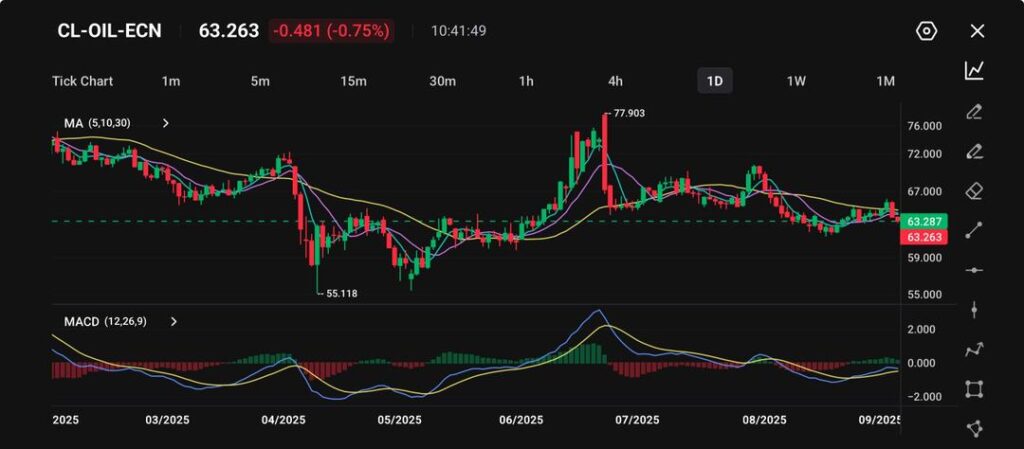
Crude oil (CL-OIL) is trading at $63.26, down 0.75% on the session, and consolidating after a volatile year. In April 2025, prices dipped as low as $55.11 before surging to $77.90 in July.
Since then, the market has traded in a broad range, with the 30-day moving average flattening and shorter-term averages (5 and 10) struggling to maintain upward momentum – signalling hesitation.
Picture: CL-OIL-ECN trades at 63.263, down 0.75% from its recent level as shown on the VT Markets app.
The MACD shows a mild bullish crossover but remains close to neutral, pointing to limited strength. Key support is placed at $60, with a deeper cushion at $55, while resistance levels stand at $67 and $72.
A sustained breakout above $67 could unlock fresh bullish momentum, whereas a decline below $60 would increase the risk of revisiting the yearly low.
In the short run, prices are expected to remain range-bound, with traders monitoring OPEC+ supply decisions, US inventory data, and broader demand recovery trends.
Cautious forecast
Unless OPEC+ steps in to temper supply expectations, crude oil may remain under pressure as the week draws to a close.
A bearish EIA report showing another surprise build in US stockpiles could pull WTI closer to the $60 handle, amplifying downside risks.
On the other hand, a bullish or dovish report indicating stronger demand could provide a temporary rebound – but traders may treat any recovery with caution given the looming policy risks.
Beyond the immediate data releases, sentiment will continue to hinge on OPEC+ strategy in Vienna, as well as global demand signals from key importers such as China and India.
Currency fluctuations, geopolitical headlines, and broader risk sentiment in financial markets could also influence price direction. For now, the oil market appears locked in a fragile balance, vulnerable to both policy shifts and macroeconomic surprises.
Please note that the dividends of the following products will be adjusted accordingly. Index dividends will be executed separately through a balance statement directly to your trading account, and the comment will be in the following format “Div & Product Name & Net Volume”.
Please refer to the table below for more details:
The above data is for reference only, please refer to the MT4/MT5 software for specific data.
If you’d like more information, please don’t hesitate to contact info@vtmarkets.com.
Written on September 4, 2025 at 9:13 am, by anakin
What if a single economic release could trigger sharp market moves in just minutes? This Friday, 5 September 2025, the US Non-Farm Payrolls (NFP) report will do exactly that. Known for shaking markets, the NFP is one of the most closely watched indicators in the world – and a key driver of the US dollar, stocks, bonds, and commodities such as gold and oil.
Last month’s release showed that only 73,000 jobs were added, far below expectations. That shortfall weakened the dollar and fuelled speculation that the Federal Reserve may cut interest rates sooner than markets previously thought. With August’s numbers about to land, traders are once again bracing for volatility.
So, what should you look for this time – and how can you prepare?
Why the NFP matters for traders
The Non-Farm Payrolls report measures how many jobs were created in the US economy during the previous month, excluding agricultural work, the military, and certain government roles.
Think of it as a monthly health check on the world’s largest economy. Strong job growth suggests businesses are hiring, consumers are spending, and momentum is strong – conditions that can keep interest rates higher for longer. Weak numbers signal slowing activity, raising the chances of rate cuts.
Markets often respond within seconds of the release. A strong upside surprise can boost the dollar and push bond yields higher. A weak print can have the opposite effect, sparking rallies in gold or even stocks if traders expect easier monetary policy ahead.
Numbers that really move markets
While the headline job creation figure grabs attention, seasoned traders know that several other components can be just as important. Here are the main ones to watch this Friday:
Job gains
Economists expect between 75,000 and 78,000 new positions. This would confirm the slowdown seen in July and keep the labour market well below early-year levels. If hiring surprises to the upside – say, 120,000 or more – it could give the US dollar fresh strength. A print below 50,000, however, might trigger renewed concern about the economy.
Unemployment rate
Forecast to remain steady at 4.2%. Even small changes matter because they show whether job seekers are finding work. A rise to 4.3% would suggest slack is building, while a dip would show resilience.
Wage growth
Average hourly earnings are expected to climb by 0.3% month on month, with annual growth near 3.9%. Faster wage growth means households have more money to spend, but it also raises inflation risks. That could make the Federal Reserve cautious about cutting rates too quickly.
Revisions to past data
In recent months, previous figures have been sharply revised downwards. For instance, July’s report cut earlier estimates for May and June by a combined 258,000 jobs. These revisions can shift market perception instantly – sometimes more than the new numbers themselves.
Labour force participation
July’s figure stood at 62.2%, broadly stable over the past year. Even slight movements here can change how the unemployment rate is interpreted. If participation falls, a steady unemployment rate might mask underlying weakness.
How markets may react
Different markets respond in different ways, and the reactions are often immediate:
US dollar (USD): Strong jobs data usually lifts the dollar; weak numbers weigh on it.
Bonds: Yields rise on strong hiring, fall on weak reports.
Shares: Stocks cheer modest weakness (rate-cut hopes) but drop if slowdown looks severe.
Gold: Gains on weak jobs data and a softer dollar; falls on strength.
Oil: Stronger hiring supports demand outlook; weaker data caps prices.
For example, in April 2025, a strong NFP print above 200,000 boosted the dollar and pushed gold down more than 2% in one day. In July, weak numbers triggered the opposite move – gold rallied while the dollar fell.
How to prepare for NFP day
For traders, the challenge with NFP is not just understanding the numbers but also reacting quickly. Market moves are often sharp yet short-lived, which means preparation is essential.
Here are some practical steps:
1. Stay informed: Keep an eye on VT Markets’ Economic Calendar for real-time updates. This ensures you don’t miss the release time or forecasts.
2. Use fast platforms: Execution speed can make all the difference during NFP volatility. VT Markets’ platforms are designed to help you react instantly.
3. Diversify your approach: The NFP doesn’t just affect currencies. With VT Markets, you can access forex, indices, commodities, and more – all of which can move when the data is released.
4. Manage your risk: Tools like stop-loss and take-profit orders allow you to set boundaries in advance. That way, you can protect your account from unexpected swings while keeping the chance to capture opportunities.
Imagine you are trading the EUR/USD. If the NFP comes in stronger than expected, the US dollar could rise sharply, pushing EUR/USD lower. Without a stop-loss, a sudden drop could erode your position quickly. With a stop-loss in place, you can limit your downside while leaving room to benefit if the report surprises the other way.
Turning volatility into opportunity
The US Non-Farm Payrolls report is more than a routine piece of data – it is a monthly catalyst that can set the tone for global markets. With forecasts pointing to another modest increase in jobs, expectations are already leaning towards a softer labour market. That means any surprise, whether stronger or weaker, could send ripples across currencies, bonds, shares, and commodities.
For traders, the opportunity lies in preparation. By knowing which numbers matter most, anticipating potential market reactions, and having the right tools at your fingertips, you can turn this event into a chance to capture new opportunities – or protect your positions.
Volatility brings both risks and rewards. This Friday, 5 September, stay ready with VT Markets and make sure you don’t miss the moves that NFP can bring.
Written on September 4, 2025 at 8:32 am, by valerie
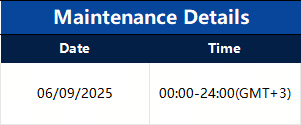
As part of our commitment to provide the most reliable service to our clients, there will be maintenance this weekend.
Maintenance Details:
Please note that the following aspects might be affected during the maintenance:
1. The price quote and trading management will be temporarily disabled during the maintenance. You will not be able to open new positions, close open positions, or make any adjustments to the trades.
2. There might be a gap between the original price and the price after maintenance. The gaps between Pending Orders, Stop Loss, and Take Profit will be filled at the market price once the maintenance is completed. It is suggested that you manage the account properly.
3. During the maintenance period, VT Markets APP will not be available. It is recommended that you avoid using it during the maintenance.
4. During the maintenance hours, the Client portal will be unavailable, including managing trades, Deposit/Withdrawal and all the other functions will be limited.
The above data is for reference only. Please refer to the MT4/MT5 software for the specific maintenance completion and marketing opening time.
Thank you for your patience and understanding about this important initiative.
If you’d like more information, please don’t hesitate to contact info@vtmarkets.com.
Written on September 4, 2025 at 8:26 am, by anakin
Political and economic risks are shaping sentiment across global markets. US tariffs and Fed scrutiny fuel uncertainty, UK gilts rally as sterling weakens, while Japan and Turkey grapple with political instability. In Argentina, authorities step in to support the FX market amid pressure on bonds and the peso.
KEY INDICATORS
Dollar strength driven by US yields
DXY +0.66% to 98.327, marking its first gain in six sessions.
Long strategy: Consider tactical longs only if price breaks and holds above resistance with strong follow-through; target 200.00, stop-loss below 199.25.
Short strategy: Sell into rallies near 199.25 resistance; target 198.05 initially, extend back to 197.80 if momentum stalls; stops above 200.00.
Range trade: Buy near support and sell near resistance if price consolidates between 197.80–199.25.
Risk management: Keep stops tight given weakening bullish momentum.
NEWS HEADLINES
Global market and policy updates
Trump to hold emergency meeting on tariffs on Wednesday; Supreme Court appeal expected, with risk of tariff withdrawal and refunds if the ruling goes against him.
Federal Reserve Governor Cook under scrutiny as his declared primary residence is reportedly being let to tenants.
US regulators ease financial oversight, reducing the frequency of bank stress tests
UK 30-year gilt yield hits highest level since 1998; sterling slides on fiscal concerns.
Russia and the US to hold diplomatic consultations, Kremlin aide confirms.
Corporate and regional developments
Nvidia announces 2026 GTC conference to be held in San Jose, 16-19 March.
US judge rules Google is not required to divest Chrome or Android.
Japan’s Prime Minister Ishiba apologises after LDP election loss, as party officials consider resignations.
India to launch commercial semiconductor production by end-2025.
India’s tax board proposes raising EV tax on mid-range models from 5% to 18%.