Going Long vs Going Short: The Key Difference?

Long Position vs Short Position: A Comprehensive Guide 

In the trading world, understanding the difference between going long and going short is crucial for navigating markets effectively. These strategies form the foundation of trading across various asset classes, such as stocks, commodities, and forex. Whether you’re a beginner or an experienced trader, grasping these concepts will help you make informed decisions and maximize potential profits. In this article, we’ll explain the key differences between long and short positions and how to open them for success in the markets.

What is a Long Position?

A long position involves buying an asset with the expectation that its price will rise. When traders go long, they are betting that the market or asset will increase in value. The goal is to buy low and sell high, profiting from the price increase.

To open a long position, the trader buys the asset at the current market price with the intention of selling it later at a higher price. If the price increases as expected, the trader can sell the asset at a higher price and pocket the difference as profit.

However, if the market moves in the opposite direction and the asset’s price falls instead of rising, the trader faces potential losses. In this case, the trader will have to sell the asset at a lower price than the purchase price, resulting in a loss.

Example:

A stock trader opens a long position on Meta, buying 1,000 shares at $500 each. Over the next few months, Meta’s stock rises to $550 per share. The trader then sells the shares at $550, making a profit of $50 per share. With 1,000 shares, the total profit is $50,000. The trader profits by buying at a lower price and selling at a higher price.

What is a Short Position?

A short position involves borrowing an asset, such as stock, and selling it with the expectation that its price will fall. Traders go short to profit from a price decline by selling the asset at a high price and buying it back at a lower price later.

To open a short position, the trader borrows the asset from a broker and sells it at the current market price. If the price decreases as expected, the trader can buy back the asset at the lower price, return it to the lender, and keep the difference as profit.

However, if the market moves in the opposite direction and the price of the asset rises instead of falling, the trader faces potential losses. In this case, the trader will have to buy back the asset at a higher price to return it to the lender, leading to a loss.

Example: 

A stock trader opens a short position on Amazon, borrowing 1,000 shares and selling them at $200 each. Over the next few months, Amazon’s stock falls to $150 per share. The trader then buys back the shares at $150, making a profit of $50 per share. With 1,000 shares, the total profit is $50,000. The trader profits by selling at a higher price and buying back at a lower price.

The Key Difference Between Long Position and Short Position

Understanding the key differences between long and short positions is essential for traders. While both strategies aim to profit from market movements, they differ significantly in how they function and the risks involved. Below is a comparison between a long position and a short position:

AspectLong PositionShort Position
Market ExpectationExpecting the price to riseExpecting the price to fall
Action TakenBuy the asset at the current priceBorrow and sell the asset at the current price
Profit ScenarioProfit if the price rises above the purchase priceProfit if the price falls below the selling price
Risk of LossLoss if the price falls below the purchase priceLoss if the price rises above the selling price
Potential for LossLimited to the amount invested (if the price falls to zero)Unlimited (price can rise indefinitely)

How to Open a Long or Short Position

To successfully navigate the markets, understanding how to open both long and short positions is essential. Below are the steps to follow for each, helping you execute your trades effectively:

Step 1: Understand Long and Short Positions

Before placing a trade, it’s crucial to understand the differences between long and short positions. A long position profits from price increases, while a short position profits from price declines.

Step 2: Open a Live Account or Demo Account

To start trading, open an account with a regulated broker like VT Markets. You can begin with a demo account to practice trading strategies risk-free or open a live account when you’re ready to trade with real money.

Step 3: Decide to Go Long or Short

Based on your market analysis, choose whether to go long (buy) or short (sell) on the asset you’re interested in. Your decision should be based on whether you expect the price to rise or fall.

Step 4: Implement Risk Management Strategies

Use risk management tools like stop-loss orders, take-profit orders, and position sizing to protect your capital. These tools help limit potential losses and secure profits.

Step 5: Monitor and Stay Informed

Regularly track your positions and stay informed about market conditions. Keeping up with relevant news and events is essential to adjust your strategies and make informed decisions.

When Should You Go Long or Short in Trading?

Deciding when to go long or short depends on your market outlook and the conditions you’re analyzing. Each strategy works best under specific circumstances:

Go Long: A long position is ideal when you believe the asset’s price will rise. Typically, you would go long in a bullish market, where positive news, strong earnings reports, or overall market sentiment suggest growth. If you’re confident that an asset will appreciate over time, opening a long position can help you capitalize on that upward movement.

Go Short: A short position is best when you anticipate that the asset’s price will decline. This is suitable for bearish markets, where negative news, poor earnings, or a general downturn in the market signals a price drop. If you believe the asset is overvalued or facing downward pressure, shorting can allow you to profit from the price decrease.

Understanding market trends, staying informed about news events, and using technical indicators can help you determine the right time to take either position.

Conclusion

Understanding when to go long or short is crucial for successful trading. Both long and short positions offer opportunities to profit from market movements, but they require careful analysis of market conditions. A long position is ideal when you expect the price of an asset to rise, while a short position is suitable when you believe the price will fall. By choosing the right strategy based on market conditions, you can optimize your trading approach and increase your chances of success.

Start Trading Today with VT Markets

If you’re ready to start trading and put your knowledge of long and short positions to the test, VT Markets offers an intuitive platform that supports both MetaTrader 4 and MetaTrader 5. These popular trading platforms provide powerful tools, real-time market analysis, and automated trading options. Whether you’re looking to go long or short, VT Markets gives you the flexibility and resources to trade across a wide range of assets, including stocks, forex, commodities, and more.

Sign up today to begin your trading journey and explore diverse trading opportunities with VT Markets.

Frequently Asked Questions (FAQs)

1. What is a long position?

A long position refers to buying an asset with the expectation that its price will rise. Traders go long when they believe the asset will appreciate over time, allowing them to sell it at a higher price to make a profit.

2. What is a short position?

A short position involves borrowing an asset and selling it with the expectation that its price will fall. Traders go short when they believe the asset will decrease in value, allowing them to buy it back at a lower price for a profit.

3. What is the difference between a long and short position in simple terms?

A long position involves buying an asset with the expectation it will rise, while a short position involves selling an asset you don’t own, with the expectation it will fall.

4. How do I open a long position in trading?

To open a long position, you need to buy the asset at the current market price, expecting its price to rise. Once the price increases, you can sell the asset for a profit.

5. How do I open a short position in trading?

To open a short position, you must borrow the asset from your broker, sell it at the current market price, and buy it back later at a lower price, hoping to profit from the price decline.

6. What happens if a short position goes wrong?

If the asset price rises instead of falling, you will have to buy back the asset at a higher price, incurring a loss. Since the price can rise indefinitely, short selling carries potentially unlimited risk.

7. How do I know when to go long or short in trading?

A long position is best when market conditions suggest rising prices, such as strong earnings or bullish news. A short position is ideal when the market shows signs of falling prices, such as weak earnings or bearish sentiment.

8. Can I trade long and short positions at the same time?

Yes, you can trade both long and short positions at the same time, especially if you’re employing strategies like hedging or pair trading. This approach allows you to manage risk and take advantage of different market movements.

Dividend Adjustment Notice – Apr 15 ,2025

Dear Client,

Please note that the dividends of the following products will be adjusted accordingly. Index dividends will be executed separately through a balance statement directly to your trading account, and the comment will be in the following format “Div & Product Name & Net Volume”.

Please refer to the table below for more details:

Dividend Adjustment Notice

The above data is for reference only, please refer to the MT4/MT5 software for specific data.

If you’d like more information, please don’t hesitate to contact info@vtmarkets.com.

Forex market analysis: 15 April 2025

The US dollar is struggling to regain strength as markets react to mixed signals from Washington and growing expectations of interest rate cuts from the Federal Reserve. Recent policy reversals and investor shifts away from dollar assets have left the greenback on shaky ground, with confidence further dampened by global currency strength and economic uncertainty.

US dollar remains fragile amid policy uncertainty and investor shift

The US dollar showed limited stability in early Tuesday trading, lingering near multi-year lows after a turbulent week marked by abrupt shifts in tariff policy and a notable move away from dollar-denominated assets.

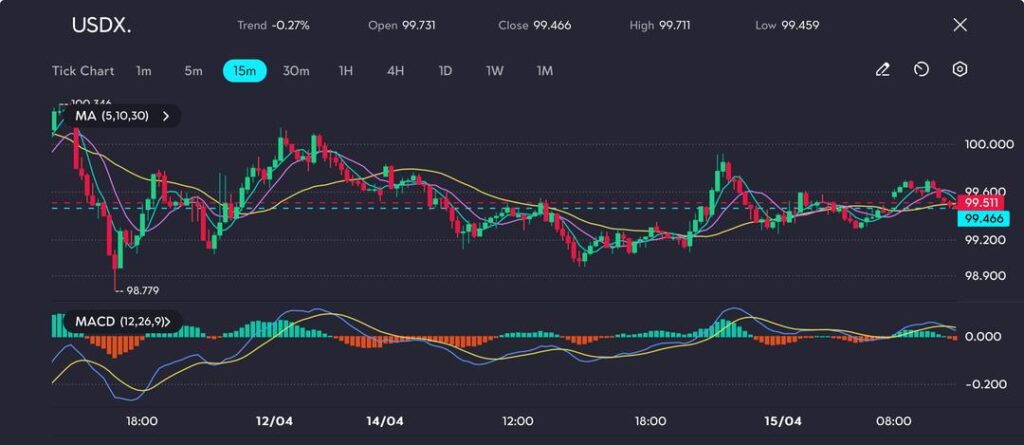
The US Dollar Index (USDX) settled at 99.466, down 0.27% on the day, following a sharp drop to its lowest level since July 2023. This occurred despite US Treasury yields touching their highest levels in two decades last week.

The primary pressure on the greenback stems from inconsistent signals out of Washington. Over the weekend, President Trump reversed course on a widely-criticised plan to implement broad-based import tariffs, opting to exclude several key Chinese consumer goods.

While markets initially viewed this as a relief, his comments implying the change might be short-lived introduced fresh uncertainty for traders.

Elsewhere, the Swiss franc surged to a 10-year high against the dollar last week, reflecting broader weakness. The euro and yen also held firm despite modest pullbacks.

The euro traded around USD 1.1324—just under its three-year peak of USD 1.1474—while the yen hovered at 143.53, slightly above Friday’s six-month low of 142.05.

Technical analysis: US Dollar Index stalls near key levels

Following a sharp drop to 98.779 on 12 April, the US Dollar Index has been consolidating in a narrow band. It has found temporary support in the 99.20–99.30 zone, but upside momentum remains limited, with 99.71 acting as a recent ceiling.

USDX stalls below 99.75 as bulls hesitate to reclaim lost ground, as seen on the VT Markets app.

The index has since slipped back to 99.46 and is currently fluctuating near a confluence of the 5-, 10-, and 30-day moving averages, highlighting market indecision.

Momentum indicators are showing mixed signals. The MACD histogram is flat, and the signal lines are congested near the zero level—indicating a lack of clear direction.

Unless a fresh catalyst emerges, the index may continue to range-trade, with price action capped below the psychologically significant 100.00 level.

A breakout above 99.75–99.80 could reignite bullish sentiment, whereas a move below 99.20 would likely expose the previous low at 98.77.

Federal Reserve hints at dovish shift

Further weighing on the dollar, Federal Reserve Governor Christopher Waller noted on Monday that recent tariff shocks might justify interest rate cuts—even if inflation remains elevated.

This underscores the complex balancing act the Fed faces between managing inflation and supporting economic growth.

Markets reacted quickly, pricing in 86 basis points of rate cuts for the remainder of the year, according to LSEG data.

Meanwhile, US bond yields stabilised, with the 10-year yield holding at 4.354%—following last week’s dramatic 50-basis-point spike, the largest since 2001.

However, analysts view this pause as temporary, given the ongoing shift from Treasuries to global alternatives.

Short-term outlook: Dollar exposed to further downside

With US policy direction unclear and the Fed signalling increased flexibility towards rate cuts, the dollar remains under pressure.

Key technical support for the USDX stands at 98.75, while resistance is capped around 100.20.

Should upcoming data—particularly retail sales and jobless claims—disappoint, the index may continue its downward trajectory, potentially revisiting levels last seen in mid-2022.

Click here to open account and start trading.

Forex market analysis: 14 April 2025

As the new trading week begins, investors are navigating a landscape shaped by recent market volatility following the introduction of new US tariffs. Today’s focus will be on inflation expectations, central bank commentary, and corporate earnings—all key drivers that could influence overall market sentiment.

KEY INDICATORS

US consumer inflation expectations (March)

  • The Federal Reserve Bank of New York is set to release its monthly survey, offering insights into consumers’ inflation expectations.
  • This data is crucial for gauging potential shifts in consumer behaviour and future monetary policy decisions.

Federal reserve speeches

  • Several Federal Reserve officials, including Patrick Harker and Raphael Bostic, are scheduled to speak.
  • Their remarks will be closely analysed for clues regarding the Fed’s stance on interest rates and the broader economic outlook.

International data releases

  • Japan: Reports on industrial production and capacity utilisation will offer insight into the health of Japan’s manufacturing sector.
  • Switzerland: The release of the Producer Price Index (PPI) will provide an update on inflationary pressures within the Swiss economy.

MARKET MOVERS

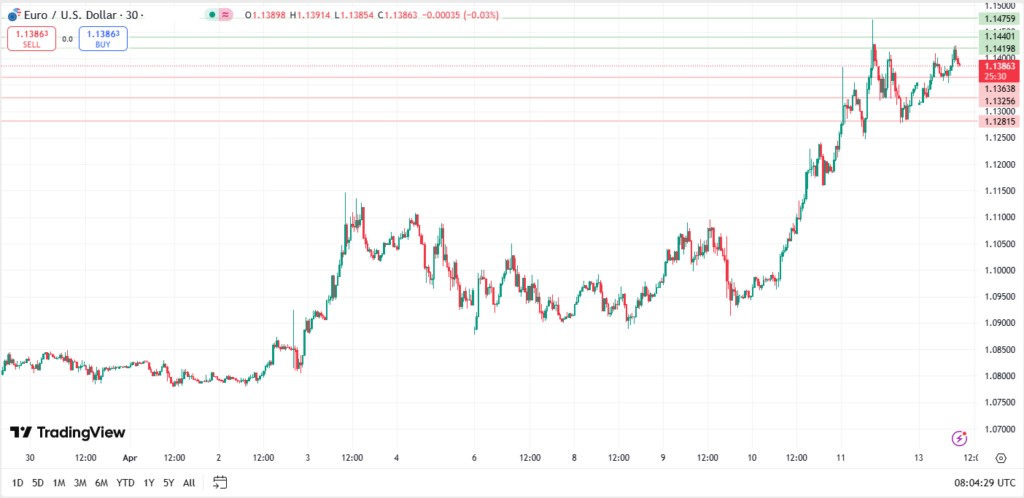
EUR/USD

Possible long preference

Long positions above 1.14198 with targets at 1.14401 and 1.14759 in extension.

Alternative scenario

Below 1.13638, look for further downside towards 1.13256 and 1.12815.

The RSI indicates further upside potential.

Asia FX weak with Chinese yuan down; dollar hits 3-year low amid brief tariff relief

Most Asian currencies weakened on Monday. The Chinese yuan remained fragile amid limited relief on US trade tariffs, while ongoing concerns over economic headwinds pushed the US dollar to a three-year low.

The Japanese yen outperformed, trading near its strongest level in six months as demand for safe havens remained high. The USD/JPY pair fell 0.3% to 143.09.

Chinese yuan dips as Beijing sets weak midpoint; trade data positive

  • The onshore USD/CNY pair rose 0.2% after another weak midpoint fix from the People’s Bank of China. The pair remained close to a 17-year high reached last week.
  • The PBOC has set a weaker midpoint in seven of the past eight sessions, with Beijing appearing to devalue the yuan to counteract steep US tariffs.
  • Last week, Trump hiked tariffs on China to a staggering 145%, with Beijing retaliating with 125% tariffs.

Gold prices dip from record highs amid some US tariff relief

Gold prices fell from record highs on Monday as risk appetite improved marginally following the US signalling some exemptions from steep trade tariffs against China, although sentiment remained largely cautious.

  • Spot gold fell 0.3% to USD 3,225.79/oz.
  • Gold futures expiring in June dropped 0.1% to USD 3,240.87/oz by 5:12 AM GMT.
  • Spot gold remained close to the record high of USD 3,245.69/oz reached last week.

Gold pressured by brief tariff relief as risk appetite recovers

  • Losses in gold came amid gains in risk-driven markets, with Asian stocks mostly rallying on Monday. US stock index futures also rose during Asian trading hours.
  • Beijing announced 125% retaliatory tariffs against the US in response to Trump’s latest move, showing little intention of backing down.
  • Platinum futures rose 0.8% to USD 951.90/oz.
  • Silver futures fell 0.3% to USD 31.827/oz.
  • Among industrial metals, copper futures on the London Metal Exchange steadied at USD 9,152.90 per tonne.

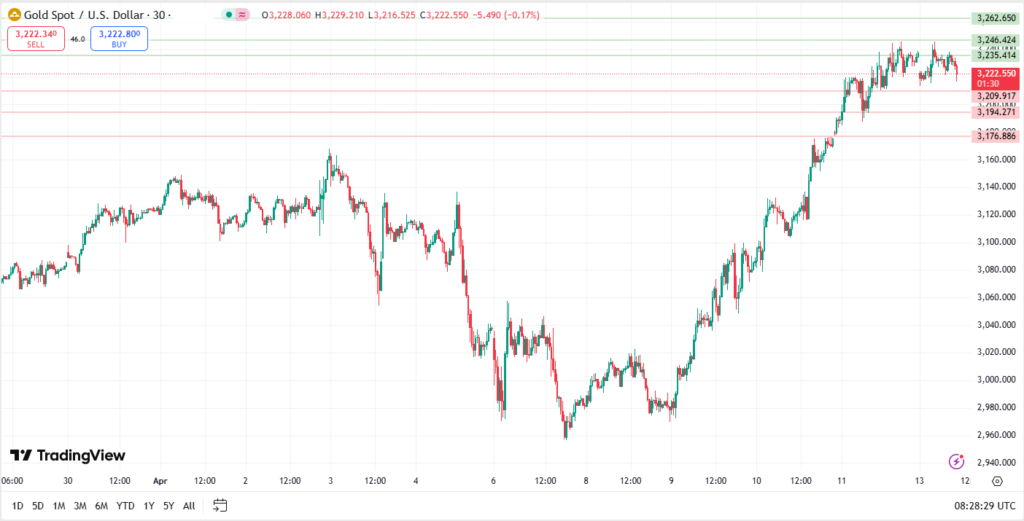
XAU/USD

Possible long preference

Long positions above 3,235.41 with targets at 3,246.42 and 3,262.65 in extension.

Alternative scenario

Below 3,209.91, expect further downside towards 3,194.27 and 3,176.88.

While further consolidation cannot be ruled out, it is expected to remain limited.

TODAY’S NEWS HEADLINES

Hong Kong shares rise over 2% to lead gains in Asia after Trump pauses tariffs on consumer electronics

  • Asia-Pacific markets climbed on Monday as US President Donald Trump paused tariffs on some consumer electronics, boosting risk sentiment.
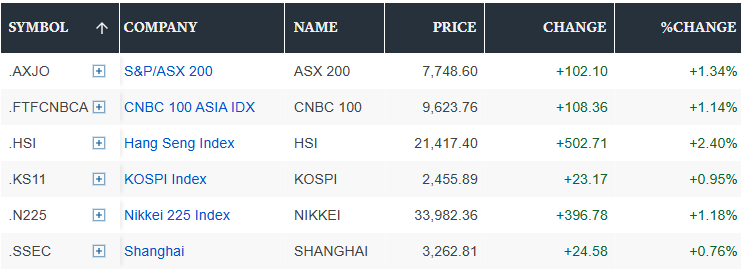
  • Hong Kong stocks led gains in the region, with the Hang Seng Index ending the day 2.4% higher at 21,417.40.
  • The Hang Seng Tech Index rose 2.34% to 5,015.12.
  • Mainland China’s CSI 300 increased 0.23% to close at 3,759.14.
  • Japan’s benchmark Nikkei 225 ended the day 1.18% higher at 33,982.36.
  • In South Korea, the Kospi index added 0.95% to close at 2,455.89.
  • Meanwhile, Australia’s S&P/ASX 200 rose 1.34% to close at 7,748.60.

Japan’s Nikkei jumps over 9% to lead gains in Asia after Trump pauses tariffs

  • Asia-Pacific markets rose on Thursday, following Wall Street’s biggest burst of buying since 2008, after US President Donald Trump announced a 90-day pause on higher tariffs for all nations except China.
  • US futures fell, even as Trump’s pledge to pause tariffs on some trading partners for 90 days spurred a massive surge on Wall Street.
  • Overnight in the US, the broad-based S&P 500 skyrocketed 9.52% to close at 5,456.90 — its biggest one-day gain since 2008.

European markets close lower as traders brace for Trump’s tariff plans

  • European markets closed lower on Wednesday as global traders braced themselves for a raft of fresh trade tariffs due to be announced by US President Donald Trump’s administration.
  • After rebounding on Tuesday, the regional Stoxx 600 index closed down 0.6%. Most sectors recorded declines, though retail and utilities stocks posted slight gains.
  • Germany’s DAX dropped 0.7%, while France’s CAC 40 was down 0.2%.
  • The UK’s FTSE 100 fell 0.3%.

Click here to open account and start trading.

Modifications on Leverage for Shares  – Apr 14 ,2025

Dear Client,

To provide a favorable trading environment to our clients, VT Markets will modify the trading setting of all Shares products. Please refer to the following details:

1. All US Shares products leverage will be adjusted to 20:1.

Modifications on Leverage for Shares

2. MT5 All Shares products: New positions opened within 30 minutes before market closing and after market opening will start with a leverage of 5:1. After the mentioned period, the leverage will be resumed to original leverage and will not be adjusted back to 5:1.

MT4 will not be affected.

Modifications on Leverage for Shares

The above data is for reference only, please refer to the MT4/MT5 software for specific data.

Friendly reminders:
1. All specifications for Shares CFD stay the same except leverage during the mentioned period.
2. The margin requirement of the trade may be affected by this adjustment. Please make sure the funds in your account are sufficient to hold the position before this adjustment.

If you’d like more information, please don’t hesitate to contact info@vtmarkets.com.

Dividend Adjustment Notice – Apr 14 ,2025

Dear Client,

Please note that the dividends of the following products will be adjusted accordingly. Index dividends will be executed separately through a balance statement directly to your trading account, and the comment will be in the following format “Div & Product Name & Net Volume”.

Please refer to the table below for more details:

Dividend Adjustment Notice

The above data is for reference only, please refer to the MT4/MT5 software for specific data.

If you’d like more information, please don’t hesitate to contact info@vtmarkets.com.

How to Find the Best Trading Platform for Day Traders in the UK

Discover the Best Trading Platform for UK Day Traders 

Day trading has rapidly gained traction in the UK, offering traders the chance to capitalise on short-term market moves. But in such a fast-paced environment, success hinges on the tools you use, starting with the best trading platform for day traders in the UK. In this article, we explain what day trading is, what makes a trading platform ideal, and how to compare the top options available.

What is Day Trading?

Day trading involves opening and closing financial positions within the same trading day, aiming to profit from short-term price movements. This strategy requires a solid understanding of technical indicators, real-time market updates, and most importantly, instant trade execution.

Example: A day trader in London used non-farm payroll (NFP) data to enter a EUR/USD position, closing it 12 minutes later with a £980 gain. Success was only possible with a fast, low-latency day trading platform and tight spreads.

What is a Day Trading Platform?

A day trading platform is the software or application that allows traders to analyse markets, execute trades, and manage risk—all in real-time. It’s your trading cockpit, and it must be optimised for speed, usability, and reliability.

To be considered the best trading platform for day traders, especially in the UK market, it should include:

  • Instant execution with minimal slippage
  • Competitive spreads and transparent costs
  • Powerful charting tools (e.g., MT4/MT5, cTrader)
  • Multilingual customer support
  • Access to a wide range of instruments and leverage
  • Regulated status for client protection

How to Find the Best Trading Platform for Day Traders in the UK?

Finding the best trading platform for day traders in the UK isn’t just about signing up with the most well-known provider. It’s about identifying the platform that aligns with your trading goals, preferred strategies, and risk tolerance. Here are the key steps to help you make the right choice:

1. Define Your Trading Goals and Strategy

Before selecting a platform, it’s important to understand how you want to trade. Are you scalping multiple times a day, or making just a few strategic entries? Do you rely on technical analysis or use economic news to guide your trades?

Your trading style should determine the tools you need. For example, scalpers need ultra-fast execution and one-click order placement, while technical traders may prioritise tools like trendlines, oscillators, and multi-timeframe views. News-driven traders, on the other hand, benefit from platforms with economic calendars and headline feeds.

Example: A trader using a 1-minute chart to scalp EUR/USD during overlapping market sessions will need a platform that executes trades in milliseconds, not seconds, to avoid slippage.

New to trading? Learn how to start trading for beginners.

2. Learn Key Day Trading Concepts

Understanding core market concepts is crucial before choosing your platform. Some terms you should be familiar with include:

Volatility: Volatility measures how much and how quickly an asset’s price moves within a specific time frame. For day traders, higher volatility means more frequent opportunities to profit from price swings, but also greater risk. Markets like XAUUSD or GBP/USD are typically volatile during news releases, making them ideal for short-term trades if paired with the right risk management tools.

Liquidity: Liquidity refers to how easily you can enter or exit a position without significantly impacting the asset’s price. Highly liquid markets, such as major forex pairs or stock indices, allow for faster execution and tighter spreads, crucial for day traders who rely on quick decisions. A good platform should connect to deep liquidity pools to minimise slippage.

Volume: Volume indicates how actively an asset is being traded and helps confirm the strength of a price move. High volume during breakouts or trend continuations suggests genuine interest and conviction in the market. Platforms that display real-time volume data allow traders to better time entries and avoid false signals.

A platform that offers volume analysis, economic calendars, and volatility indicators will better prepare you for real-time trading decisions.

3. Choose the Right Markets to Day Trade

The best trading platforms give you access to multiple asset classes, allowing flexibility across trading styles and conditions. Here’s a breakdown of the core markets day traders often focus on:

Forex: Forex trading is one of the popular markets for day trading, offering high liquidity, 24/5 access, and tight spreads. Traders typically focus on the major currency pairs, which include the most traded forex pairs like EUR/USD, GBP/USD, and USD/JPY. These pairs are ideal for strategies based on momentum, scalping, or news reactions.

Learn how to trade forex for beginners

Indices: Represent the performance of a basket of stocks and provide exposure to broader market movements. Indices such as the FTSE 100, S&P 500, and NASDAQ 100 are known for sharp intraday moves during market opens or economic data releases, perfect for trend or breakout traders.
Commodities: Include physical assets like gold (XAUUSD), crude oil, and silver. These markets are highly sensitive to geopolitical events and economic releases, often showing clean, tradeable patterns on technical charts.

Discover the most traded commodities worldwide

Stocks: Offer targeted exposure to individual companies. UK and US equities are often traded around earnings reports or corporate announcements. Stock CFDs enable both long and short positions without owning the actual shares.

A good day trading platform should also offer access to a wider range of financial instruments. VT Markets provides not only major asset classes but also ETFs, bonds, and others, giving traders greater flexibility to diversify and adapt to evolving market opportunities—all within one powerful, integrated platform.

4. Compare Platform Costs and Trading Fees

Day trading involves frequent position entries and exits, which means trading costs can quickly add up and eat into your profits. That’s why it’s essential to understand the different types of fees associated with each platform before committing. Here’s what to look for:

Spreads: The spread is the difference between the bid (sell) and ask (buy) price of an asset. Even a 0.1 pip difference can make a big impact when placing multiple trades per session. Platforms offering tight or raw spreads are better suited for active traders. Platforms that offer raw or tight spreads are ideal for scalpers or short-term traders who rely on precision entries.

Commissions: Some trading accounts operate on a commission model, where you’re charged a fixed fee per lot traded. This is often paired with lower spreads and can benefit high-volume traders looking for transparent, predictable pricing. Be sure to compare commission rates across brokers and assess how they align with your trade size and frequency.

Swap/ Overnight fees: If you hold a position past the market close, you may incur a swap or rollover fee. While most day traders close before end-of-day, knowing the potential charge helps in case a trade needs to be left open unexpectedly. Depending on the instrument, these can either be a cost or a credit.

5. Evaluate Platform Features and Tools

The quality and reliability of a trading platform’s tools can directly impact your results, especially for day traders who rely on speed, precision, and real-time insights. Here are the essential features to look out for:

Fast Execution: Instant order placement is crucial when reacting to intraday price movements. Delays during high volatility can cause slippage and missed opportunities, so platforms with low-latency infrastructure are a must.

Advanced Charting: Access to multiple chart types, timeframes, and technical indicators (like RSI, MACD, and moving averages) helps traders analyse trends, spot entry/exit points, and manage trades with confidence.

Risk Management Settings: Tools such as stop-loss, take-profit, and margin alerts are essential for controlling exposure and protecting your capital. These features should be easy to customise and execute within the platform.

Auto-Analysis Tools: Integrations like Trading Central or Autochartist offer automated pattern recognition, market insights, and actionable trade signals, helpful for traders who want data-backed setups without manual scanning.

Mobile Trading: In today’s market, flexibility is key. A well-optimised mobile app that syncs seamlessly with desktop or web platforms ensures you can monitor positions, adjust orders, and react to breaking news on the go.

VT Markets supports both MetaTrader 4 and MetaTrader 5, giving traders access to professional-grade tools that support technical analysis, automation, and flexibility across platforms.

6. Check Deposit and Withdrawal Options

Efficient deposit and withdrawal processes help ensure your capital is available when needed and that your profits can be accessed without unnecessary delays. Here are the key factors to consider:

Multiple Funding Methods: A good platform supports a variety of payment channels, such as credit cards, bank transfers, and e-wallets. This allows traders to choose the most convenient option based on their location and preferences.

Processing Speed: Deposits should be nearly instant, especially when using cards or digital wallets. Withdrawals should be processed within one to two business days to ensure timely access to funds.

No Unexpected Fees: Some platforms charge fees for withdrawals or have hidden conditions. Make sure the broker outlines all transaction costs clearly to avoid surprises.

VT Markets offers various deposit channels, a low minimum deposit of $50, with instant deposit options and free withdrawals depending on the method.

7. Review Customer Support Availability

In fast-moving markets, delays in getting help can lead to missed opportunities or unresolved issues. A strong support system is essential for day traders who need quick, accurate responses. Look for the following:

Customer Support: Ensure the broker offers reliable support, including 24/5 access via live chat, email, and phone, to assist during key trading hours and unexpected market events.

Multilingual support: Helpful for traders in different regions, particularly during peak UK and European market hours.

Educational resources: Includes a dedicated help centre, platform walkthroughs, FAQs, and video tutorials to support onboarding and self-guided learning.

8. Test the Platform Before Going Live

Before trading with real capital, it’s important to explore the platform in a risk-free environment. A robust demo account allows you to gain experience without financial risk. Here’s how:

Get familiar with the platform: Explore every part of the trading interface, including charting tools, order types, and account settings. This helps reduce the risk of operational errors when you begin live trading.

Practice your trading strategy: Use the demo environment to test different trading strategies and techniques under various market scenarios. Whether you’re developing a scalping approach or responding to economic news, it’s the ideal space to refine your methods.

Build confidence through repetition: Trading in real time, even with virtual funds, helps you practise discipline, improve timing, and manage emotions. Once you’re confident in your strategy and execution, switching to a live account becomes a more comfortable and informed transition.

VT Markets provides a free demo account with $100,000 in virtual funds, offering real-time pricing and functionality that closely mirrors live market conditions.

Comparison: Top Day Trading Platforms in the UK

To help you evaluate which is the best trading platform for day traders in the UK, here’s a detailed breakdown across key categories:

FeatureVT MarketsPepperstoneCMC MarketsCity Index
Regulated BrokerYesYesYesYes
Execution SpeedUltra-fastUltra-fastFastModerate
Minimum SpreadFrom 0.0 pipsFrom 0.0 pipsFrom 0.3 pipsFrom 0.5 pips
Customer Support24/5 Multilingual Live Chat & Email24/5 Global SupportUK Office + 24/5 HelpPhone & Email Support
Client Fund InsuranceSegregated Funds + Lloyd’s InsuranceSegregated Funds + Lloyd’s InsuranceSegregated Client FundsSegregated Client Funds
Leverage RangeUp to 1:500Up to 1:400Up to 1:30Up to 1:200
Key FeaturesMT4/MT5, copy trading, ultra-low latencyRazor accounts, cTrader, algo trading12,000+ instruments, advanced analysisTrading Central, user-friendly mobile platform

Learn how to become a day trader.

Key Takeaways

  • Choosing the best trading platform for day traders in the UK depends on aligning platform features with your trading goals, strategy, and preferred markets.
  • A high-quality day trading platform should offer fast execution, competitive costs, advanced charting, and strong risk management tools.
  • Look for access to a diverse range of financial instruments, including forex, indices, commodities, stocks, ETFs, bonds, and share CFDs.
  • Evaluate platform costs carefully, including spreads, commissions, and swap fees, as these can directly impact your trading performance.
  • Ensure the platform provides multiple deposit and withdrawal options, fast processing, and no hidden fees to maintain smooth capital management.
  • Reliable customer support and access to a comprehensive help centre with educational resources are essential for long-term trading success.
  • Practising with a demo account is a crucial step before going live, allowing you to build confidence, refine your strategy, and get familiar with the platform.

Start Day Trading with VT Markets Today!

Ready to take your day trading to the next level? VT Markets offers a professional-grade trading environment built for speed, flexibility, and performance. Whether you’re focused on forex, commodities, indices, or expanding into ETFs and bonds, our platform is designed to meet the needs of active traders.

With access to MetaTrader 4 and MetaTrader 5, ultra-fast execution, tight spreads from 0.0 pips, and a feature-rich demo environment to refine your strategy, VT Markets empowers day traders at every stage of their journey.

Open a VT Markets live account now and experience the edge of intelligent day trading today.

Frequently Asked Questions (FAQs)

1. What is the best trading platform for day traders in the UK?

The best trading platform for day traders in the UK offers fast execution, low spreads, access to key markets, and tools tailored to short-term strategies. VT Markets is a popular choice among day traders for its speed, precision, and range of instruments.

2. Can beginners use day trading platforms?

Yes, many platforms offer demo accounts and educational resources to help beginners learn. It’s recommended to start with a risk-free demo account to practise strategies and understand platform tools before trading live.

3. How important is execution speed for day trading?

Execution speed is critical. Day traders rely on entering and exiting positions quickly to capture small price movements. Platforms with ultra-low latency can help minimise slippage and maximise efficiency.

4. Can I day trade stocks and commodities on VT Markets?

Yes. VT Markets allows day trading across a wide range of CFDs, including stocks, indices, commodities like gold and oil, and other instruments such as ETFs and bonds.

5. How do I know if a trading platform is suitable for day trading?

Look for fast execution, access to volatile markets, advanced charting tools, and low trading costs. A free demo account is a great way to test a platform’s suitability before going live.

Week ahead: Trade risks and inflation to test markets

From 14 to 18 April 2025, key economic events are set to shape market dynamics. US–China trade tensions, evolving tariffs, and inflation data will drive investor sentiment. Central banks’ policy responses to these developments, along with growth forecasts, are also under scrutiny as markets adjust to potential risks and opportunities.

KEY INDICATORS

Policy developments: US–China tensions & global tariff manoeuvres

  • Trump expresses willingness to reach a deal with China, though total tariffs on Chinese imports have now reached 145%. Market concerns remain over escalating trade tensions.
  • China’s 2025 National Export Control Meeting emphasised strengthening export control enforcement, improving regulations, and boosting multilateral cooperation in response to growing global complexities.
  • The EU softens its stance by pausing retaliatory tariffs on the US for 90 days. President Ursula von der Leyen warned, however, that strong measures—possibly targeting US tech giants—will be deployed if talks fail.
  • The US Treasury reports March net tariff revenue at USD 8.2 billion, the highest since September 2022, driven by recent tariff hikes.
  • The EU and China begin negotiations on setting a minimum price for Chinese electric vehicles (EVs), potentially replacing previously imposed EU tariffs.

Macro data: Inflation, budget, and policy signals

  • US inflation unexpectedly cools: March CPI fell 0.1% month-on-month (first drop since May 2020), while core CPI rose 2.8% year-on-year—the smallest gain since March 2021.
  • The federal budget deficit shrinks to USD 161 billion in March, down 32% year-on-year, driven by a calendar adjustment in spending and rising tax revenues.
  • Markets are now pricing in 100 basis points of Fed rate cuts in 2025, but Fed officials remain cautious amid inflation uncertainty and trade-related risks.
  • Germany slashes its 2025 GDP growth forecast from 0.8% to 0.1%, citing trade policy impacts and weak domestic demand.
  • The EIA cuts its global oil demand forecast and oil price outlook: Brent crude is now expected to average USD 67.87 per barrel in 2025, down from USD 74.22.

Market reaction & capital flows: Risk-off sentiment returns

  • US equities retreat as trade tensions weigh heavily on sentiment despite temporary tariff postponements.
  • Emerging markets see a USD 17.1 billion capital outflow in March, the largest since August 2023, driven by tariff fears and global uncertainty.
  • The RMB exchange rate remains flexible, with SAFE highlighting China’s resilient FX market and capacity for self-correction.
  • BoE and RBA officials express uncertainty over the full impact of US tariffs on domestic inflation and monetary policy paths.

MARKET MOVERS

EUR/USD

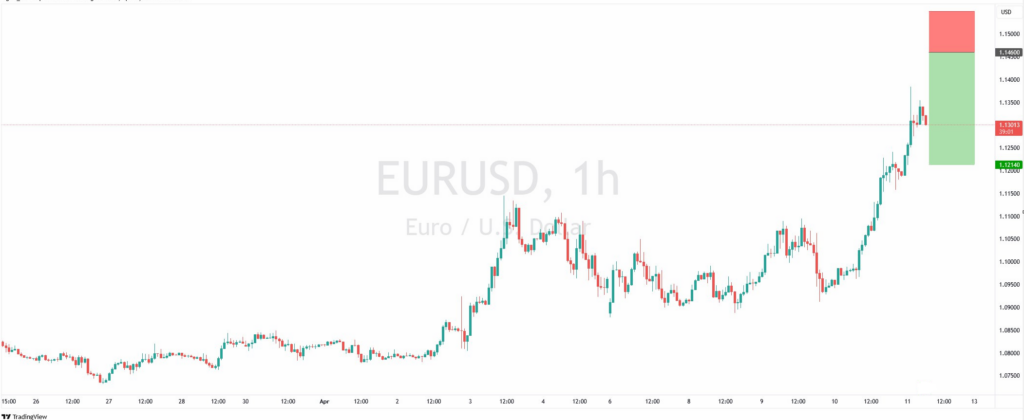
  • The pair extended its upward momentum from 1.0913, closing with solid net gains yesterday.
  • The previous resistance level at 1.1214 has been decisively breached.
  • A corrective pattern has emerged on the intraday chart, signalling potential short-term exhaustion.
  • Current price action is trading in overbought territory.
  • Selling into rallies presents a favourable risk/reward opportunity.
  • Custom support is identified at 1.0969.

Trade opportunity: Target 1: 1.1214 // Target 2: 1.0969.

USD/JPY

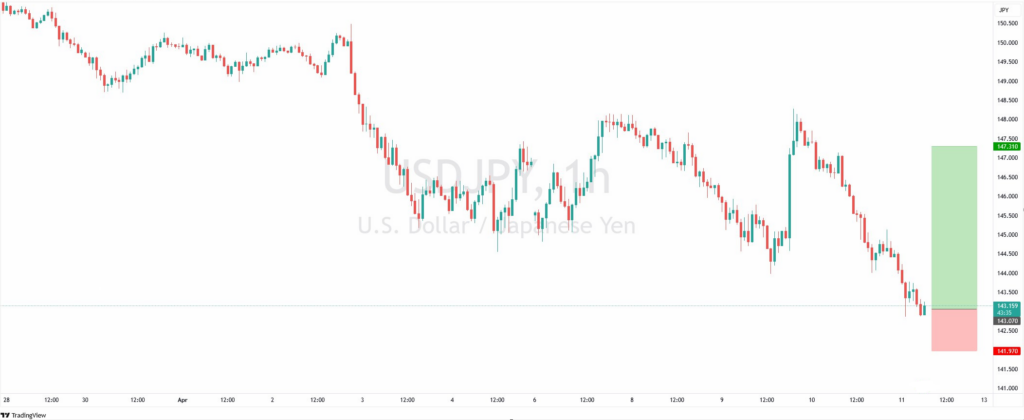
  • Persistent downward momentum from 151.21 led to net daily losses for the pair yesterday.
  • Selling pressure was evident during the Asian session.
  • A key Fibonacci confluence zone is identified at 143.07.
  • The recent sell-off has triggered a corrective structure on the intraday chart.
  • Custom resistance is seen at 147.31.
  • Buying into dips offers an attractive risk/reward profile.

Trade opportunity: Target 1: 147.31 // Target 2: 148.

DAX40

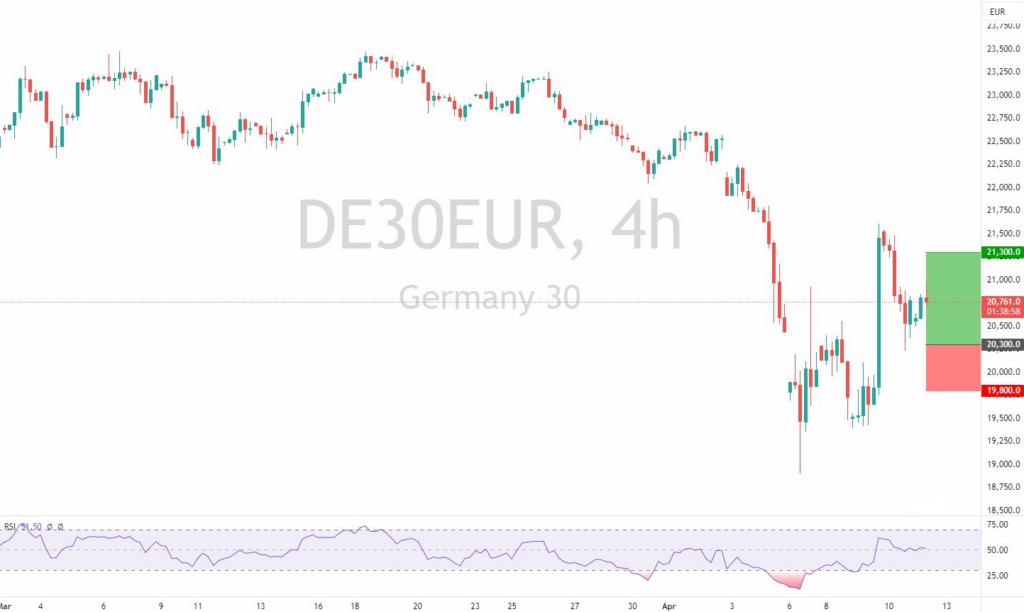
  • Prices are pushing higher, breaking out from a bullish flag/pennant pattern.
  • There are no clear signs that the rally is losing steam.
  • While our broader outlook remains bullish, a corrective pullback is possible and could unfold without disrupting the overall uptrend.
  • Initiating long positions at current levels offers a limited risk/reward profile.
  • A break above 20,750 would reaffirm bullish momentum.
  • The measured move target stands at 21,500.

Trade opportunity: Target 1: 21,300 // Target 2: 21,500.

NEWS HEADLINES

US dollar drops sharply, safe-haven currencies gain

  • US dollar saw a sharp sell-off, with the Dollar Index dropping 1.92 points (-1.87%) to 100.98, marking its largest single-day decline since 2022.
  • Safe-haven currencies, Japanese yen and Swiss franc, extended their gains against the greenback.
  • USD/JPY fell 333 pips (-2.26%) to 144.44.
  • USD/CHF dropped 339 pips (-3.96%) to 0.8237, its lowest level in a decade.
  • EUR/USD rose 251 pips (+2.30%) to 1.1200.
  • GBP/USD climbed 140 pips (+1.09%) to 1.2954.
  • AUD/USD advanced 68 pips (+1.11%) to 0.6219.
  • USD/CAD slipped 93 pips to 1.3991.

US equities retreat as tech stocks lead the decline

  • US equities surrendered some of Wednesday’s gains, with the Dow Jones Industrial Average falling 1,014 points (-2.50%) to 39,593, S&P 500 dropping 188 points (-3.46%) to 5,268, and Nasdaq 100 losing 801 points (-4.19%) to close at 18,343.
  • US inflation slowed to 2.4% YoY in March, down from 2.8% in February, but failed to sustain bullish momentum.
  • The 10-year Treasury yield edged higher by 2.9 basis points to 4.425%.
  • Mega-cap tech stocks retreated: Tesla (TSLA) -7.27%, Meta Platforms (META) -6.74%, Nvidia (NVDA) -5.91%, Apple (AAPL) -4.24%.
  • US Steel (X) plunged 9.46% after Donald Trump opposed its proposed sale to a Japanese buyer.
  • Ford Motor (F) declined 3.79% after Goldman Sachs downgraded its rating to “Neutral.”
  • Cruise-line stocks hit hard after Morgan Stanley cut price targets: Carnival (CCL) -10.25%, Norwegian Cruise Line (NCLH) -9.24%, Royal Caribbean (RCL) -8.11%.
  • European markets rebounded strongly from prior losses: DAX 40 +4.53%, CAC 40 +3.83%, FTSE 100 +3.04%.
  • Commodities mixed: WTI crude oil fell USD 2.28 (-3.66%) to USD 60.07 per barrel, and gold surged over 3% to reach a record high of USD 3,176.

Gold extends rally while USD/JPY weakens in Asian session

  • Gold extended its rally, climbing to USD 3,218.
  • EUR/USD surged to 1.1300.
  • GBP/USD rebounded to 1.3013.
  • USD/JPY continued to weaken, slipping to 143.65.

Click here to open account and start trading.

Forex market analysis: 11 April 2025

Crude oil prices are feeling the pressure again as global economic concerns take centre stage. With tensions flaring between the US and China, traders are growing more cautious about future demand. The mood across energy markets has shifted, as signs of slowing growth and trade disruptions raise doubts about whether oil consumption can hold steady in the months ahead.

Crude oil extends losses amid renewed US-China tensions

Crude oil prices continued to fall on Friday, closing out a second consecutive week of declines.

The renewed trade conflict between the US and China has sparked fresh concerns over a global economic slowdown, potentially leading to reduced demand for oil.

West Texas Intermediate (WTI) slipped by 0.6% to USD 59.71, while Brent crude dropped 0.5% to USD 63.02.

These losses followed a sharp downturn on Thursday, where both benchmarks shed more than USD 2 per barrel, deepening an overall 11% decline seen over the past two weeks.

Oil demand in question as global growth falters

Mounting worries about slowing global growth are fuelling fears of demand destruction. Daniel Hynes from ANZ highlighted that if global GDP growth dips below 3%, oil demand could contract by 1% — a scenario that now seems increasingly likely due to heightened tariff actions.

The US Energy Information Administration (EIA) has also downgraded its oil consumption forecasts for both domestic and global markets, citing worsening economic conditions.

Adding to the bearish sentiment, President Trump has imposed 145% tariffs on Chinese imports, while China has retaliated with an 84% levy on US goods.

These escalations between the world’s top two oil consumers are dampening trade volumes and destabilising supply chains, causing traders to price in a sustained drop in demand rather than immediate supply concerns.

Technical signals confirm bearish outlook

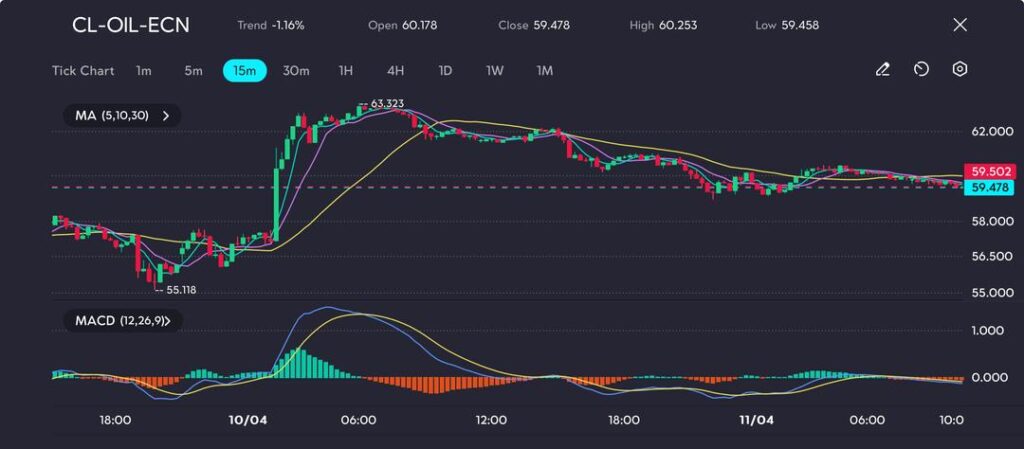
On the technical front, WTI crude (CL-OIL-ECN) has reversed sharply after peaking at USD 63.32, with sustained downward momentum now taking hold.

Crude pulls back from session highs, eyeing support at USD 59. MACD shows momentum is fading fast, as seen on the VT Markets app.

The MACD (12,26,9) has turned negative, and prices are trading below key moving averages (5, 10, and 30-day), reinforcing the bearish structure.

The recent high of USD 63.32 now serves as firm resistance. Prices are currently hovering around USD 59.48, with potential for a further drop toward the USD 58.00–55.00 support zone.

The MACD histogram remains in negative territory, signalling continued weakness and a lack of reversal signals.

Looking ahead, markets will closely watch OPEC+ statements, Chinese industrial production figures, and refinery data from the US.

Unless macroeconomic conditions improve significantly, crude oil is likely to remain under pressure, with limited potential for a strong recovery in the near term.

Click here to open account and start trading.

How to trade during Trump’s tariff storm

Seventy-eight days into Donald Trump’s second term, global markets are already rattled by his aggressive trade stance. From day one, the US has imposed a wave of tariffs, triggering a fresh and unpredictable trade war.

The financial world is now grappling with sharp asset declines, unusual alliances among major economies like Japan, China, and South Korea, and a surge in market volatility.

Traders face one of the most uncertain environments in recent memory. So, how do you navigate this tariff-fuelled chaos?

In this guide, we’ll break down how Trump’s tariffs are reshaping trading strategies, explore potential recession risks, and examine whether assets like Bitcoin might rebound. Let’s dive into what traders should watch — and how they can stay ahead.

Is it a good time to short US stocks and bonds?

US stocks: Market conditions and risks

As of April 2025, US equities are under heavy pressure. The S&P 500 has dropped by 21.3%, while the Nasdaq Composite is down 25.6% — both firmly in bear market territory.

While these levels often indicate recession, there have been exceptions (e.g. 1962, 1987, 2022). Still, the spike in the VIX — Wall Street’s volatility index — is sounding alarm bells.

On 7 April, the VIX hit 60.13 and closed at 46.93 the next day — levels not seen since the 2008 and 2020 crashes. This signals extreme market fear, typically observed near bottoms.

Yet history shows that while VIX spikes above 50 can lead to short-term rebounds, they don’t always prevent deeper declines. In 2008 and 2020, markets kept falling even after fear peaked.

Should traders short stocks now?

There could still be room for further downside. If recession fears escalate or corporate earnings disappoint, markets may slip lower. However, much of the negativity appears to be priced in already.

For traders, timing is everything — it’s wise to watch for signs of economic stabilisation or shifts in policy before holding onto short positions too long.

US bonds: A changing narrative

The outlook for US Treasuries has shifted, with the 10-year yield falling to around 4.0% — its lowest since October 2024.

This drop reflects a classic “flight to safety” amid growing recession fears. The yield curve remains inverted, with short-term yields above long-term ones — a pattern that has reliably preceded past recessions.

Should traders short bonds?

Shorting bonds looks increasingly risky. With investors flocking to safe assets, bond prices are rising and yields could fall even more. Unless inflation unexpectedly surges, the environment now favours long bond positions.

The likelihood of additional Fed rate cuts and moderate inflation expectations further reduce the appeal of bond shorts. A cautious, defensive bond strategy appears more suitable for current conditions.

Will there be a recession?

The risk of a US recession continues to climb, with several leading indicators flashing warning signs.

Key recession indicators:

  • Yield curve inversion: The 3-month Treasury yield has remained above the 10-year yield for months, with the gap widening to -50 basis points — a historically reliable recession signal.
  • Leading Economic Index (LEI): The LEI declined by 0.3% in January 2025, continuing a downward trajectory that suggests weakening economic momentum.
  • Unemployment: The US jobless rate has risen from 3.5% in 2023 to 4.1% — a significant increase that often precedes economic downturns.

Investment banks are raising their recession probabilities: Goldman Sachs now sees a 45% chance, while J.P. Morgan puts it at 60%. If trade tensions escalate further, those odds could increase.

Conclusion on recession

Although the data points to higher recession risk, a soft landing remains possible. Traders should monitor economic releases closely as we move through Q2 2025. While a shallow recession may be on the horizon, successfully navigating it will require agility and close attention to market signals.

Will Bitcoin recover to USD 100k?

Bitcoin’s recent price performance

In April 2025, Bitcoin (BTC) opened near USD 85,227 but slipped 13% to a low of USD 74,496. It has since rebounded slightly, trading around USD 80,858.

These moves are occurring against a backdrop of broad market uncertainty, and Bitcoin continues to show a strong correlation with traditional indices like the S&P 500.

Fundamentals and sentiment

Despite recent volatility, Bitcoin futures open interest remains robust, suggesting institutional players are still active.

Meanwhile, the M2 money supply is expanding, and stablecoin market capitalisation is on the rise — both signs of increasing liquidity. A growing supply of stablecoins may provide support for crypto assets going forward.

However, Bitcoin is still subject to macroeconomic trends, such as global risk appetite and economic policy shifts. While short-term pressure remains, the medium-term outlook could improve if liquidity continues to grow and risk sentiment stabilises.

Conclusion on Bitcoin recovery

Bitcoin’s path back to USD 100k may not be straightforward, but it remains plausible. As liquidity increases and global markets adjust to the new economic regime, there could be room for recovery.

Traders should track macro factors such as inflation, rate policy, and market volatility to assess when bullish momentum may return.

Final thoughts: Navigating tariffs and market volatility

Trump’s tariffs have reignited a global trade war and sparked exceptional market turbulence. Whether you’re trading stocks, bonds, or Bitcoin, the key is staying agile and informed.

Shorting may still offer opportunities — especially if recession risks deepen — but the landscape demands caution. With economic signals shifting and sentiment fragile, traders must manage risk wisely and avoid overexposure.

At VT Markets, we equip you with the tools, analysis, and support to navigate volatile markets confidently. Stay informed, stay prepared, and trade smarter — even in uncertain times.

Ready to take control of your strategy? Open a live account with VT Markets today and unlock smarter trading in volatile times.

Back To Top
server

Hello there 👋

How can I help you?

Chat with our team instantly

Live Chat

Start a live conversation through...

  • Telegram
    hold On hold
  • Coming Soon...

Hello there 👋

How can I help you?

telegram

Scan the QR code with your smartphone to start a chat with us, or click here.

Don’t have the Telegram App or Desktop installed? Use Web Telegram instead.

QR code