Dividend Adjustment Notice – May 07 ,2025

Dear Client,

Please note that the dividends of the following products will be adjusted accordingly. Index dividends will be executed separately through a balance statement directly to your trading account, and the comment will be in the following format “Div & Product Name & Net Volume”.

Please refer to the table below for more details:

Dividend Adjustment Notice

The above data is for reference only, please refer to the MT4/MT5 software for specific data.

If you’d like more information, please don’t hesitate to contact info@vtmarkets.com.

China permits 60 billion yuan from insurance funds for equities, aiming to enhance financial stability and confidence

China plans to increase long-term insurance fund investments in equities by an additional 60 billion yuan (US$8.3 billion). This adjustment is part of an expanded pilot programme to enhance participation in capital markets and is intended to improve financial stability and confidence.

Li Yunze, the leader of China’s top financial authority, disclosed the new measure in a press briefing. Additionally, the authorities are working on new strategies to stabilize the country’s struggling property sector.

Insurance Investment Scheme

The expanded insurance investment scheme is integral to current capital market reforms. Alongside anticipated property sector measures, this change is part of a broader policy strategy to bolster economic resilience against persistent growth and market challenges.

This article points to a fresh injection of long-term insurance capital into Chinese equities, totalling 60 billion yuan. It’s effectively a top-down move to prop up broader financial market confidence. Li says this adjustment is not isolated—it rolls into wider policy efforts aimed at making the economic system sturdier, especially at a time when both investors and institutions remain on edge. There’s also talk of interventions into real estate, which has weighed down China’s consumer sentiment and private investment.

From our perspective, what this means is that the authorities have decided to lean more heavily on institutional resources. Insurance funds, being typically conservative and long-view focused, offer a relatively low-volatility source of capital. We should read this pivot as a message—they’re not depending on short bursts of speculative retail activity, but rather encouraging more steady participation. The hope is that it might reduce major price swings in domestic equities and reinforce internal liquidity when outbound flows are still subject to international headwinds.

As traders in the derivatives space, this adds a clear indication of intent from regulators. More insurance money deployed in listed stocks makes a more stable base for the underlying instruments. This, in turn, may lift implied volatilities less than market activity would otherwise justify. So options premia may not expand in the way some would expect during macro-level uncertainty, because there’s this cushion effect built from institutional inflows.

Potential Market Impact

However, we can’t take it as a signal to relax our awareness. There is talk of further action on property markets, which haven’t yet bottomed out. Measures for that domain are pending, but there’s no guarantee of timing or scope. That risk continues to cast a shadow over banks, developers, and a wide range of indirectly linked shares. So while there may be equity support on paper, some sectors—like construction, steel, or consumer durables tied to housing—might still struggle to find genuine upside momentum.

Also, the fact that this is an expanded pilot implies earlier phases have seen enough satisfaction among policymakers to scale up. That means the original investments, smaller though they may have been, didn’t disrupt pricing or create dislocations. At the same time, derivative traders can interpret this as a cue that interventions of this style and size may recur. There’s now precedent for adding long-term capital systematically if activity levels sag or if valuations decouple from policy targets.

We would suggest mapping short-term positions more carefully to relevant index weightings. Insurers tend to favour stable dividend-providing companies—so that’s likely where the incremental buying pressure will land. Tech growth stocks or speculative counters may not benefit to the same degree. This makes selective hedging via sector-spread positioning a more attractive route than blanket puts or index shorts.

We should also remain ready for abrupt shifts in tone. Nothing in this expansion rules out more abrupt liquidity measures elsewhere. Should stimulus spread to other asset classes, say through offshore credit markets or household wealth products, then the shift could distort correlations. That’s likely to demand fast repricing on multi-asset volatility structures.

In the meantime, we treat this update as a directional tailwind for mainland equities, but with highly specific sector preferences. While that tailwind may suppress expected move premiums short-term, it doesn’t remove tail risk on a quarterly horizon. For now, insurance-led resources flowing into domestic equities should encourage restrained short volatility strategies, especially concentrated around low-dispersion ETFs. However, this still requires close attention to statements from Li’s office, as these remain the clearest forward-looking indicators of tactical policy rotation.

Create your live VT Markets account and start trading now.

Forex market analysis: 7 May 2025

Global markets are showing signs of a cautious recovery as investors focus on trade talks between the US and China, along with upcoming central bank decisions. While policy signals from China and hopes for better dialogue offer some optimism, uncertainty around interest rates and global tensions is keeping many traders in wait-and-see mode.

Global equities edge higher ahead of Fed decision and US–China trade talks

Global equity markets continued a cautious rebound on Tuesday, with the S&P 500 posting modest gains as investors turned their attention to two major developments: the upcoming Federal Reserve policy meeting and renewed US–China trade dialogue over the weekend.

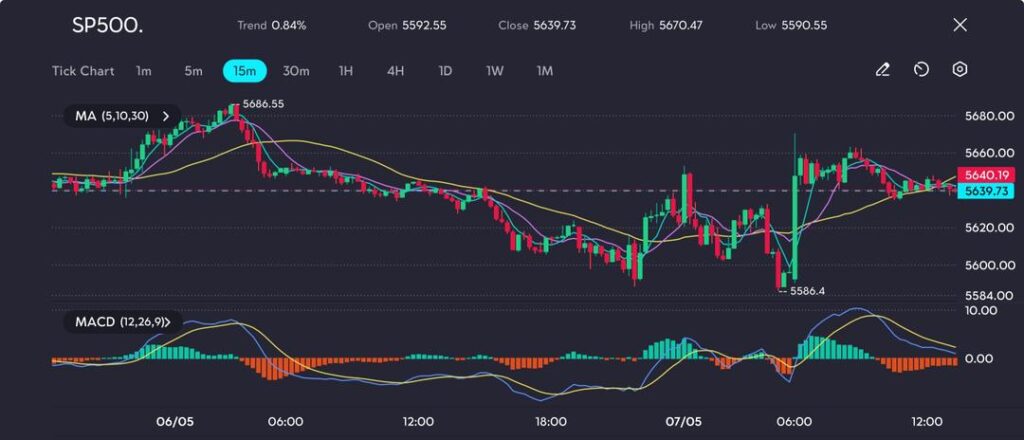
The index closed at 5639.73 after bouncing off an intraday low of 5586.4, where it found firm technical support.

Risk appetite remained fragile as investor sentiment was clouded by mixed messages ahead of the US–China meeting in Geneva.

US Treasury Secretary Scott Bessent described the talks as an effort to “work out what to talk about,” while Chinese officials cautioned against mistaking dialogue for compliance.

Still, futures remained in positive territory during the Asian session, supported by a rebound in Hong Kong equities, which helped underpin global risk sentiment.

Adding to the cautiously optimistic tone were new policy signals from Beijing. Authorities suggested potential interest rate cuts and expanded investment allowances for insurers to support the stock market.

However, the absence of direct fiscal stimulus kept investors sceptical, viewing these measures as temporary relief rather than long-term solutions.

Attention now shifts to the Federal Reserve’s upcoming policy decision. While no rate changes are expected, market participants are keenly watching for dovish language, especially following resilient US employment data.

This labour market strength has led traders to scale back expectations for imminent rate cuts.

S&P 500 technical analysis: Consolidating near support

The S&P 500 experienced volatile price action, opening at 5592.55, dipping to 5586.4, and then staging a strong intraday rebound.

However, the rally lost steam near the resistance level of 5670.47, where profit-taking emerged, resulting in a consolidative range between 5620 and 5665.

Short-term moving averages (5, 10, 30 periods) show a recent bullish crossover, but the slope is starting to flatten, indicating waning upward momentum.

SP500 rebounds from 5586 low, hits 5670 peak before stalling, as seen on the VT Markets app.

The price remains just above the 30-period moving average, suggesting buyers are still defending short-term support.

On the MACD indicator, the bullish crossover remains valid, but shrinking histogram bars hint at fading buying strength.

A sustained move above 5640 indicates a potential attempt to reclaim higher ground, yet failure to break 5670 decisively keeps the index exposed to further downside—particularly if support between 5610 and 5585 fails to hold.

A clean breakout above 5670.47 could reinvigorate bullish momentum toward the 5685–5700 zone.

Conversely, a break below 5585 might trigger renewed selling pressure, pushing the index back toward recent lows.

Outlook: Cautious optimism with key events in focus

Market sentiment remains delicately balanced as traders await clarity from both geopolitical developments and monetary policy directions.

Should the US–China trade discussions in Geneva result in structured dialogue or meaningful outcomes, the S&P 500 could gain momentum and attempt to break above the key resistance level of 5686.55. Such a move would likely bolster risk appetite and encourage broader equity participation.

However, several headwinds continue to cap near-term upside potential. Central banks across major economies remain non-committal, and the lack of a clear rate-cut path from the Federal Reserve adds to investor hesitation.

Meanwhile, lingering geopolitical tensions—not only between the US and China but also in other regions—keep global markets on edge.

In this environment, the S&P 500 is likely to remain in a consolidative range between 5630 and 5660, unless a decisive catalyst emerges.

Key data releases, central bank commentary, or significant breakthroughs in trade relations could provide the necessary push.

Until then, cautious optimism is likely to dominate market positioning, with traders favouring short-term setups over long directional bets.

Click here to open account and start trading.

China’s sovereign fund, Central Huijin, plans enhanced support for local stock markets and reforms

The China Securities Regulatory Commission (CSRC) has pledged its support to Central Huijin in bolstering the financial markets. Central Huijin and the People’s Bank of China (PBOC) are functioning as a quasi-stabilisation fund.

China is set to introduce reform measures aimed at enhancing technology boards. Adequate preparations have been established to manage external economic shocks.

Encouraging Long Term Capital

The CSRC intends to actively encourage the infusion of long-term capital into the stock market. Confidence remains high in achieving stable development in China’s stock market environment.

We’re now seeing clearer intentions from the regulators — not idle reassurances, but tangible steps. The CSRC gave its backing to Central Huijin, the state investment arm, reinforcing its role in calming volatility and pumping liquidity where needed. This, coupled with support from the People’s Bank of China, resembles actions seen during periods of domestic stress in past trading cycles, such as in 2015 and 2008. The objective remains clear: reduce panic-driven selling and anchor pricing expectations more firmly.

With preparations laid to shield the financial system from global economic headwinds, there is little ambiguity about what policymakers fear — foreign capital instability, tech stock fragility, and policy tightening overseas. Strengthening the technology boards signals a desire to direct capital flows toward domestic innovation rather than property and infrastructure — sectors that previously drove cycles but are now less favoured. Momentum here could begin impacting risk premiums on relevant contracts, especially those tied to mainland growth sectors.

By stating it will “encourage” long-term money into equities, the CSRC is gesturing to large institutional players — pension funds, insurers, perhaps even sovereign pools. This means an intended shift from short-term, sentiment-driven speculation toward something more anchored, slower moving, but potentially impactful over time. When this kind of participation increases, volatility typically tapers in major indices, and the composition of flows becomes easier to track.

Market Stability and Policy Responses

Liu, in his recent remarks, underscored confidence in achieving steady progress. Layered into the current policy tone is a reminder: the tools remain on hand, and authorities will not hesitate to deploy coordinated effort if market signals begin to weaken abruptly. This is not only a signal to domestic investors but also a calibration point for those watching from offshore.

Over the next one to two weeks, the direction of large-cap indices may become less reactive to news headlines and more driven by policy impact. Short-dated implied volatilities already hint at a ceiling, though relative strength remains with futures tied to tech-heavy boards. Options positioning suggests that recent hedging may unwind in waves if downside triggers fail to materialise. In this scenario, we anticipate dealer gamma exposure to flip more positively, which typically reinforces stability unless intraday volume spikes.

For us, the real takeaway lies in how predictable policy responses are becoming. One could start aligning tactically around that. The implied message from reform efforts and market interventions is stability first — and that’s not usually incompatible with near-term tactical moves, particularly in instruments most closely tied to domestic flows.

Create your live VT Markets account and start trading now.

The PBOC governor announced a 25 bps reduction in structural policy tool interest rates and banks’ deposits

The People’s Bank of China (PBOC) plans to lower interest rates on structural policy tools by 25 basis points. Additionally, they intend to guide banks in reducing deposit rates.

Recently, PBOC Governor Pan Gongsheng noted global uncertainties, prompting interest rate cuts. The PBOC has reduced the 7-day reverse repo rate to 1.4% from 1.5%.

PBOC Responds to Economic Conditions

Further measures include a 10 basis point cut to the Loan Prime Rate (LPR) and a 50 basis point reduction in the required reserve ratio (RRR). These changes reflect the PBOC’s response to prevailing economic conditions.

The announcements out of China point clearly to a central authority keen on stimulating activity amid ongoing economic sluggishness. By shaving 25 basis points off structural policy tools and nudging banks to ease deposit rates, the People’s Bank is trimming borrowing costs to inject more momentum into financing channels. The 7-day reverse repo now sits at 1.4%, a cut from the earlier 1.5%, a move made quietly but matching expectations following months of soft data and global fragility.

Pan’s references to outside uncertainties – the kind typically associated with dollar swings, uneven trade flows, and bouts of market tension – hint that this wasn’t merely a local policy action. Rather, we interpret this as a counterbalance to wider disinflationary pressures, some imported, some home-grown.

The adjustments didn’t stop at overnight liquidity. The Loan Prime Rate has been lowered by 10 basis points, and more notably, the required reserve ratio saw a 50 point trim. For domestic lenders, this frees up cash, allowing them to make credit more accessible without resorting to informal or riskier channels. It tells us very clearly that stabilisation, at least in the short term, has become paramount.

Analyzing Market Implications

In positioning for the next several weeks, it makes sense to consider what these moves imply about volatilities and rate differentials. Existing positions linked to CNH funding costs may be impacted by lowered forwards, while local risk appetite might return in pockets, albeit cautiously and preferentially towards sectors supported by the State’s next wave of guidance.

From our side, careful recalibration of options pricing and spreads will be needed. Watch the term structure across tenors that are uniquely sensitive to policy tweaks – anything with sub-six-month exposure will reflect these rate steps almost immediately in delta and gamma profiles. For anything longer, the implied reaction may be more subdued, unless further easing is introduced.

Consider as well the way in which commercial banks, empowered with both lower funding costs and guided rate ceilings, will reposition their books. Sudden steepeners or flattening trades could become more compelling depending on whether private demand upticks as intended. For us, skew estimates and tail scenarios should be rerun under these adjusted assumptions.

Finally, given the RRR reduction alters base liquidity conditions, pay attention to short-end repo markets, particularly where arbitrage plays might now widen. The pricing of volatility might not immediately reflect the full outcome of the central bank’s decision-making, so patience combined with precise execution will matter more than usual.

Create your live VT Markets account and start trading now.

The pair hovers around 1.1360, showing bullish potential as it tests support near 1.1350

The EUR/USD currency pair is close to testing support around 1.1350, with the potential to revisit the high of 1.1573 from April 21. The Relative Strength Index (RSI) is above 50, showing a bullish trend, and currently, the pair is examining the nine-day Exponential Moving Average (EMA) near 1.1320.

The currency pair is retracting recent progress and is trading near 1.1360 during the Asian session. Technical analysis indicates a bullish trend with the pair positioned in an ascending channel pattern.

Short Term Momentum

Short-term momentum seems strong, as the EUR/USD remains above the nine-day EMA. A retest of the April high is possible, with resistance likely near the ascending channel’s upper boundary at 1.1730.

The nine-day EMA near 1.1320 acts as key support, followed by the channel’s lower boundary around 1.1300. A breach below this area could weaken the bullish trend, potentially reaching the 50-day EMA near 1.1057.

Further downside may soften medium-term momentum, extending losses toward the six-week low of 1.0360. The Euro was the weakest against the US Dollar, with a 0.06% change on the day.

The movement displayed in recent sessions gives us a cleaner picture of what’s driving current behaviour around the EUR/USD pair. We’ve seen the currency pair retrace some of the gains it captured earlier in the week. But on balance, the technical setup leans positive, backed by that RSI reading comfortably above 50, which tends to be interpreted as a continuation of buying interest rather than exhaustion.

Signs Of Consolidation

From our view, the pair is showing early signs of consolidation after a steady incline during previous days. Price action sticking close to the nine-day EMA around 1.1320 is important—not necessarily because it determines upcoming direction on its own, but due to how closely the market has been respecting that level. That EMA is doing its job here, acting as a buffer whenever downside momentum increases intraday. The channel’s anatomy—support at 1.1300 and resistance closer to 1.1730—gives us a framework for judging risk in the approach to higher resistance.

Looking in the other direction, if traders see a decisive daily close below the 1.1300 line, that opens up a different conversation. We’re monitoring the 50-day EMA around 1.1057, as any moves approaching or beneath that level would mark the end of the current uptrend. Short positions would likely begin to build around that stage, especially if accompanied by a declining RSI or longer wicks forming above prices—often signs of demand fading.

It’s easy to get too focused on the short-term candles, but bigger-picture pressure builds as the pair approaches the April highs near 1.1573, a place where sellers previously overwhelmed buyers. That area can’t be ignored. It’s likely to prompt caution among those who’ve been long from lower levels. And unless broader macro factors shift radically, that region acts as a natural checkpoint where upward moves may slow or even turn.

Volatility in peer currencies and reaction to US economic prints may also distort momentum subtly over the coming weeks. That daily 0.06% shift—small as it is—suggests lack of aggression from either side for now, but it won’t remain that way for long. Like most slow starts, they tend to be followed by sharp directional leanings.

Given this setup, we remain attuned to how momentum changes in the zone between 1.1300 and 1.1570. For moves against trend to gather force, a break below the base of the structure followed by rejection on any bounce attempt would validate a more bearish short-term strategy. Layering entries and exits based on EMA alignment with price action remains an efficient way to manage volatility and avoid late commits.

Create your live VT Markets account and start trading now.

In Saudi Arabia, gold prices have decreased, based on recently compiled data from reliable sources

Gold prices in Saudi Arabia experienced a decrease on Wednesday. The current price for one gram of gold is 407.62 Saudi Riyals (SAR), down from 413.81 SAR on the previous day.

The price per tola of gold also saw a reduction, falling from 4,826.65 SAR to 4,754.42 SAR. Current prices for gold are calculated by converting international market prices into SAR, adjusting for local measures and currency rates.

The Valuation Of Gold

Gold is valued both for its beauty as jewellery and for its role as a financial asset. It is often considered a safe haven, meaning it is a favoured choice during economic uncertainty.

Central banks are major holders of gold, augmenting reserves to bolster economic confidence. In 2022, central banks added 1,136 tonnes, equivalent to approximately $70 billion, marking the highest annual purchase on record.

Gold prices are affected by various factors including geopolitical events, economic instability, and interest rates. A strong US Dollar can suppress gold prices, while a weaker Dollar typically elevates them. Gold prices often react inversely to movements in the stock market and US Treasuries.

This recent dip in gold prices — seeing the gram move down by just over six riyals and the tola by roughly 72 — reflects broader shifts in international sentiment. The precious metal, long viewed as a store of value in uncertain periods, remains tethered to macroeconomic forces, not least of which include central bank policy moves, interest rate expectations, and currency strength, especially the US dollar. That’s why the correlation between a firmer greenback and weaker gold is not just anecdotal; it’s observable in real time and deeply linked to trading volumes and futures activity.

Market Forces And Indicators

Central banks continue to act as a backstop in this asset class, and their intentions carry weight across international markets. The 1,136 tonnes added to reserves in 2022 was not only a historical record — it was also a pronounced signal. These purchases typically reflect expectations about systemic risk or about dwindling confidence in printed currencies. When such institutional players shift course with that level of aggression, markets often mirror the action — either promptly or in anticipation.

From our position, price movements like the ones observed are opportunities to understand which forces are accelerating and which are pulling back. A dip of 6.19 SAR per gram may not feel seismic on the surface, but paired with factors such as interest rate speculation out of the U.S. or regional inflation dynamics, it sets the scene for layered decisions.

As gold continues to underreact to fluctuating yield levels on US Treasuries, the volatility in its price could remain compressed, which threatens to lessen short-term directional bias. But such quiet patches can break quickly. Market participants with exposure tied to delta or gamma sensitivity should monitor upcoming monetary policy meetings and related commentary.

The inverse relationship between equities and gold isn’t failing — it’s repricing. Assets aren’t decoupling from historical norms; rather, they’re recalculating their response amidst mixed inputs. If the dollar index holds above its current trendline, it could continue pressuring gold quotes, but any dovish rate outlook might derail that momentum. We’ve seen this pattern before in past tightening cycles.

Watching spreads between short- and long-dated gold futures helps us track sentiment shifts. Compressed backwardation patterns, or sudden return into contango, could flag where hedgers expect volatility to return. And when institutional flow moves, often lightly at first, it tends to snowball. Watching dealer inventories and ETF redemptions tells us more than price alone.

Although metal demand for jewellery can still prop retail prices in the region, the broader price story is written elsewhere — partly traded, partly signalled, and often sentiment-led. That is where the attention should be.

Create your live VT Markets account and start trading now.

In Australia, Santos’s CEO reported 200 wells submerged by flooding, leading to a 15% decline in production

In Australia, the CEO of Santos has reported that over 200 wells are currently submerged due to flooding in the Cooper Basin. This situation has led to a decrease in production by 15%.

The floods have impacted operations significantly, with many wells affected and some infrastructure potentially damaged. The company is assessing the situation to determine the full extent of the impact on production capabilities.

Impact on Production Capabilities

The reported flooding across the Cooper Basin has caused a sharp pullback in activity, with over 200 wells now underwater and production rates cut by around one-seventh. This drop is material, and the operational disruption could linger longer than the water itself – especially if inspections reveal mechanical damage or compromised infrastructure. The longer-term consequences may also depend heavily on how quickly repairs can be made, coupled with how easily logistics routes — often crisscrossing these remote areas — can be re-established.

For participants who trade on derivative markets tied to the energy sector, particularly those exposed to upstream oil and gas production in Australia, there’s a need to revisit projected flows. Pricing models that assumed steady supply from Cooper should be revisited this week, as ongoing assessments could reveal further reductions or longer timelines before flow rates recover.

Gallagher, by noting the scale of submersion, provided more than just a description of events — he gave an implicit warning for those tracking energy volumes. If pipeline operations suffer pressure changes or if compressor stations need realignment, we could be looking at non-linear effects on gas transmission further downstream. Almost certainly, hedge strategies need to reflect this deeper uncertainty.

Weather and Supply Chain Challenges

There’s also the weather component — we’re not only contending with physical damage but the risk that wet conditions could return. Recovery is contingent not only on human intervention but also on meteorological stability that doesn’t appear assured just yet. We are following rainfall projections closely, and we’d urge others to keep models updated with the Bureau’s short-term forecasts, especially for flow-dependent derivatives.

Additionally, consider delays to rebalancing efforts outside the Basin. Export buyers may begin adjusting demand from other geographies, which can influence swaps or options tied to broader benchmarks. It’s not just about the direct loss in production, it’s also about how buyers reposition and how freight or LNG schedules shift in response.

With uncertainty building not only locally but also further along the supply chain, short-term implied volatilities could continue to rise. Mean-reversion strategies in energy prices may need adjustment as a two-week disruption here does not equate to a two-week rebound. Timing asymmetries are common in events tied to natural disasters.

Watch storage data, watch maintenance updates from downstream partners, and be ready to revise delta exposure rapidly. The forward curve may already be moving, but it won’t be moving evenly.

Create your live VT Markets account and start trading now.

In the Philippines, gold prices declined today based on gathered data.

Gold prices in the Philippines declined on Wednesday, with the price per gram dropping from 6,110.95 PHP to 6,023.33 PHP. The price per tola also saw a decrease from 71,276.92 PHP to 70,253.41 PHP.

Gold prices are calculated locally by converting international rates to the Philippine Peso, with daily updates based on market conditions. Historically, gold is a store of value and a medium of exchange and is considered a haven asset during uncertain times.

Central Bank Gold Reserves

Central banks hold large gold reserves to support their currencies during instability, with 1,136 tonnes purchased in 2022, valued at $70 billion. Emerging economies, including China, India, and Turkey, are rapidly increasing their gold reserves.

Gold prices are inversely related to the US Dollar and US Treasuries, which are major reserve assets. Gold price movements are influenced by geopolitical instability, recession fears, interest rates, and the strength of the US Dollar.

Geopolitical events and interest rates impact gold, with a weak Dollar likely pushing the price higher. Gold does not rely on specific issuers, making it a hedge against inflation and currency depreciation.

The recent drop in gold prices—from ₱6,110.95 to ₱6,023.33 per gram—is not unexpected, given how strongly the metal reacts to tightening financial conditions and shifting expectations around major reserve currencies. The price per tola, another common unit, followed suit, ticking down more than a thousand pesos, confirming a widespread easing in value. These changes are not just about the metal itself but rather what it represents in a global economy brimming with tension and reaction.

Spot rates for gold in the Philippines are updated in real time, mirroring changes in global demand and supply. When markets sense instability, the usual tendency is for interest to rise in safe-haven assets. But while gold is traditionally part of that category, its short-term pricing is hugely influenced by how the US Dollar performs against a basket of major currencies. As the Dollar builds strength, gold tends to weaken in local currencies, including the peso, because its appeal as an alternative starts to fade.

In the past few months, central banks, particularly in non-Western economies, have continued to add to their gold holdings to buffer against foreign exchange volatility. In 2022 alone, global central banks added over a thousand tonnes to their vaults. That momentum hasn’t slowed very much in 2023. Their rationale is clear: unlike fiat money, gold doesn’t carry counterparty risk. It’s liquidity and convertibility during market volatility make it advantageous when other reserves risk devaluation or dilution through monetary policy changes.

Market Influences On Gold Prices

From what we see in price behaviour, there is often sharp movement whenever investors shift out of interest-bearing US Treasury assets and into commodities. This is frequently triggered by doubt over future rate changes in Washington. Higher yields make bonds more attractive, so gold becomes less competitive. On the other hand, rate cuts or whispered suggestions of economic softness usually send gold higher. Discerning that shift early is likely to produce better entry or exit levels.

The way markets are now, gold seems caught between opposing forces. On one hand, central bank demand and long-term inflation fears linger in the background. On the other, a resilient Dollar and continuing rate pressures cap upside moves. For us, that means choppy trading in short timeframes and a need to adjust positions quickly. Directional bets may have to be re-evaluated more often than in quieter phases. Stronger activity around economic data days could cause unpredictable price jumps—both up and down. We expect volatility to stay elevated throughout the next few weeks.

Traders will need to stay alert on three angles in the short term—firstly, the pace of monetary tightening in the US, then capital flows coming from emerging economies, and finally, global risk sentiment around current conflicts or economic stumbles. Even without new tensions, shifts in inflation prints or labour market performance are likely to alter rate expectations fast enough to trigger commodity shifts. In almost every instance, gold responds rapidly to such changes.

We’re maintaining a view focused on relative strength indicators and Dollar momentum as more reliable intrawatch markers than historical correlations alone. If any fresh inflation figures signal stickiness, that could delay a return to rate easing and further dent near-term upside for gold. Conversely, lower-than-expected wage data or hints of job weakening could complicate policy stances, feeding into a bullish bid for metals. What’s important is knowing where to set limits, and avoiding exposure during uncertain Fed commentary windows.

There’s also a renewed interest in cross-asset plays—juxtaposing gold’s movement with real yields and volatility indices. While not every day offers a directional signal, divergence between commodities and bonds offers a decent proxy for risk tolerance. When real yields start dropping but gold doesn’t react, that often means markets aren’t entirely convinced of a rate cut. We’ve seen this several times already in Q1.

The coming weeks should see more of these moments—a quick burst of demand, followed by retracement. Letting fundamentals steer the view, but reacting with flexibility to technical dislocations, remains the better approach. For anyone timing entries, don’t ignore the local peso’s relative weakness, as it adds an extra layer that doesn’t always sync with international market moves. That mismatch, while sometimes fleeting, can be scaled tactically when timing aligns.

Create your live VT Markets account and start trading now.

The April Services PMI for Japan exceeded predictions, coming in at 52.4 rather than 52.2

Japan’s Jibun Bank Services PMI exceeded forecasts, reaching 52.4 in April compared to the expected 52.2. This indicates growth within the services sector, as a PMI above 50 typically signifies expansion.

EUR/USD experiences challenges holding above 1.1350, impacted by optimism regarding US-China trade talks which strengthen the US Dollar. Similarly, GBP/USD faces pressure near 1.3350 due to a stronger US Dollar and market sentiment improvements.

Gold prices have dipped from two-week highs at $3,435 due to selling pressures ahead of the US Federal Reserve’s announcements. Meanwhile, Bitcoin nearly reaches its resistance level of $97,700, signalling possible gains if surpassed.

Central Bank Meetings And Market Impact

A busy schedule of central bank meetings promises decisions from significant banks, including the Federal Reserve and the Bank of England. Additional information highlights the risks of foreign exchange trading, underlining the need for investors to be aware of potential losses and to seek independent advice if necessary.

With Japan’s services sector showing strength—reflected in the Jibun Bank Services PMI ticking higher to 52.4—there is a subtle reinforcement of Asia’s broader demand profile. The fact that it nudged past expectations, even if marginally, suggests domestic activity remains resilient despite global uncertainties. For us, this matters because it may lend support to regional equity indices, which tends to ripple into more risk-on positioning across multiple asset classes, particularly those sensitive to investor sentiment like yen crosses and emerging market currencies.

Therefore, if we think in terms of volatility pricing, especially in yen pairs, this modest uptick helps stabilise expectations. Short-dated implied vols in USD/JPY, for instance, may remain somewhat muted unless there’s a reactive move out of Tokyo in response to the Fed or local macro figures. Watching any divergences between manufacturing and services trends could also present an opportunity for directional strategies on JPY.

Turning to the euro-dollar pair, it’s battling to stay above the 1.1350 mark—and failing, so far. Much of that has to do with growing confidence around progress in US-China discussions, which in turn firm the Dollar. When safe-haven flows reverse, the euro loses part of the tailwind it sometimes benefits from during phases of uncertainty. That said, this pullback doesn’t imply an immediate breakdown; but it does offer scope for testing downside levels if new catalysts push the Dollar higher.

Financial Markets Sensitivity To Data And Sentiment

Similar price behaviour is seen in the pound-dollar rate. Around 1.3350, it’s showing fragility. The improved global risk mood and a relatively more attractive US rate profile continue to favour Dollar strength. For us, this reaffirms the idea that upward moves in cable without corresponding rate repricing are likely to get capped. However, tracking UK-specific data and central bank tone closely becomes all the more relevant now, especially as monetary policy expectations around Threadneedle Street remain fluid. Short gamma trades in GBP/USD may continue to be expensive until more guidance emerges on forward rate hikes or pauses.

Now, on the metals side, gold is showing early signs of turning after a strong rally, with profit-taking setting in ahead of upcoming remarks from US policymakers. Prices failed to sustain above $3,435 and have begun edging lower. If policy remains tight or hawkish in tone, that would further weigh on non-yielding assets like gold. For positioning, that shifts the bias towards lower strikes on downside hedges—particularly in the form of puts—at least until inflation data or other triggers change the narrative.

Bitcoin, trading just below a key resistance level of $97,700, continues to flirt with a breakout. The proximity to that threshold signals buyer interest but also shows hesitancy—classic pre-break behaviour. Should there be a sustained close above it, technical traders would likely view it as an invitation to re-engage. In that context, outright longs with tight stops or options that benefit from upside skew could become more appealing. However, the lack of macro drivers tied to crypto means watching liquidity and sentiment flows becomes paramount.

Looking ahead, the packed calendar with announcements from major central banks adds potential catalysts for markets to reprice active positions. What we’re preparing for is a series of policy decisions that could either support existing rate expectations or force realignment—especially in rates-derived FX markets like EUR/USD and USD/CHF. Directional trades aside, elevated realised volatility could open premiums for those willing to write contracts, assuming risk can be managed. With spots sensitive to any change in tone, traders must stay nimble.

Lastly, the mention of risk in foreign exchange isn’t ceremonial. Leverage and misjudged position sizing are often the root of unexpected outcomes. Risk-defined setups—using options or smaller lot sizes—can protect from sharp swings tied to macro shifts. Seeking clarity from data and adjusting quickly remains the name of the game throughout the next two weeks of dense data and policy noise.

Create your live VT Markets account and start trading now.

Back To Top
server

Hello there 👋

How can I help you?

Chat with our team instantly

Live Chat

Start a live conversation through...

  • Telegram
    hold On hold
  • Coming Soon...

Hello there 👋

How can I help you?

telegram

Scan the QR code with your smartphone to start a chat with us, or click here.

Don’t have the Telegram App or Desktop installed? Use Web Telegram instead.

QR code