As part of our commitment to provide the most reliable service to our clients, there will be server maintenance and product adjustment this weekend.
Maintenance Details: MT4 / MT5 – 17th of May 2025 (Saturday) 00:00 – 03:00 (GMT+3)
Please note that the following aspects might be affected during the maintenance:
1. During the maintenance hours, Client portal and VT Markets App will be unavailable, including managing trades, Deposit/Withdrawal and all the other functions will be limited.
2. During the maintenance hours, the price quote and trading management will be temporarily disabled during the maintenance. You will not be able to open new positions, close open positions, or make any adjustments to the trades.
3. There might be a gap between the original price and the price after maintenance. The gaps between Pending Orders, Stop Loss and Take Profit will be filled at the market price once the maintenance is completed. If you don’t want to hold any open positions during the maintenance, it is suggested to close the position in advance.
4. Following the maintenance, it is important to note that the latest version will be 4475. If your MT5 version is below 4410, it is suggested that you download the latest version on official website by navigating to “Trading” → “Platforms”→ “MetaTrader 5”.
Check your MT5 software version with the following steps:
※ PC: Open the MT5 software > Help > About;
※ Android: Open the MT5 app > About;
※ iOS: Open the MT5 app > Settings > Settings.
Please refer to MT4/MT5 for the latest update on the completion and market opening time.
Thank you for your patience and understanding about this important initiative.
If you’d like more information, please don’t hesitate to contact info@vtmarkets.com.
The Japanese Yen has gained against the US Dollar, reaching a weekly high amid expectations of the Bank of Japan’s interest rate hike in 2025 and potential US-Japan trade deals. These factors, along with a global risk sentiment shift, support the Yen’s strength against the Dollar, pushing the USD/JPY pair below mid-145.00s levels.
Despite easing US-China trade tensions, the Yen remains strong as the Dollar struggles with recession fears and reduced expectations for aggressive Federal Reserve policies. Factors like the US Producer Price Index and Fed Chair Jerome Powell’s speech influence market dynamics, though the trend suggests a depreciating move for the USD/JPY pair.
Japan’s PPI and BoJ Policy Changes
Japan’s PPI highlights price pressures, supporting further BoJ policy changes. Deputy Governor Uchida noted potential rate hikes if economic conditions improve. Economists forecast the BoJ maintaining a 0.5% interest rate through September, possibly increasing it by year-end.
A soft US Consumer Price Index supports the expectation of additional Fed rate cuts, contributing to the Yen’s outperformance for three days. The USD/JPY pair awaits clarity from Fed officials, amid mixed opinions on tariffs and trade. The Yen’s technical trajectory suggests potential further gains, though fluctuating resistance levels pose challenges.
So far, we’ve seen the Yen climb steadily on the back of mounting speculation surrounding future policy adjustments in Tokyo. It’s not simply about a potential rate hike in 2025—that’s priced in, at least partially—but rather how the Bank of Japan is being viewed as transitioning away from ultra-loose policies. Uchida’s remarks offered a nudge; they’re not a trigger, but they reinforce the direction in which Japanese policymakers are headed. What stands out is how the market has reacted pre-emptively, not waiting for formal decisions, but moving instead on hints and forward guidance.
During the same period, the Dollar has wobbled, and not just because of moderating expectations from the Federal Reserve. There’s been genuine concern about US growth momentum. Powell has been more cautious in recent addresses, and this has filtered through the treasury curve, trimming yield appeal. We’ve noticed implied volatility ticking up slightly, yet not dramatically, showing there’s a watchful eye on surprises without a panic-driven bid for longer-dated protection.
USD and Yen Market Dynamics
For those positioned in the short-end of derivatives—with delta exposure around key strike levels—it’s worth noting how the inflation data continues to set the tone. When soft CPI readings come in consecutively, we’re not just looking at relief bids on equities; we see positioning shifts in FX as rate differentials narrow. That’s been echoed in the price action leading up to Friday’s settlement cycles.
On Japan’s side, the domestic producer price index surprised to the upside. Markets tend to underestimate the impact of corporate pricing power in Japan, but this time it landed differently. Policy calls through to September appear unlikely to change meaningfully, but there’s a growing window in Q4 when options pricing could start reflecting a steeper BoJ path. As it stands, breakevens in forward JPY contracts are beginning to compress, especially into year-end.
Risk tone globally is not disorderly, but it has softened. That tilt has helped haven currencies, although it’s been far more visible in the Yen than the Swiss Franc, reflecting the shifting calculus around the next moves by Tokyo’s team. Importantly, it’s not just macro—the technical picture matters too. The USD/JPY pair has tested the 145-handle and failed to recover convincingly. Within options, 145 and above saw heavy defensive flows unwind, and the suppression of upside skew tells us one thing—demand for topside Dollar protection against the Yen just isn’t there right now.
Heading into the next fortnight, with Fed speeches scattered and overlapping key expirations, we need to look at volatility smiles across front-dated exposures. Gaps in liquidity above prior resistance levels—particularly near 147—suggest minimal interest in defending those strikes. The market isn’t fighting for Dollar upside. That tells us where the pressure resides.
Trade talks involving Washington and Tokyo still hover in the background. These headlines tend not to move pricing intraday, but algorithmic books have started tagging keywords more sensitively. If any real structural shifts emerge, it’s going to be through large institutional repositioning in options terms, especially if tariffs are bundled into conversations about inflation expectations.
For now, directional bets are pointing one way, yet the pace isn’t aggressive. There’s room for snapbacks, especially as price touches old breakout zones, but unless we see Fed comments clearly re-anchoring Dollar strength narratives, momentum should favour the current drift. Volume isn’t thin exactly, but it feels patient—like participants are waiting for clearer signals before repositioning hedges.
We’ve moved through the dominant narrative: Japanese rate normalisation versus American policy softening. That relative positioning continues to steer currency derivatives. With the next Japanese interest rate decision past the immediate horizon, attention should shift towards implied ranges into September. Any surprise in upcoming inflation prints—both from Tokyo and Washington—will be the next re-pricing trigger, not trade negotiations alone.
In April 2025, Australia’s unemployment rate was reported at 4.1%, aligning with expectations. Employment figures surged with an addition of 89,000 jobs, marking the most substantial monthly increase in 14 months.
Out of these jobs, 59,500 were full-time positions. Analysts only anticipated 20,000 new positions, so actual numbers surpassed forecasts by over four times. Despite this, the unemployment rate remained steady at 4.1%, close to the five-decade low, partly due to a record-high participation rate of 67.1%.
Impact On Monetary Policy Decisions
This job data influences potential decisions by the Reserve Bank of Australia (RBA), which is set to meet on May 19 and 20, 2025. Expectations for a 25 basis point rate cut were widespread, but this employment report could cause some reconsideration. Additionally, calming market conditions following the US-China trade agreement provide more reasons for the RBA to maintain the current rate.
The Australian dollar saw a slight increase in value following the release of the jobs data; however, this rise did not sustain momentum. Overall, economic indicators suggest a cautious approach towards any immediate policy changes by Australia’s central bank.
What we’re seeing here is a strong performance from the labour market, which creates a slightly more complicated backdrop for monetary policy decisions. The economy added 89,000 jobs in just one month—more than four times what had been predicted. A good portion of these were full-time roles, which implies deeper confidence in longer-term business planning. Yet, despite this large boost, the unemployment rate didn’t move. That’s mainly because more people are now either in work or actively looking for it, as signified by the record-high participation rate.
From a policy perspective, that means things may not be as simple as deciding whether the latest data looks good. When we look at such a sharp rise in employment figures, particularly without a corresponding drop in unemployment, it’s a sign that the labour market is absorbing more people rather than overheating. The stability in the unemployment percentage, combined with a jump in job creation, places pressure on policymakers to weigh short-term economic resilience against longer-term inflation targets.
Market Reactions And Expectations
As a result, those anticipating a rate cut at the next central bank meeting may need to reconsider. The data undermines previous assumptions that the economy needed further loosening right away. Combine that with stabilisation in global trade conditions—mostly due to easing tension between large trading partners—and we’ve got fewer external risks to manage in the short term.
What that spells out for us is a touch more uncertainty in shorter-dated rate products. What previously seemed likely now demands a shift in assumptions. Price actions in swap markets and options linked to short-term rates may need to be revisited, especially ahead of the May decision. Positioning that had leaned into dovish expectations could now need hedging or unwinding if sentiment firms around the idea of a hold.
It’s not just about where yields settle, though; it’s about the pace at which adjustments happen now that previous bets might require reversal. Temporary currency strength might’ve hinted at initial optimism, but its quick retreat reinforces the idea that markets are still sifting through implications. This leaves tighter rate spreads and near-term implied volatility levels as the areas where reactions might be most visible.
We’d suggest watching not only the tone in forward guidance next week but also whether there is a sharp change in reaction to any related data points. Anything linked to household spending, wage growth, or inflation expectations could feed into a shift in pricing. It’s going to be a test of how quickly risk can be adjusted when central bank pathways become less predictable.
Global markets are on edge. The International Monetary Fund recently slashed its 2025 growth forecast to 2.8%, citing US-China trade tensions and tariff uncertainties. Just last week, Wall Street soared after a temporary tariff truce, only to wobble as fears of a global recession lingered. For traders, this volatility raises a critical question: how do you protect your portfolio in such uncertain times?
In this article, we’ll demystify recessions, assess whether one is looming, and share practical trading strategies to help you navigate the storm—whether you are a beginner or a seasoned retail trader.
What is a recession? A simple explanation
Let’s start with the basics. A recession is a significant decline in economic activity that lasts for several months. It’s often marked by falling gross domestic product (GDP), rising unemployment, and reduced consumer spending.
Economists typically define it as two consecutive quarters of negative GDP growth, but it’s more than just numbers—it affects jobs, businesses, and your investments.
Think of the economy as a car engine. When it’s running smoothly, businesses thrive, and markets climb. But if it sputters and stalls for too long, you are in a recession. Key indicators include weak consumer confidence, slowing industrial output, and job losses.
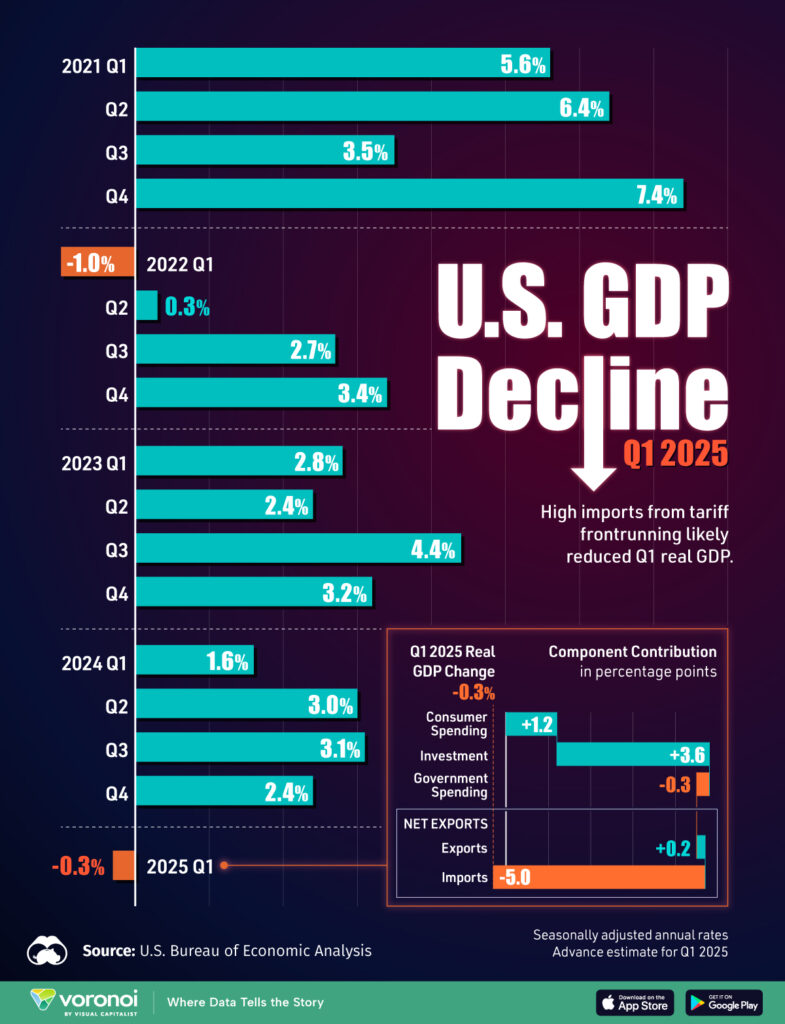
For example, the US reported a GDP contraction of 0.3% in Q1 2025, raising concerns among analysts. Unlike a single bad market day, a recession is a broader, sustained slowdown that can reshape trading opportunities.
Are we in a recession now? The current picture
So, are we in a recession today? The short answer: not yet, but the risks are growing.
Recent data paints a mixed picture. The IMF and World Bank have cut global growth forecasts, warning of trade disruptions from US-China tariff talks. In the US, recession probabilities have climbed to 37–60%, according to the IMF and JPMorgan, fuelled by weak ADP jobs data showing just 62,000 jobs added in April 2025.
Europe isn’t immune either—Germany’s growth forecast was slashed to 0%, and China’s to 4%.
Yet, there are glimmers of hope. US unemployment remains steady at 4.2%, and markets rallied after the US-China tariff truce in May 2025. Gold prices, a classic safe-haven asset, surged to USD 3,400 per ounce as investors hedged against uncertainty, but no major economy is in a confirmed recession.
The takeaway? We are on shaky ground, and traders need to stay vigilant to navigate what’s ahead.
What recession fears mean for traders
Recession fears can send markets into a tailspin, and that’s a big deal for your trading portfolio. When investors get nervous, volatility spikes. The S&P 500, for instance, swung wildly after tariff announcements, reflecting uncertainty.
Certain sectors take a hit—consumer goods and technology stocks often slump as people spend less. Unilever, for example, raised prices in 2025 due to tariff-driven cost inflation, which could dent demand and hurt its stock.
On the flip side, safe-haven assets shine. Gold and US Treasuries rally as investors seek stability, while the US dollar strengthens, pressuring emerging market currencies like the Indian Rupee, which hit 85.87 against the dollar recently.
Defensive sectors like utilities and healthcare tend to hold steady, as people still need electricity and medicine.
The risk for traders is clear: if you are overexposed to volatile assets, recession fears could erode your gains quickly. Understanding these dynamics is key to making smarter trading decisions.
Best trading strategies during recession fears
Now, let’s get practical. How can you trade smarter amid recession fears? Here are six strategies to protect and grow your portfolio, even in turbulent times.
Diversify your portfolio: Don’t put all your eggs in one basket. Spread investments across stocks, bonds, and commodities to reduce risk. For example, allocating funds to gold or U.S. Treasuries can balance exposure to volatile tech stocks. In early 2025, investors who shifted a portion of their portfolios to gold mitigated losses when tech stocks fell 5% following tariff-related news.
Focus on defensive stocks: Invest in sectors that weather downturns, like utilities or healthcare. Companies like National Grid often remain stable, as demand for electricity persists. In contrast, luxury retailers may struggle as consumers tighten budgets.
Use stop-loss orders: Protect against sudden market drops by setting stop-loss orders. For instance, if you buy a stock at USD 100, set a stop-loss at USD 90 to limit losses to 10%. This simple tool can save you from steep declines during volatile periods.
Trade safe-haven assets: Consider gold or US dollar-based forex pairs like USD/JPY. Gold’s 20% rise in 2025 shows its appeal during uncertainty. Forex traders might capitalise on the dollar’s strength as investors flock to safety.
Stay liquid: Keep some cash on hand to seize opportunities when markets dip. During a market correction, quality stocks often become bargains. For example, investors holding cash reserves in 2025 were able to purchase undervalued utility stocks during a market dip, boosting their potential returns.
Monitor news closely: Stay updated on tariff developments and economic data, like US jobs reports or GDP figures. Platforms like VT Markets offer real-time data to help you anticipate market moves. For example, weak jobs data in April 2025 triggered a brief market sell-off, but informed traders acted swiftly.
These strategies aren’t foolproof, but they can help you navigate uncertainty with confidence. The key is to stay disciplined and avoid emotional decisions, even when headlines scream “recession.”
Conclusion
Global recession fears are real, but they are not a certainty. Mixed signals—weak growth forecasts, tariff tensions, and resilient unemployment—mean traders must stay sharp. By understanding what a recession is, recognising its impacts, and using strategies like diversification and stop-loss orders, you can protect your portfolio and even find opportunities in volatility.
VT Markets is here to support you with real-time data, expert analysis, and powerful trading tools to navigate these uncertain times. Ready to take control of your trading journey? Open a live account with VT Markets today and start trading smarter, not harder.
The UK’s GDP increased by 0.7% quarter-on-quarter in Q1 2025, surpassing the anticipated 0.6% growth. In March, the GDP rose by 0.2% month-on-month, outdoing the expected flat performance.
Year-over-year, the country’s GDP grew by 1.3% during this quarter, slightly above the 1.2% forecast, but down from the previous quarter’s 1.5%. The Index of Services improved to 0.7% in March.
Industrial And Manufacturing Overview
Industrial and Manufacturing Production saw decreases of 0.7% and 0.8% in March, below expectations. However, total business investment rose by 5.9% from January to March.
The British Pound showed mixed performance against major currencies, with gains primarily against the New Zealand Dollar. GBP/USD increased by 0.08% on the day, trading at 1.3275.
The currency heat map highlights percentage changes among major currencies, reflecting the British Pound’s positioning relative to others. The data provides currency exchange insights based on recent economic indicators.
Taking into account the stronger-than-expected GDP figures, we’re observing a modest uptick in broader economic momentum as Q1 closes. The 0.7% quarterly expansion steps slightly ahead of the market’s 0.6% call—offering enough of a surprise to warrant attention without overstating the trend. Month-on-month growth in March at 0.2%, while modest, disrupts the complacency suggested by the flat expectation. So, we’re not looking at a complete turnaround, but rather a subtle affirmation of economic resilience.
Growth And Investment Trends
Honing in on the yearly view, 1.3% growth just overshoots projections, although it’s worth flagging that we’re still slowing from the previous 1.5%. In that sense, the beat isn’t structural; it’s more a variance at the margin. It implies we’re heading in the right direction, just with less vigour than before. For those looking beyond the headline, the Services Index shift to 0.7% indicates that the heartbeat of the economy—the dominant sector—is ticking with more consistency now, reinforcing the base for forward-looking positions.
That’s where the industrial metrics tell a different tale. Production—both industrial and manufacturing—came in underwhelming, posting contractions of 0.7% and 0.8%, respectively. These drops cannot be ignored because they counterbalance any optimism from service-driven GDP. There’s evidently a divergence, where the strength in consumer or information segments doesn’t blend with output-oriented components. It’s not quite a red flag, but perhaps a yellow light—best to tread carefully around asset classes linked to heavy industry output.
Business investment, though, stands out. A 5.9% rise over three months is substantial. It reintroduces the idea that companies still see enough medium-term promise to commit capital. This isn’t mere inventory restocking; it’s capital flows into forward-facing deployment. That adds depth to the GDP beat—suggesting there’s more investment behind the growth, not simply consumption or trade tailwinds.
Currency reactions were mixed, which is not surprising. Sterling held slightly firm against the US dollar with a daily rise of 0.08%, leaving GBP/USD at 1.3275. Not a wide swing, but enough to show markets digesting the data favourably without overreaching. Gains were chiefly noted against the New Zealand Dollar, likely a blend of better UK numbers and external weakness across other economies. The heat map helps visualise that—offering relative position shifts that are rooted in baked-in expectations and comparative strength.
For positioning, these data points suggest a narrowing window. Moves anchored in UK growth look increasingly supported by robust service activity and improved investment trends. On the other hand, the production drag will temper longer cycle confidence. We interpret this as creating more two-way price potential across GBP pairs, especially where high-beta crosses are involved.
Shorter duration equity index linkages, particularly FTSE-based options, may increasingly deviate from pure industrial sentiment in favour of services-heavy valuations. Rates-sensitive strategies remain less compelling at this stage, given the balancing act between headline growth and production softness. There’s more groundwork to do before proper directional conviction can follow. Still, with volatility still compressed, the incentive lies with finding cleaner entry points rather than loading up on premium early.
The next tier of data—whether confirming growth resilience or showing fresh weakness—will determine whether this modest beat creates real traction or simply resets expectations a shade higher.
In April 2025, Australia reported an unemployment rate of 4.1%, in line with predictions. The employment change revealed an increase of 89,000 jobs, far surpassing the forecast of 20,000.
The report detailed a rise in full-time employment by 59,500 compared to a prior increase of 15,000. Part-time employment also saw a boost, growing by 29,500 from a previous 17,200.
Steady Unemployment Rate And Participation Rate Rise
The unemployment rate remained steady at 4.1%, as predicted, and consistent with the prior figure. A record high participation rate of 67.1% exceeded the expected 66.8% and the previous rate of 66.8%.
These strong employment figures may affect monetary policy talks, possibly easing the chances of a rate cut by the Reserve Bank of Australia in their upcoming meeting. Additionally, the easing of U.S.-China trade tensions might influence these discussions.
The existing data outlines several key developments. Australia’s job market in April posted robust numbers. Employment surged by 89,000 jobs, over four times what had been expected. It wasn’t just quantity—quality improved too, with full-time roles making up the majority of those gains. A rise in the participation rate to 67.1%—higher than the estimate and the prior reading—suggests greater confidence among workers stepping into the labour market. Despite this influx, the unemployment rate held steady at 4.1%, meaning job creation comfortably absorbed new entrants.
Implications For Monetary Policy And Market Reactions
Such data has clear implications for monetary policy expectations. With employment growth exceeding forecasts, and a stable unemployment figure despite a rising participation rate, central bank officials may feel less urgency to cut rates in the near term. Coupled with signs that tensions between the world’s two largest economies are easing, it’s reasonable to expect that rate cut bets could be reassessed in the days ahead.
From our vantage point, this kind of economic momentum often forces re-pricing in rate-sensitive instruments. Near-term yields could reflect shifting probabilities of central bank actions. We’ve already observed that market-implied odds can adjust swiftly even when headline indicators such as the unemployment rate remain unchanged. The strength lies beneath the surface—in the type and volume of jobs added, and the breadth of labour market participation.
That means those who are constantly watching for policy shifts must focus not just on rates but what drives the sentiment behind them. It becomes less about the static figures and more about the direction and consistency of such positive trends. We might see more movement in interest rate derivatives as consensus adjusts. If expectations of policy easing begin to diminish, pressure on short-end positions may build.
Traders further along the curve could be looking for reassessment cues. Any short-lived dip in yields following old assumptions could find itself quickly reversed if these employment trends persist or become the norm. And when participation climbs to new highs, it raises the probability that excess slack in the labour force is being absorbed quicker than anticipated.
Meanwhile, developments overseas, particularly around major trade partners, have to be watched carefully. As tensions soften between certain global players, export conditions and investment flows may stabilise. The spillover to domestic indicators might follow with a lag, but expectations will likely move ahead of hard data.
For now, action hinges not just on fixed figures, but on whether this kind of labour strength continues. Existing positions may require recalibration as each additional data point lands. Pullbacks in expectations for easing could gain momentum unless further soft figures roll in.
Movement in the next few sessions could come from revised positioning based on this high participation backdrop. The more that full-time hiring leads, the less room remains for dovish surprises. Changes in contract pricing may not wait for formal RBA statements if forward-looking participants begin to nudge their stance pre-emptively.
United Kingdom’s industrial production recorded a year-on-year decrease of 0.7% in March. This figure was better than the anticipated forecast of -0.9%.
The EUR/USD pair remained near the 1.1200 mark ahead of Eurozone data and was supported by a weaker US Dollar. Meanwhile, GBP/USD held minor bids below 1.3300, influenced by the UK GDP and Investment data.
Gold prices experienced a decline, reaching the $3,135 area, due to improved US-China trade relations. Shiba Inu maintained levels above $0.000015, despite a market correction linked to a Chinese firm’s investment move.
Market Sentiment Shift
The US-China trade pause shifted market moods positively, influencing risk investments. The dynamics of market fears easing saw risk assets gain traction again.
Foreign exchange trading involves high risk due to potential high leverage, making careful financial assessment imperative. It’s advised that participants understand all the risks and seek independent advice if necessary.
The recent drop in the UK’s industrial production—down 0.7% year-on-year for March—came in somewhat better than consensus expectations. Though still a contraction, the narrower decline compared to forecasts suggests a slightly less adverse outlook for the manufacturing and utilities sectors, which make up key parts of this index. Given how sensitive currencies can be to output data, this marginally improved result helped steady the Pound’s footing, at least temporarily.
With GBP/USD clinging just below the 1.3300 handle, the currency continues to be nudged more by domestic economic releases than broader global momentum. The GDP data didn’t offer enough surprise to spark momentum in either direction, though Investment figures did hold traders’ attention longer than usual—clearly hinting at soft confidence among UK businesses. As we digest this, it’s likely that markets won’t exhibit firm conviction in either direction until labour market and inflation figures join to strengthen or contradict the production trajectory. Until then, option pricing is likely to continue showing mild skew towards protection.
Global Economic Relations
On the continent, the EUR/USD pair’s ability to hover near the 1.1200 area points to limited enthusiasm but also no urgent shift in sentiment. The Euro found stability largely at the expense of the Dollar, more than from inherent internal strength. The softer Greenback, driven largely by cooled rate expectations and some remarks indicating patience from the Federal Reserve, remains the primary prop behind the pair’s resilience. It hasn’t been heavy buying, but there’s clearly hesitation in unwinding long Euro exposures without a firm Dollar catalyst.
Turning to commodities, gold’s downturn—reaching the $3,135 region—was cleanly linked to better sentiment surrounding US-China trade relations. Traders quickly reassessed hedging strategies, reducing safe haven holdings as the likelihood of escalation waned. There’s also been less near-term demand for inflation-linked protection, with core metrics showing containment for now. That said, flows into gold-backed instruments remain sensitive to headline risk, so any tweak in geopolitical temperature could reverse this move quickly.
In contrast, the resilience of Shiba Inu—even while broader digital assets saw corrections—was noteworthy. The token’s ability to stay above $0.000015 despite sideways momentum in risk-on assets shows some basing pattern, possibly influenced by speculative interest and smaller-scale institutional adoption. It’s worth watching how trading volumes behave here: if hold levels continue with low volatility, positions may be cycling into longer-term hands, which creates a kind of platform for future movement.
The shared thread through all of this is the improved mood surrounding bigger-picture economic relations, particularly between Washington and Beijing. That has soothed short-term concerns across asset classes. It’s visible in how credit spreads have narrowed slightly and volatility indexes have retreated. As fears dissipate—at least temporarily—more capital has flowed into assets that carry higher sensitivity to growth assumptions. We’re seeing this in the form of strength in equities, modest support in emerging market currencies, and a downshift in demand for hedges.
None of this should be interpreted as a green light for complacency. The sharpness at which price swings have responded to policy shifts should serve as a sober reminder of just how quickly confidence can disappear if expectations reprice. For now, derivatives tied to FX pairs and commodities are showing a preference for shorter-dated structures with capped upside. That’s telling. The volatility surface suggests we are still in a tradeable range rather than a new medium-term trend.
From our side, we’re focusing more on relative strength and divergences than directional calls. Rotation is happening unevenly, often frustrating trend followers. This environment leans more towards really knowing your risk window—and not overstaying entries that were initially meant to be tactical. Whether it’s through calendar spreads or delta-neutral structures, the trading environment is rewarding those who are positioning for data over ideology.
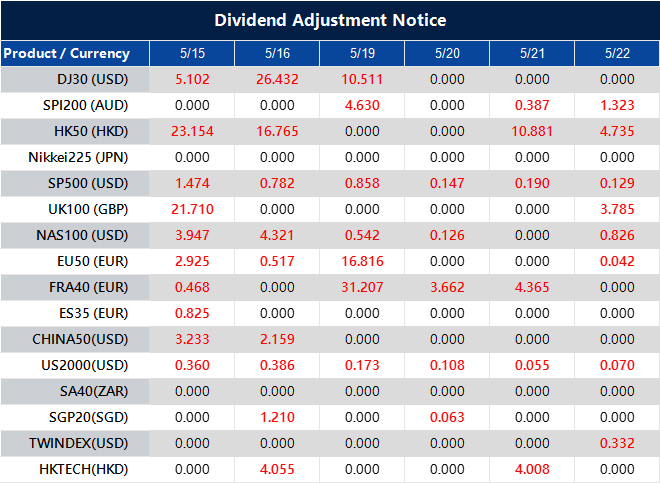
Please note that the dividends of the following products will be adjusted accordingly. Index dividends will be executed separately through a balance statement directly to your trading account, and the comment will be in the following format “Div & Product Name & Net Volume”.
Please refer to the table below for more details:
The above data is for reference only, please refer to the MT4/MT5 software for specific data.
If you’d like more information, please don’t hesitate to contact info@vtmarkets.com.
The People’s Bank of China (PBOC) serves as China’s central bank and sets the daily midpoint for the yuan, also known as renminbi (RMB). The PBOC uses a managed floating exchange rate system that permits the yuan’s value to fluctuate within a certain band around a central reference rate or “midpoint,” currently at +/- 2%.
The previous close for the yuan was 7.2090. The PBOC has injected 64.5 billion yuan through 7-day reverse repos at an interest rate of 1.40%. Today, 158.6 billion yuan worth of reverse repos mature, resulting in a net drain of 94.1 billion yuan.
China’s Monetary Adjustments
This article outlines how China’s central monetary authority—specifically through reverse repo operations and its influence over the yuan—has recently adjusted short-term liquidity. The midpoint mechanism provides a reference point from which the yuan can move within a defined percentage either side, helping to rein in erratic movement while still allowing some day-to-day market flexibility. The People’s Bank set the midpoint and then allowed the market to trade within a narrow corridor around it.
Looking at this morning’s figures, there’s a notable imbalance between the amount reinjected and what’s maturing. While they added 64.5 billion via 7-day reverse repos, maturities tallied over 158 billion, thereby pulling a net 94.1 billion from the system. The shift tells us the central bank’s immediate intent is not to flood the markets with additional cash. In fact, if funding needs were truly pressing, more aggressive liquidity measures would likely have already appeared.
A tighter liquidity stance—mild as it may seem—offers a message: there’s a preference at the moment to manage local rates upward, or at least prevent them from slipping too far. Given the mixture of macroeconomic data coming from China as of late, it’s reasonable that the central bank holds off from overt easing for now.
For those of us following volatility, rate differentials remain key. The PBOC keeping the 7-day reverse repo rate steady at 1.40% for now signals they aren’t yet prepared to pivot toward cheaper funding. The consistency reinforces that they are letting precaution guide moves, rather than any eagerness to trigger broader reflation.
Reverse repo operations are a tool—they give or drain cash from commercial banks to control interbank liquidity on a very short-term basis. When the net is negative, as it is here, it’s a hint that authorities would rather temper potential over-participation using borrowed liquidity, rather than accelerate short-term leverage.
Liquidity Operations At Month End
Now, noting the previous yuan close at 7.2090, there’s a potential for stability combined with a light touch of interventionism. It shows a mood somewhat resistant to letting depreciation fears spiral, but not aggressive enough (yet) to signal a coordinated effort to boost the currency. If we’re tracking implied volatilities and delta positioning, this mild net-drain scenario could result in narrower realised ranges for the yuan unless outside forces interrupt.
Of course, such adjustments are not happening in isolation. There’s timing involved here, falling at month-end when liquidity typically shifts due to settlement demand and bank reserve requirements. Withholding some cash supply now may make sense from a short-term perspective, especially with cross-border capital movement still playing a role in shaping expectations.
The market could interpret the net liquidity drain as aligning with the bank’s broader target of financial discipline. It’s not as if we’re being told growth doesn’t matter, but rather that constraints still carry weight in the current phase—they seem only willing to lean marginally on stimulus tools.
Watching how this balance interacts with US yields and the resulting currency spread will continue to matter. Spreads tightened slightly last week, and with the yuan treaded into firmer territory recently, playing off shifts in midpoint settings becomes quite relevant. Adjustment in repurchase operations informs us of forward momentum—both for positioning and short-term premium pricing. We’ll need to continue charting these flows closely, especially where derivative vol curves react to this push-pull.
It is best to revisit skew charts with these flows in mind and raise sensitivity settings around yuan-forward implied volatility. Staying nimble around hedging structures may help, especially as reverse repo sizes can hint at near-term short-end bias. It’s not always about policy announcements; sometimes liquidity operations carry a louder message.
The United Kingdom’s Gross Domestic Product (GDP) for the first quarter of 2025 exceeded forecasts. The GDP increased by 0.7% quarter-on-quarter, above the expected growth of 0.6%.
The GBP/USD was trading below 1.3300 despite the positive UK GDP data. The pair was supported by a weaker US Dollar amid uncertainties surrounding US trade policies and Fed announcements.
Gold Market Trends
In the gold market, prices continued to decline, reaching a low of $3,135. This decrease was influenced by easing trade tensions between the US and China and reduced expectations for future interest rate cuts by the US Federal Reserve.
In the cryptocurrency market, Shiba Inu experienced a rally despite a previous correction. The increase followed market speculation over a Chinese company’s interest in acquiring $300 million worth of the digital currency.
International trade dynamics between the US and China experienced a positive shift. This was marked by a pause in their trade war, offering the hope that the most challenging market conditions might improve.
That the UK economy grew more than forecast in Q1 2025 gives us a measure of relief, and perhaps a little surprise. A 0.7% quarter-on-quarter rise isn’t staggering, but it’s enough to suggest household spending and industrial output held up better than expected through the winter. Most investors had priced in only 0.6%, giving traders reason to reassess the strength of domestic demand. The beat adds weight to the idea that the Bank of England might show less urgency to loosen monetary policy, at least in the immediate term.
Exchange Rate Observations
Still, sterling didn’t exactly leap higher. The GBP/USD exchange rate remained under 1.3300 even after the GDP release. So what kept the pound subdued? The bigger driver was the US side of the equation — namely, a broadly weaker dollar, which has been on the back foot amid recent hesitancy from the Federal Reserve. Unclear messaging from Powell and company around the timing of any pivot has left dollar bulls without a strong narrative. Meanwhile, the direction of American trade policy under current circumstances has only added to that indecision, dulling appetite for dollar exposure.
At the same time, traders watching gold will have noticed that the shine continues to fade. With bullion down to $3,135, the price action isn’t hard to analyse. Suppose cooler relations between the US and China have rather quickly dampened demand for safe-haven assets. On top of that, expectations are shifting — the Fed is no longer viewed as being in a rush to cut rates, which tends to reduce downward yield pressure and, in turn, makes gold less appealing. As real yields rise, the logic tilts further against holding non-yielding assets like bullion.
The cryptocurrency corner had its own drama. Shiba Inu, which recently came down sharply, staged a recovery. The rebound came not from technicals but on speculation — word spread that a Chinese firm was preparing to purchase a large block of tokens, roughly $300 million worth. We can’t verify every number behind this rumour, but the impact on sentiment was fast and broad. Traders with open exposure in the altcoin universe were left to decide whether to front-run or wait out the volatility. For now, leverage appears to be creeping back into those trades, with implied volatilities climbing across multiple chains.
Global trade, meanwhile, showed faint signs of tilting back towards stability. A notable pause in friction between the US and China triggered mild optimism in risk assets last week. If the two sides manage to keep negotiations from unravelling over the next several weeks, that mild optimism could extend into more aggressive positioning in equity and commodity-linked derivatives. For now, soft indicators suggest some hedge unwinds are underway, though no one seems in a hurry to bet everything on the recovery scenario just yet.
We have observed that positioning across several derivative markets remains relatively cautious, even with the better-than-expected economic signals from the UK and the easing bias in global trade. The key here is not jumping ahead of the data. Event risks, such as central bank minutes and upcoming inflation prints, still carry weight and may cause traders to move in or out proportionally. Forward-looking implied volatility suggests that participants are looking for more clarity before rebalancing seriously.


 | VT Markets")