Back

USDCAD rises against resistance; maintaining upward momentum requires breaking and holding key levels.

The Canadian jobs report for April 2025 revealed an employment increase of 7.4K, surpassing the forecast of 2.5K but following a previous decline of 32.6K. The unemployment rate rose to 6.9%, higher than expected, partially due to an increase in labour force participation. Full-time employment climbed by 31.5K, whereas part-time roles dropped by 24.2K. Manufacturing jobs saw a reduction of 31K, and average wages maintained a 3.5% year-over-year growth.

Amid these figures, USDCAD showed minimal immediate price volatility. The pair continued its upward trajectory after earlier stagnation, breaking previous resistance at 1.38917–1.3904, which has now turned into support. Maintaining momentum above this level is vital to sustain a bullish trend, with any drop below posing a setback for the buyers.

Key Resistance Areas

Attention now turns to the 1.3924–1.3933 resistance area. The pair briefly moved beyond this range but failed to sustain its trajectory. To confirm continued bullish momentum, a stable breakout above this zone is essential. Bulls aim for targets at 1.3977 and further at 1.4000, where significant technical metrics align. Successful groundwork above 1.3933 is needed to pave the way for these targets.

What the earlier section tells us is fairly clear—employment numbers in Canada were slightly better than forecast, but not wildly so. That said, the unemployment rate still ticked up more than anticipated. For us, that signals not weakness per se, but a shifting dynamic in the labour market, with more people entering the workforce than jobs could accommodate in that moment. Full-time roles are on the rise, which is typically a firmer indicator of employer confidence, while the contraction in part-time work may hint at companies pulling back on more flexible arrangements. The materials sector saw a distinct thinning out in manufacturing roles, subtracting volume from an area that’s historically sensitive to growth fluctuations. Wages remain steady, showing that upward inflationary pressure—at least from pay packets—hasn’t flared.

Price action in the currency pair didn’t flinch much upon the release. That itself is telling. When the macro data doesn’t trigger sharp moves, it often means the positioning was well-prepared or focus lay elsewhere. In this case, the technical backdrop held more sway. Price had been rangebound for a period and then decisively pushed above a previously firm ceiling. Once it cleared the resistance between 1.38917 and 1.3904, that area flipped and now serves as a foundation. If price spends time in that band and doesn’t fall back through it with velocity, then there’s likely continued appetite on the buy side.

Preparing For The Next Move

Now the eye shifts to the next overhead test between 1.3924 and 1.3933. There was an upward flick beyond this area—but it lacked the staying power to hold, suggesting that owed more to a short supply of sellers than to committed buyers stepping in. What we look for now is a convincing consolidation above that zone. That would show energy being mustered for another leg up, especially with prior resistance levels now offering structural support underneath.

The upper boundaries of 1.3977 and 1.4000 are not just round numbers; they’re commonly referenced chart points, and we can expect a batch of triggers and conditional orders to be stacked there. Those targeting these levels don’t need to rush, but watching how price behaves near 1.3933 could offer a relatively clear read. If we hold higher lows and start to see volume tilt up, expectations firm. However, should the pair fall back beneath prior pivots and show hesitance to retest them, it may be safer to step aside and reassess.

In short, the approach over the next fortnight should be methodical. Look for signs of commitment—not just reaction. Broken resistance needs to show itself as firm support, and transient breaches without follow-through should be treated with scepticism. We are in a price structure that leans to the upside, but only as long as the base levels do not give way with force.

Create your live VT Markets account and start trading now.

Following Trump’s comments about tariffs, gold rises nearly 1% to surpass $3,335 currently

Gold prices have rebounded, trading above $3,335, following initial losses. Despite a perceived lack of substance in the new US-UK trade agreement, gold has seen a recovery due to market concerns about the forthcoming China-US meeting.

Gold (XAU/USD) saw a near 1.0% increase, climbing above $3,335. President Trump suggested an 80% tariff on Chinese goods, adding uncertainty ahead of the trade discussions in Switzerland.

Saturday’s talks in Geneva, led by US Treasury Secretary Scott Bessent and Chinese Vice Premier He Lifeng, target reducing tariffs to below 60%. Expected progress could lead to tariff reductions as early as next week.

Technical Analysis

On the technical side, resistance points are at $3,336, $3,384, and $3,462, while support is at $3,258, $3,245, and $3,210. These levels indicate key areas for price movements.

Interest rates, determined by central banks, influence currencies and gold prices. Higher rates strengthen currencies but generally decrease gold prices, increasing the opportunity cost of holding gold. The Fed funds rate influences monetary policy decisions, impacting market behaviour and interest rate expectations.

The rebound in gold – now trading just above $3,335 – reflects how investor sentiment can swiftly turn when geopolitical concerns regain focus. Despite early declines, uncertainty surrounding the upcoming China-US talks in Switzerland has provided meaningful support to precious metal prices. One might have expected gold to lag after a rather unremarkable US-UK trade announcement failed to inspire markets. Instead, this recovery highlights how quickly risk appetite can shift on potential shocks from major economies.

It’s worth noting that renewed tensions were sparked by Trump’s mention of an 80% tariff on Chinese exports. While this wasn’t accompanied by policy detail, it unsettled traders enough to increase safe-haven bids. Consequently, attention turns to Saturday’s high-level discussions in Geneva, where Bessent and He aim to bring tariffs below 60%. The possibility – not mere hope – of reductions being confirmed within days adds an element of timing pressure that has likely supported gold’s near 1% rally.

Monitoring Market Reactions

We’ll need to monitor Treasury statements and soundbites post-Geneva very closely. If diplomatic tone softens or a procedural roadmap emerges, markets may start repositioning even before tariffs officially change. Price action in gold will reflect those shifts quickly. In particular, it would be prudent to watch for moves through the resistance at $3,336 – which, in recent sessions, has behaved as a key ceiling. Should trading volumes support a daily close above that level, the next upside targets come at $3,384 and $3,462. Each of these thresholds corresponds to past reaction highs and visible chart congestion.

On the other hand, retracements shouldn’t be dismissed if talks falter. In that case, support around $3,258 becomes the first area of interest, followed closely by $3,245. Only a move to $3,210 would suggest deeper pullbacks and possibly a return to pre-rebound levels. These should not be brushed aside as isolated markers – wide interest from large funds can often cluster around these technical areas, amplifying volatility.

Interest rate expectations remain the key macro driver in the background. The Federal Reserve’s current cycle has seen rates elevated in an attempt to contain inflation; and while that’s generally pressure for gold, shifts in rate forecasts can override the broader directional pull. If market belief begins to solidify around a policy shift – perhaps even in response to weaker inflation prints or stronger-than-expected jobless claims – then gold may find renewed inflows from yield-sensitive traders.

Remember, holding gold yields nothing in terms of coupons or dividends. As such, when central banks raise rates, the opportunity cost of parking funds in non-yielding assets rises. But if there’s even a whiff that the Fed will pivot, or that forward curves soften, we’ve historically seen gold find buyers almost immediately. Traders are positioning portfolios around not just where rates are — but where they’re expected to go.

At this point, it makes sense to stay nimble, especially as volatility around these meetings and rate decisions can spike. Use technical zones to assess potential entries and monitor rate expectations via Fed funds futures and swaps pricing. What happens in Geneva won’t stay in Geneva – markets are listening.

Create your live VT Markets account and start trading now.

Forex market analysis: 9 May 2025

The Japanese stock market index, Nikkei 225, closed at its highest level since 27 March 2025, gaining 1.56% on Friday to end the session at 37,503.33. The move capped a strong week, with the index climbing 1.83% over the shortened holiday stretch and marking four straight weeks of advances.

The broader Topix index surged 1.29% to 2,733.49, logging an 11-session winning streak and marking its longest run since October 2017.

Nikkei rallies as US-UK deal lifts risk mood

Renewed risk appetite drove the rally, following the announcement of a limited trade agreement between the United States and the United Kingdom on Thursday.

Although U.S. President Donald Trump confirmed that existing 10% tariffs on British exports would remain in place, markets welcomed the agreement as a signal of easing protectionist pressure. Optimism extended toward the upcoming U.S.-China trade negotiations in Switzerland, where Trump suggested punitive tariffs on Chinese goods could be reduced from the current 145%.

More positivity in the Japanese financial markets

Traders took the developments as a turning point from the April slump. “The environment not just for equities but for bonds is only getting better as more compromises on trade talks could be possible,” said Hiroyuki Ueno, chief strategist at Sumitomo Mitsui Trust Asset Management.

Japanese equities also found relief in improving earnings sentiment. Despite tariff concerns, firms like Toyota appear insulated from worst-case scenarios, easing investor fears of corporate damage.

Nikkei 225 Technical Analysis

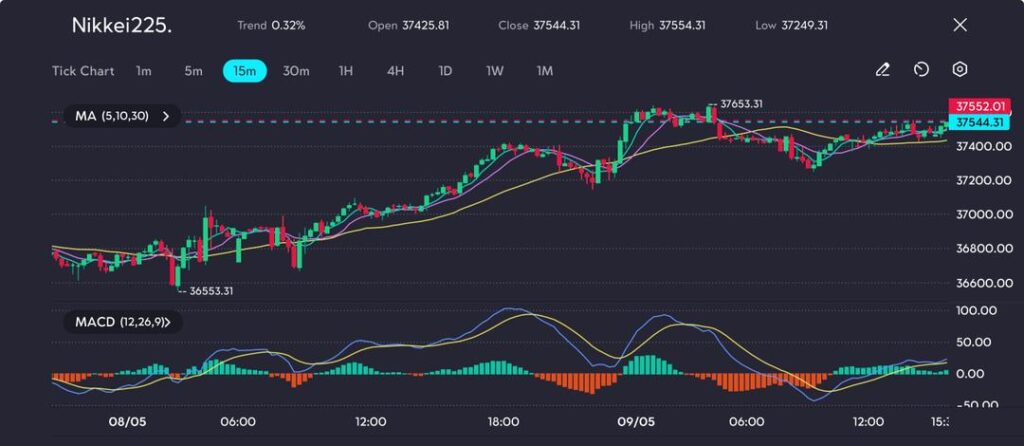
The Nikkei225 has extended its upward momentum after rebounding from the low of 36,553, climbing steadily to challenge the 37,653 resistance level. The index is now consolidating just below that key high, with short-term moving averages (5, 10, and 30) trending upward and providing dynamic support. Price action remains bullish overall, with higher lows forming on each intraday dip.

nikkei-225-vt-markets

Picture: Nikkei225 edges toward 37,653 peak as momentum firms, as seen on the VT Markets app

The MACD histogram has flipped back to green after a brief contraction, and a bullish crossover appears to be forming again above the zero line, which could strengthen the case for another test of the recent high. However, unless 37,653 is broken decisively, the current rangebound pattern between 37,250 and 37,650 may continue to dominate the near-term.

Market outlook

Markets will turn their attention to the U.S.-China talks for confirmation of trade thaw this Saturday. A positive outcome could fuel further gains for equities in Asia and globally. However, traders should brace for volatility if talks stall or fail to deliver concrete tariff relief. The next hurdle for Nikkei lies near 38,000, with short-term support forming around the 36,800 – 36,900 zone.

Click here to open account and start trading.

Barkin remarked on the robustness of consumer spending and business investment, despite declines in restaurant spending and job openings

Consumer spending and business investment remain robust, according to recent observations. Despite this strength, certain indicators show a decrease in activity.

Weekly restaurant spending in Washington DC has declined, reflecting a potential shift in consumer behaviour. Additionally, job openings have decreased, possibly indicating changes in the labour market dynamics.

Observations From Fed’s Barkin

These observations come from Fed’s Barkin, who is not a voting member until 2027.

The current state of consumer resilience, paired with steady business investment, paints a picture of a reasonably healthy economy on the surface. Yet, the recent drop in weekly restaurant spending in the Washington DC area hints at early signs of more cautious behaviour by households. This is not an isolated metric—it often acts as an immediate response barometer to shifting economic sentiment. When dining out slows, it may signal pressure on disposable incomes or an uptick in risk aversion, particularly around discretionary spending.

At the same time, the observed reduction in job openings supports the notion that the hiring momentum seen in previous quarters might be tapering off. A less active labour market, while still far from distressing, may start to soften wage growth expectations. That would feed back into inflation dynamics over the coming months, especially without the push from aggressive consumer demand.

What we’re seeing from Barkin’s comments offers an interpretation rather than a policy guidance, given his current non-voting status. Still, when a regional president with access to local economic data notes these types of subtle shifts, it warrants attention.

Reassessment Of Developments

For our part, these developments suggest a reassessment may be needed. While headline numbers remain broadly supportive, undercurrents are surfacing that deserve consideration. In particular, indicators tied to short-term consumer behaviour and employment data should now be watched more closely.

Short-dated volatilities could encounter pressure if markets begin reacting to weak spots in the broader data cycle. We think pricing models that rely heavily on strength in consumption may need to incorporate new inputs, not just to account for shifting macro themes but also to reflect how swiftly sentiment can change at the ground level—even before it appears in national averages.

There could be more value in week-over-week or intra-month datasets moving forward, rather than backward-looking aggregates. Pricing momentum may lean more heavily on interim indicators instead of historic correlations, especially if the broader market starts to internalise these subtle shifts in real-time behaviour.

As investors digest mixed signals, positioning will require more agility. Those tied too tightly to direct economic proxies without accounting for lag risk or behavioural adjustments may find performance diverging from expectations.

Relative value strategies, particularly those keyed to consumer-sensitive sectors, may also need repositioning as potential recalibrations flow through different corners of the market. We will watch for signs in consumption-linked derivatives and options volume shifts as potential early clues.

Create your live VT Markets account and start trading now.

Despite a corrective wave IV, Lam Research (LRCX) shows continued bullish potential with wave V approaching

Lam Research (LRCX) is maintaining a bullish trend despite a corrective wave IV, according to Elliott Wave analysis. The long-term chart identifies a strong impulsive structure beginning in the early 2000s, indicating further upside potential as wave V nears.

Wave III concluded with a distinct five-wave pattern from the 2009 low, demonstrating strong momentum. Currently, the stock is experiencing a wave IV correction, characterised by a double zigzag pattern denoted as ((W))-((X))-((Y)). Support is at $0.6604, and the bullish outlook remains valid above this level.

The correction presents an opportunity for entry at more favourable prices, rather than suggesting exit. Once wave IV concludes, wave V is anticipated to initiate, potentially achieving new all-time highs, though the timeline remains uncertain.

In the wider market, the EUR/USD holds above 1.1250 but is set to record small weekly losses. GBP/USD is recovering towards 1.3300 amid a stalled USD and US-China trade talks. Gold maintains gains above $3,300, buoyed by geopolitical tensions. Upcoming events include the US CPI report and ongoing trade discussions, with broader market focus on trade negotiations and economic data releases.

What we’re seeing in Lam Research’s structure is a textbook application of Elliott Wave Theory, and it’s unfolding in a manner that aligns with longer-term projections. The prior wave III showed strong extension, and it did so with high clarity—five clear legs from the 2009 low suggest momentum carried by more than just sentiment. That momentum, historically, has not dissipated overnight. Now that the share price has entered a wave IV correction, we expect short-term softness to continue—but that’s structurally needed before a trend can resume.

This wave IV isn’t a deep collapse. Its double zigzag shape ((W))-((X))-((Y)) tells us that the decline is more likely to be a temporary rebalancing rather than a structural top. That support at $0.6604 essentially outlines the boundary—if we stay above that, the bullish model stands. It’s important to monitor how price behaves around that level; a clean bounce or a sideways veer would provide added confirmation. The alternative—breaking sharply below—would compel a reassessment of wave labelling, though that seems limited at present.

Traders focused on derivatives built around Lam’s movement may find more use in timing this correction with long entries instead of avoiding it. Corrections in wave IVs tend to unnerve short-term participants, but that mispricing often provides the edge. If the current shape unfolds fully within expectations, then wave V could begin with considerable energy—wave Vs often mirror or exceed prior wave I extensions when momentum returns.

Elsewhere, the foreign exchange tape has been erratic, though not without form. The euro-dollar holding above 1.1250 underlines strength on dips; however, weekly softness indicates hesitancy ahead of U.S. prints. Sterling is edging back to 1.3300—not on its own strength, though—but on a drifting US dollar, partly influenced by renewed ambiguity over U.S.-China trade developments.

On the metals front, gold above $3,300 gives us a reading of risk sensitivity in the system. A price holding that level during tense geopolitical cycles isn’t unusual; it reinforces gold’s use as a secondary hedge. Notably, it means that the current buyers are not short-term chasers. They’re position-holders awaiting either inflation surprises or unexpected volatility from global data.

In the context of macro signals and order flows, next week’s U.S. CPI release needs to be tracked closely. The expected figure will anchor rate expectations more firmly ahead of the next policy window. Trade developments, especially in response to ongoing tariffs and negotiation frameworks, will also feed directional cues across asset classes.

These are not environments for directionless plays. Implied volatility metrics in rates, FX, and equities remain elevated. That suggests hedging activity is far from neutral, and it means they’ll respond swiftly to data disappointment or surprise.

We’ll need to keep pattern integrity in mind while watching for early signs that wave V in Lam may be preparing to ignite. That would come through strong impulsive moves off support, preferably with volume confirmation. Until then, measured entries on weakness offer favourable reward-risk profiles—not passive holdings.

Hassett believes the UK trade agreement will inspire numerous upcoming deals, maintaining market stability and collaboration

The White House economic advisor, Kevin Hassett, shared insights on new potential trade deals. He mentioned being briefed on approximately 24 deals nearing completion.

Hassett expressed confidence that these deals won’t disrupt markets. He also referenced positive developments in Switzerland, noting mutual respect between parties.

The UK Trade Deal

The UK trade deal is viewed as the model others aim to replicate. Hassett predicted an increase in deals similar to the UK’s in the near future.

Additionally, US President Trump insists on policies such as ‘no tax on tips’, ‘no tax on overtime’, and promoting ‘interest-free auto loans’. Market reactions included slight bids in stocks and USD/JPY.

So far, what’s been conveyed is that Hassett, speaking from the White House, has been optimistic regarding a wave of around two dozen trade agreements that are apparently approaching finalisation. From his remarks, the implication is that these agreements are unlikely to stir any sudden turbulence in market pricing. The reference to Switzerland suggests a productive diplomatic tone, one that likely reassures those watching for frictions rather than progress. His comments about the UK deal, particularly calling it a benchmark for others, underline a desire for continuity and replication in future arrangements.

The President has also reiterated a suite of tax-related proposals pointed directly at consumer incomes and affordability – things like exempting tips and overtime pay from taxation, and supporting borrowing through interest-free vehicle financing options. This signalled a general positioning toward demand support, ideally stimulating spending behaviour through a reduction in household cost burdens.

Market Reactions and Expectations

From markets, the initial takeaway was relatively restrained: steady buying into equities, along with moderate movement in USD/JPY. It wasn’t a full-scale rally, but enough to show that positioning was slightly adjusting in response.

In the near term, we may want to pay close attention to how thin liquidity conditions react to the prospect of broader trade accord announcements. They don’t need to cause immediate repricing, but they’ll lean into sentiment during hours of low volume.

If one or more of those 20-plus trade deals enters the headlines with actual numbers, we ought to see stronger directional bids as models refresh assumptions on GDP and cross-border revenue flows. In particular, market makers are likely to sharpen their hedging profiles quickly if fiscal execution begins to affect consumer channels more directly. Where OTC options markets are concerned, skew may flatten on pairs and equities most exposed to trade-sensitive sectors, particularly where tariffs have dominated pricing for the past two quarters.

Markets in the options space should also mind the endpoints of short-dated IV. There’s a decent chance that long gamma remains supported in light of ongoing policy risk. A surprise statement at an off-hour could be enough to inject temporary vol spikes into already compressed curves. Positioning ahead of US data releases will require sharper timing, particularly on days forecasted for rhetoric from administration officials. It’s not just about whether a deal happens – it’s now instruments reacting to the manner and sequencing in which details become publicly known.

Short puts on industrials, as well as dollar-linked calls on Pacific crosses, have scope for rapid re-pricing if just one of the euro-area negotiations shortcut resistance and gets formalised. Traders should remain aware of the headlines, but structurally exploit backwardation near hedging zones, especially where policy timelines are both compressed and hinge on high-frequency statements.

The preference for non-taxable income ideas, such as what’s been laid out, may see flows tilt toward consumer-driven equities. That could very well shift demand for cheap upside, particularly in sectors like discretionary retail and auto manufacturing. If that narrative sticks, premiums on three-week calls in that space will be squeezed by crowding.

We’ve already picked up on appetite building in low delta expressions for spot-following moves in high-beta banks, most of which trail policy adjustments by one or two earnings cycles. That lag can be helpful when selecting entry points, especially if the catalyst is driven by proposed taxation shifts rather than rate expectation adjustments.

Where bond proxies are concerned, muted inflation fears suggest limited upside to defensive longs in the near term. Instead, sharp exposure to credit products with currency-linked triggers could be timed against statements like the ones we’ve just seen, which hint at demand-tailored support without coordinated rate tightening.

The wider market may appear calm on the surface, but depth is still missing on many options chains. There’s more movement coming as soon as two or three of those deals actually land in final text, particularly if they affect shipping’s regulatory framework or relax holding constraints on foreign capital.

We should not pass over the signals baked into swaps either – the assumption that volatility will remain tame may not hold if something with firm metrics shows up. In trailing markets, where activity is driven by policy paths and bilateral trade revisions, timing is often more influential than even the size of the deal itself.

Better to stay pointed toward the instruments that react first – equities with tight geopolitical exposure, rates at the front of the curve, and cross-exchange currency options that flex under fiscal rotation. More deals are en route. We don’t need to guess when. Just remain aligned with where they’ll most likely hit.

Create your live VT Markets account and start trading now.

After hitting $3,400, gold dipped below $3,300, with attention now on upcoming trade discussions

The price of gold fell below $3,300 per troy ounce, after previously surpassing $3,400, the highest since its record two weeks earlier. This decline followed news about upcoming trade talks between the US and China in Switzerland and the announced trade agreement between the US and the UK.

The drop in gold prices demonstrates how previous increases were driven by the US tariff conflict. The potential for tariff reduction could further impact gold’s value, especially with an agreement between the US and China.

Fed Comments Impact

Compounding this, comments from Fed Chairman Powell cooled expectations for early interest rate cuts. Despite criticism from US President Trump, the comments contributed to the downward trend in gold prices.

What we’re seeing here is a clear reaction to a change in perceived risk and future liquidity conditions. The sharp retreat in gold pricing—from above $3,400 to levels below $3,300 per troy ounce—highlights how much of the recent rally was based on geopolitical friction rather than traditional store-of-value demand. As trade developments between the US and China shift towards dialogue, particularly with meetings lined up in Switzerland, the urgency to hedge against economic uncertainty appears to be easing.

With an additional US-UK trade accord now on the table, markets are positioning themselves ahead of any weakening in tensions. Traders betting on prolonged instability may find themselves needing to reassess, especially if talks produce even a framework for tariff rollbacks. Gold, being sensitive to macroeconomic risk, reacts swiftly when such tail risks begin to shrink.

Powell’s recent remarks added weight to that de-risking sentiment. While there’s no shortage of criticism from leadership circles, the Fed chair’s reluctance to commit to near-term easing quieted any lingering expectations for looser monetary policy in the short term. In real terms, this means a firmer dollar, tighter liquidity, and less incentive to hold non-yielding assets like gold.

Market Reactions

We have to recognise what’s priced in. Expectations of a dovish policy turn had been supporting precious metals throughout the year. Powell walked that sentiment back. With him refraining from confirming any schedule for a rate reduction, there’s diminished scope for a breakout above recent highs—unless, of course, the economic data turns sharply or geopolitical risks re-escalate.

From our standpoint in the derivatives market, this shift changes how we approach the short-to-medium term. There’s less of a case now to lean into strategies built around aggressive bullish momentum for gold. If anything, options activity should expand around lower strike levels. Spreads widened earlier in the quarter can be closed or reweighted in favour of elevated implied volatility, especially should trade headlines resume their back-and-forth nature.

Moreover, while long futures positions may still tempt base-case hedgers, the rationale becomes thinner as reasons for defensive exposure fade. A recalibration of long gamma strategies might be warranted, especially if we see tighter ranges holding in the spot market. Traders focusing on calendar spreads should also monitor key macro release windows, as gradual pricing shifts around Powell’s neutrality tend to show up first in front-month contracts.

There’s also a signal here around positioning and liquidity. When stress factors ease—whether trade risks or monetary signals—the bid for safety unwinds fast. This isn’t a taper, it’s a real-time response to clarity. Gold doesn’t fall in a vacuum; it’s the fading lure of insurance that brings the descent.

Markets have given us a moment to rethink. It doesn’t promise stability, but it adjusts the likelihoods. We watch for confirmation—not just from central banks or trade headlines, but from the structure of how traders are reacting. Right now, there’s no rush to re-enter long gold positions unless fundamentals justify it. And those fundamentals are less convincing than they were just two weeks ago.

Create your live VT Markets account and start trading now.

Nasdaq Futures are expected to remain stable, with potential reversal opportunities based on key levels

Today’s Nasdaq futures are expected to be range-bound amid anticipation ahead of U.S.–China trade negotiations. The current price is 20,200, with key reversal levels to monitor for potential breakouts or reversals.

The central equilibrium zone forms between a developing VWAP of 20,181.5 and a POC of 20,212, suggesting a “fair value” between 20,180–20,210. For a short opportunity, watch the topside reversal zone at 20,326, with a confluence at 20,300. A bullish surprise occurs with two consecutive 30-minute closes above 20,326, targeting 20,570.

A long opportunity exists in the downside reversal zone, with support at 20,075 and 20,060. A bearish surprise happens with two consecutive 30-minute closes below 20,025, aiming for a target of 19,855. Today’s market structure is likely to favour mean reversion rather than trend continuation.

Navigating Key Trading Levels

Trading strategies should adjust based on real-time thresholds and key levels. Both bulls and bears are expected to utilise these outer levels as inflection points. Act on breakouts only once confirmed and remain vigilant. For more updates, visit ForexLive.com, soon transitioning to investingLive.com.

To put the previous section into clearer terms, markets appear to be in something of a calm before the storm. Price action in Nasdaq futures is sitting within a balanced range, with most of the trading hugging a zone from about 20,180 to 20,210. This bracket marks what we’d consider the neutral area—where buyers and sellers appear to agree on value, at least for now. It’s important because in the absence of fresh catalysts, futures tend to hover around such zones, bouncing between known support and resistance until stirred by external forces.

We’re eyeing what happens at the extremes. The upside zone, from roughly 20,300 to 20,326, serves as a line in the sand for stronger buying. If the price breaks and closes above that on two consistent half-hour candles, the path opens up towards 20,570. This would suggest not just temporary enthusiasm but a shift in conviction. Conversely, down below, structure looks to lean on the 20,075 and 20,060 area for support. Should that give way, and price lock in solid closes below 20,025, bears may push the market down to challenge 19,855.

However, the conditions described hint at a lack of urgency from either side—momentum isn’t yet committing. Instead, we’re dealing with a pattern that leans toward mean reversion. That is, moves away from fair value often reverse quickly, reinforcing the middle zone rather than trending away from it. We’ve seen this play out more than once in similar contexts, where price prods either end and then comes right back.

Strategic Approaches for Trading

Under these circumstances, entries should be planned and deliberate. For us, that means avoiding emotional or early positioning. Wait until breakouts meet proper confirmation—two solid sessions above or below the zones highlighted earlier. These setups don’t reward guessing. Acting within an unconfirmed breakout often leads to drawdowns or chop. While it feels tempting to front-run moves, letting price show its hand is usually the more sustainable path in sessions like these.

We notice Powell’s comments, while not mentioned directly in the original summary, are on traders’ radar today. His prior statements have caused markets to turn quickly, so it’s wise to monitor that thread closely. Options pricing and implied volatility levels suggest market participants aren’t yet bracing for a dramatic shift. If that changes, the outer ranges mentioned could see renewed energy.

In practical terms, positions should remain small inside the balance area unless you’re fading with discipline and strict risk levels. Let others take the bait on fake moves. Our approach remains: react, don’t predict. Trading within real-time levels, with confirmation and sensible risk controls, gives more consistency in these scenarios.

One more point to note: these zones won’t last forever. Ranges compress ahead of moves, like a coil winding tight. That doesn’t mean they’re breaking today, but it does suggest picking spots carefully over the next several sessions. Volumes near the extremes are worth watching. More activity at the edges often signals larger players positioning just before expansion, and that’s when you want to be ready—not guessing, but responding to price confirming what the structure already hinted.

Create your live VT Markets account and start trading now.

A slight 0.2% increase in the Euro is observed as it approaches the NA session, according to Scotiabank’s strategist Shaun Osborne

The Euro is experiencing a gain of 0.2% as it enters the North American session, but remains below the 1.13 mark. A brief dip to 1.12 was followed by a robust recovery.

The European Central Bank’s commentary continues to be dovish, with a Governing Council member supporting potential cuts in June. Trade relations have been tense, with the EU preparing retaliatory measures and the German Chancellor advising against individual negotiations with the US.

Key Drivers Of Euro Price Action

The text outlines two key drivers behind recent euro price action: monetary policy direction suggested by the European Central Bank (ECB) and trade relations between the European Union and the United States. The recovery from the mini-dip below 1.12 suggests that markets are quick to respond to even small shifts around monetary guidance, particularly in an environment still digesting the ECB’s tone. Villeroy’s dovish position underscores that the ECB is leaning toward rate adjustments as early as June, a stance that can weigh further on the Euro if markets assign growing probabilities to that outcome.

Additionally, the EU’s posturing in trade discussions, notably Brussel’s readiness for countersanctions and Scholz’s insistence on bloc-wide cohesion, introduces an undercurrent of uncertain sentiment. It’s directed less by data and more by policy mechanics, but the knock-on effects can still be powerful for currencies, particularly in how they converge with trans-Atlantic risk appetite.

In the near term, the Euro appears sensitive to forward-looking commentary rather than realised indicators. Where the US Federal Reserve positions itself relative to the ECB will continue adjusting rate differentials—currently tactically seized upon through intraday squaring and short-duration carry setups. Dealers factoring in a June rate cut from the ECB should monitor movements in fixed income spreads, especially those with five-year tenors, as these typically front-run market pricing.

Strategy And Market Positioning

For strategy positioning, we’ve found that directional exposure to the euro benefits from active management around ECB dates or commentary windows, particularly now, given how rate expectations remain labile. Some of the implied volatility around key strike zones indicates that ranges are still being contested, rather than clear trends being established. This calls for flexible deployment—callbacks or flattener spreads may catch extrinsics better than simple directional bets.

The risk-reward on outright euro longs above 1.13 may not justify itself until we see either unexpected tightening from the Fed or a slowdown in the dovish signalling from Frankfurt. Until then, resting orders or stepping into gamma closer to 1.12 seems structurally safer. The recovery after the dip proves the psychological support at that level is still broadly defended—for now—although the resolve will likely be tested again before the ECB meets.

It’s now more about navigating the edges—precisely because momentum isn’t strong enough to sustain independent runs. Watching bunds and peripheral spreads will help identify whether market confidence aligns with the soft ECB rhetoric, or whether upcoming inflation points derail that thesis. Those trading the short-end differentials should note how quickly events can reprice duration assumptions.

With the euro trading in a relatively narrow structure but responding sharply to guidance shifts, our focus remains on tactical layering rather than building large base positions. This environment doesn’t favour complacency. It rewards reactivity.

Create your live VT Markets account and start trading now.

Williams from the Fed acknowledged the current period of uncertainty and emphasised central bank independence

The New York Fed President Williams noted that the current period is marked by uncertainty and transformation. Central bank independence leads to improved results.

There were no specifics provided regarding monetary policy or economic forecasts.

Central Bank Role and Uncertainty

What Williams essentially communicated is that we are in a period when markets and economies are shifting more than usual, and that the role of central banks – being able to decide policy without political interference – generally results in better outcomes for inflation and employment. However, with no forward-looking statements on interest rates or inflation projections, we are left to read between the lines.

From this, we draw that policymakers remain cautious, opting not to commit to a direction until more clarity emerges from upcoming data. With that in mind, we’ve noticed a temporary pause in policy guidance, which likely reflects a wider internal debate among officials. Sentiment appears to be balancing the risk of restraining credit too tightly with not acting quickly enough if inflation fails to ease further.

Powell’s earlier comments this month hinted that the disinflation process has slowed, and while that doesn’t rule out a rate cut later in the year, it likely rules out one in the short term. The lack of detail in this week’s remarks only confirms that. Pricing in anything aggressive on either side carries risk—we’d recommend keeping exposure light until more precise signals cause repricing in money markets.

From our perspective, traders might consider slower positioning in terms of rate speed or curve steepeners. Implied volatility has been creeping up, and that move isn’t baseless—options suggest positioning for two-sided risks rather than one dominant direction. That aligns with what we’ve seen: the Fed appears comfortable letting time pass without changing rates.

Reactive Decision Making and Market Strategies

The commentary also suggests that we may enter a period of reactive decision-making led more by incoming consumer and labour data than by pre-set paths. Waller spoke last week about needing “more months of good data” before making adjustments, suggesting June meetings may be more about gauging sentiment than making active moves. Following this logic, short-term contracts tied to Fed policy may drift without clear direction.

We increasingly see value in staying nimble, especially in three- and six-month tenors. Those remain sensitive to shifting expectations and have reacted quickly when Fed language moves firmly in one direction. However, in the absence of new signals, a wider trading range could dominate the near-term.

We are also watching speeches for any shift in tone, perhaps further down the committee. Until then, correlation trades and conditional strategies may help reduce exposure to outright missteps while keeping upside on the table. That kind of approach, especially across US-EU spreads, could play out well if divergence becomes clearer.

At this point, technicals look neutral, especially across SOFR futures and swaps. Positions remain modest, and we haven’t yet seen the sort of aggressive repositioning that often precedes a directional move. It’s more about timing and patience now, with an eye on CPI and PCE releases before the next scheduled update.

Create your live VT Markets account and start trading now.

Back To Top
server

Hello there 👋

How can I help you?

Chat with our team instantly

Live Chat

Start a live conversation through...

  • Telegram
    hold On hold
  • Coming Soon...

Hello there 👋

How can I help you?

telegram

Scan the QR code with your smartphone to start a chat with us, or click here.

Don’t have the Telegram App or Desktop installed? Use Web Telegram instead.

QR code