Back

The Swiss president suggests Switzerland is eager for a customised deal with the US negotiations

The Swiss President, Keller-Sutter, has indicated intentions for Switzerland to forge a deal with the United States. She expressed optimism about negotiations, noting the U.S.’s willingness to customise agreements with individual countries. Although tariffs remain paused, the U.S. is keen to expedite discussions.

Switzerland, unlike some countries, does not offer subsidies to its industries. Keller-Sutter revealed that Switzerland now belongs to a select group of nations that undergo faster negotiation processes. This position holds interest for the U.S., particularly concerning how other countries subsidise their industries.

Recent Trade History

Historically, Switzerland has experienced a trade surplus with the U.S., resulting in a 31% tariff on Swiss imports. This rate has been temporarily lowered to 10% until July 8. Excluding gold from trade data significantly reduces the trade surplus between the two nations. Discussions involving gold were pivotal when Switzerland engaged with former President Trump regarding agreements with the U.K.

What we see here is a shift in diplomatic and trade dynamics between Switzerland and the United States, driven, in part, by mutual interest and a broader backdrop of resetting tariff structures. Keller-Sutter’s references to accelerated negotiating timelines suggest that Switzerland is now perceived as a more efficient counterpart when it comes to trade deal formulation. That reflects not only administrative effectiveness but also the relatively uncomplicated nature of its trade framework, owing to the lack of direct industrial subsidies.

This development matters especially because the United States has already signalled — through policy and precedent — a readiness to tailor its trade terms depending on the partner. It doesn’t treat all countries alike, and that opens a window for countries like Switzerland to press for more favourable terms, particularly around tariff levels. We note that a previous 31% rate on Swiss goods has been relaxed to 10% in the short term. But that reduction isn’t set in stone. It’s valid through early July, and there’s an implied understanding that its extension will be tied directly to the progress made in talks.

Now, when gold is stripped from trading figures, the previous trade surplus shrinks considerably, presenting a more balanced picture. That changes the footing for current talks. During earlier discussions under Trump, bringing gold into the conversation helped alter how deficits or surpluses were interpreted — politically and economically. This precedent is likely informing current thinking among negotiators, even if the players involved have changed.

Market Implications And Strategy

For those of us monitoring market fluctuations through the derivatives lens, this pause in tariff pressure offers some temporary breathing room. It’s not without caveats, though. If negotiations stall or if fresh data skews favour towards one side, there’s a risk that tariffs revert. That would be priced rapidly by markets.

Over the next few weeks, we should monitor signal variables — like goods trade breakdowns, especially metal categories, along with any unexpected shifts in import or export permits. Doing so will give a better steer on whether negotiators are moving toward an extension of the lower rate or preparing to let it expire.

Additionally, margin strategies across assets like industrial inputs and niche exporters may need to be rebalanced, particularly around mid-June when pre-deadline sentiment tends to shape options pricing. Watch closely for announcements around ‘technical talks’ — even minor ones. In previous cycles, such leaks have led to repricing within hours.

One thing is clear: if the broader trade narrative escalates or de-escalates, we won’t have long to react. Timing matters more than ever right now, not just in positioning but in response cadence. It’s not about guessing outcomes, but recognising how narrow the reaction windows are becoming.

Create your live VT Markets account and start trading now.

According to Reuters, John Williams from the New York Fed emphasised the essential role of price stability

Fed President John Williams has noted that maintaining price stability is essential, asserting confidence that inflation will return to 2%. He expects economic growth to slow, with higher inflation and unemployment on the horizon.

The Federal Reserve employs monetary policy to maintain price stability and employment. By adjusting interest rates, the Fed influences borrowing costs, affecting the US Dollar’s attractiveness. High inflation leads to increased rates, bolstering the USD, while lowering rates during low inflation or high unemployment can weaken the Greenback.

Quantitative Easing And Tightening

Quantitative Easing (QE) is a tactic used in financial crises, involving the Fed increasing credit flow by buying bonds. This typically diminishes the US Dollar’s value. Conversely, Quantitative Tightening (QT) strengthens the USD by ceasing bond purchases and refraining from reinvestments from maturing bonds.

The US Dollar faced slight downward pressure recently, with the Dollar Index dropping 0.3% to 100.35. The Fed holds eight policy meetings annually, during which economic conditions are evaluated and monetary policies set. These sessions include twelve Fed officials, comprising Board members and Reserve Bank presidents.

Given Williams’ remarks about the anticipated slowing of economic growth, along with a likely uptick in both inflation and unemployment, the forward rate bias is leaning towards a more cautious movement in short-term interest rate expectations. What we’ve seen historically is that when sentiment shifts in this way—towards gradual economic deceleration—volatility can pick up, particularly across rate-sensitive instruments and corresponding options markets.

With the conviction that inflation could still land at the 2% level, despite its current persistence, we interpret this as a signal that rate hikes may be approaching their end, or at the very least, that the threshold for further tightening is rising. That indicates we might be approaching a pause, rather than a pivot, but the distinction is paramount. Traders should not infer a reversal simply because the peak terminal rate appears near. If anything, we should expect policy to remain restrictive for longer, rather than easing quickly, especially if unemployment climbs gradually rather than forcefully.

Current Dollar Behavior And Market Sensitiveness

The behaviour of the US Dollar reflects this temporising attitude. It’s not collapsing, but we’ve noted a gentle weakening—evidenced by last week’s 0.3% decline in the Dollar Index—which implies the markets are reassessing the balance of risks ahead. It seems risk appetite has risen slightly, possibly due to the softer tone across recent Fed commentary, but that should not be read as a green light for speculative leverage. Instead, it highlights how sensitive the Greenback remains to forward guidance and even subtle rhetorical changes.

For options pricing, we should be alert to the current implied volatility levels—especially surrounding upcoming policy announcements. With eight meetings a year, the spacing between these events becomes an environment rich in both opportunity and retracement. Williams’ dovish undertones, compared to earlier in the cycle, tell us that some on the committee may now be less rigid in their commitment to aggressive adjustments. Yet, the inflation mandate remains firmly in place, so no one is likely to backtrack unless core inflation genuinely relents.

QE and QT serve as wider levers that the Fed can pull, and while neither is actively in play at the moment in an expanded form, any mention of shifting balance sheet policy is likely to be highly directional. As we’ve seen in earlier cycles, tightening operations—halting reinvestments or actively shrinking bond holdings—can create upward pressure on yields, reinforcing strength in the US Dollar. For derivative traders, these operations matter directly, as they impact both benchmark yields and implied rate paths.

Currently, with the Fed still allowing assets to run off passively under QT, attention should shift to liquidity conditions in the overnight repo market and the strength of the front end. These are areas where even minute changes cause ripple effects across swap spreads and basis trades. We keep a close eye here, particularly when rate path uncertainty spikes.

As for positioning, we are watching for any signs of unwinding across shorter-dated structures—especially near upcoming employment and inflation prints. Skew in options markets may soften temporarily if markets begin to fully price in the idea that the Fed will not escalate much further. Yet, anyone interpreting this as a tilt towards deflationary risk should reassess, as the Fed remains focused on ensuring that consumer prices do not become embedded above the 2% target.

Unemployment concerns, raised subtly but clearly by Williams, also suggest we could see more two-way risk over coming months. Repricing of job growth expectations tends to filter quickly into rate futures, so traders may want to remain agile in adjusting exposure, particularly if labour market metrics begin to underperform sequentially.

In the meantime, until we see either a data-driven shift or an explicit policy statement indicating a firmer stance, base case scenarios should reflect a sustained, elevated rate environment. Not because the Fed wants to harm growth, but rather because it perceives the cost of moving too soon as outweighing the benefit of patience.

Create your live VT Markets account and start trading now.

Sellers must retain control by staying below 1.1265–1.1275 for bearish momentum to continue

EURUSD has recently broken below a key support area near 1.1256–1.1265, now testing this level again from the lower side. This zone includes the 61.8% retracement level of the range since the 2020 high at 1.1271, as well as the July 2023 high at 1.12754.

This area previously served as a support floor and is a pivotal point for market direction. Remaining below it keeps sellers in control and confirms the downside move.

Earlier today, the pair found support between 1.12007 and 1.1213, an area tracing back to 2024. The current bounce is testing this broken support, now resistance. If sellers hold this ceiling and push below 1.1200, the next major target is near the 50% retracement level at 1.1145.

Key levels include resistance at 1.1265–1.1275. The next downside target is between 1.1200 and 1.1213, while bears maintain short-term control below 1.1265-75. A move above this previous floor could weaken the bearish outlook and allow for potential recovery.

The market has made its intentions reasonably clear. After slipping beneath that tightly watched range near 1.1256–1.1275, price behaviour has shifted, now confirming the former support as resistance. With the 61.8% retracement from the broader move dating back to the 2020 peak sitting at 1.1271, there is considerable technical weight resting in this narrow band. What was once a floor for buyers is now acting as a firm barrier. So far, attempts to reclaim this region have been turned back, suggesting any recovery will face headwinds unless momentum builds strongly above this threshold.

We’ve observed that the reaction from 1.1200–1.1213 has been measured, not impulsive. That support, drawn from earlier this year, offered a pause but not enough to shift sentiment more broadly. The early bounce provides limited encouragement for buyers unless it draws follow-through above the broken band near 1.1275. In the absence of such a push, price may find itself exposed to renewed pressure, pushing beneath 1.1200 and eyeing the next retracement marker near 1.1145.

The narrative is being written through failed rallies. If sellers hold the ceiling intact just above 1.1260, we should expect more probing downward, with 1.1200 becoming less a question of “if” but “when.” Continuation below that line opens scope for bids near the halfway retracement level, which has a technical anchor around 1.1145—not a minor zone, not easily ignored.

There’s a pattern forming in the way price rejects higher levels without much contest. Buyers are struggling to establish anything more than temporary relief, and these retreats from resistance hint that confidence remains with the short side. As long as this continues, every modest lift may serve as another opportunity rather than a reversal.

We don’t need to rely on broad forecasts here. The levels themselves are telling. Support isn’t being strongly defended, and upside attempts are either tired or hesitant. What matters isn’t just where price travels, but how it reacts to returning to broken ground—and right now, that reaction is soft at best. Even if a short-lived rebound appears, without a close above 1.1275, the larger bearish structure stays intact.

This leaves us watching only a few key zones with real conviction. Below 1.1200 brings us into an area where price hasn’t spent much time recently, and liquidity may be less even. Should that unfold, deeper levels may be tested quicker than traders expect, particularly given how limp the upside attempts have been.

We remain cautious of buying too close to resistance. It’s faded doing so more than once lately. Let price do more than just poke above a prior level—let it hold, and let it stay. Until then, positioning should respect the slope, not fight it.

The participation rate in Canada increased to 65.3%, slightly rising from 65.2% earlier

Canada’s participation rate rose to 65.3% in April, slightly higher than the previous month’s 65.2%. This increase shows a minor change in the number of people actively involved in the workforce.

In contrast, the EUR/USD currency pair managed to stabilise above 1.1250 despite potential weekly losses. The pair found support as traders became cautious before the upcoming US-China trade talks.

Gbp Usd Momentum

Meanwhile, GBP/USD gathered momentum, noting an upward movement toward 1.3300. This occurred as market attention shifted due to recent trade discussions and the Bank of England’s recent policy decision.

The gold market, on the other hand, observed increased interest, maintaining prices above $3,300. Escalating geopolitical tensions were a contributing factor, drawing attention as a safe-haven investment.

These movements, when taken together, suggest a market leaning more towards defensive positioning, but with measured optimism in select areas. The slight increase in Canada’s participation rate – from 65.2% to 65.3% – indicates a small uptick in those either working or actively seeking work. It’s not a large movement, yet it’s still enough to point to ongoing tightness in the country’s labour conditions, which, from our perspective, can serve as a modest indicator of economic resilience. The labour market hasn’t shifted dramatically but hasn’t loosened either. For those of us watching options on Canadian data-sensitive assets, it’s worth noting that such a trend might bolster support for the loonie in the near term, especially if wage growth or hours worked accompany this with strength.

Eur Usd Stability

Looking toward the EUR/USD, we’ve seen the pair hold ground above 1.1250, even though there’s been pressure on the euro. Stability at that level points more to dollar hesitancy than euro strength. Market indecision ahead of upcoming trade conversations between Washington and Beijing implies a broader reluctance to take on risk. There are no signs of fresh optimism here – only caution embedded in current pricing. From where we stand, protective positions or range-bound strategies may be more appropriate while the market waits on outcomes from geopolitical catalysts.

Sterling, meanwhile, picked up steam against the dollar, pushing toward that 1.3300 mark. This bounce is partially linked to a shift in focus – nervousness over trade has been temporarily overtaken by reactions to the central bank’s latest guidance. What’s worth watching is the affirmation seen in recent UK data releases, which offered few surprises, something markets tend to reward with calm. In short, there’s been enough stability out of Threadneedle Street to allow for modest gains, though we wouldn’t count on that path continuing without sharper economic developments. We may find opportunities here in medium-dated contracts, with implied volatility levels still pricing in caution.

Elsewhere, in the commodities space, gold’s ability to remain above $3,300 hasn’t gone unnoticed. Fears linked to rising geopolitical friction are once again fuelling the asset’s role as a stabiliser in turbulent times. When uncertainty takes hold, we’ve historically seen gold behave predictably – which explains why it continues to attract attention. While it may look overbought to some, positioning data shows there’s still room for accumulation on temporary dips. For us, this presents a directional opportunity should another round of risk aversion drive further upside, particularly in structured trades.

In short, patterns this week are characterised less by enthusiasm and more by restraint, driven primarily by caution ahead of external political developments and the still-lingering echoes of central bank guidance. While economic data has been mixed, it hasn’t braced markets for volatility, making derivatives an efficient vehicle for managing smaller, targeted exposures rather than outsized directional bets.

Create your live VT Markets account and start trading now.

The USDCHF currency pair struggles within its established range, failing to maintain momentum on breakouts

USDCHF remains contained within a trading range that has persisted since April 23rd. This week, the pair dipped below the range floor at 0.8195, hitting a low of 0.8185, but quickly recovered as momentum faded.

The price then breached the top of the range at 0.8333, reaching a high of 0.83405, yet it fell short of the 38.2% retracement level at 0.83505. This pattern indicates a lack of clear direction among traders, and the 38.2% retracement level needs to be crossed for stronger momentum.

Currently, the pair’s trading range is between 0.8195 and 0.8333, and a decisive break, supported by momentum, may change the market bias. Between the range extremes, the 100 and 200 hour moving averages converge at 0.8253, providing influence in the neutral zone.

Additional support lies between 0.8272 and 0.8280, acting as downside targets and indicators of risk. Key resistance levels include the range high of 0.8333, with a failed breakout at 0.83405 and the next target being the 0.83505 level. Range support remains around 0.8195, with a failed breakout low of 0.8185.

From what we’ve seen thus far, the currency pair has been boxed within a narrow channel for a considerable stretch, with action between 0.8195 and 0.8333 showing little inclination to commit in either direction. The failed breaks—first to the downside at 0.8185, and later to the upside at 0.83405—suggest neither buyers nor sellers hold a clear advantage.

That quick snapback from 0.8185, coupled with the inability to press through the retracement level at 0.83505, tells us there’s hesitation on both ends. The market briefly poked above the range but lost steam before confirming the move. Prices drifting without volume or force tend to snap back like an elastic band. It’s telling. When moves fail to carry forward, it’s usually because conviction is lacking.

What stands out now is the clustering of the 100-hour and 200-hour moving averages near 0.8253. These averages often act like a magnetic field — drawing price in when there’s indecision. This sort of compression between averages and measured ranges builds tension, and tension usually doesn’t last forever.

From our standpoint, until we see a solid push beyond either edge of the range, especially one that follows through past previously tested levels, there’s little incentive to chase aggressive positions. The band between 0.8272 and 0.8280 offers a first line of response if prices drift downward again. If broken, we’d expect attention to turn quickly back towards the broader 0.8195 figure — anything beneath there would change the character of the move.

On the other hand, attempts to climb above 0.8333 will meet resistance from previous failed efforts. If the next leg upward doesn’t clear 0.83505 cleanly, it risks becoming another fade. Those looking to catch breaks higher should treat that retracement marker as the threshold. Otherwise, it’s just another spike caught in the churn.

Momentum matters here—without it, these false starts tell us more than they would in a trending market. We’re watching not only where price goes, but how it gets there. Better follow-through, higher volume, and firm movement beyond these reference levels will be required before we shift positioning.

Until then, the range provides the structure. Let the boundaries do the speaking, and act only when the boundaries stop holding.

The unemployment rate in Canada rose to 6.9%, exceeding the anticipated 6.8%

Canada’s unemployment rate measured 6.9% in April, exceeding the expected 6.8%. This statistic indicates a slight uptick in unemployment figures for that month.

EUR/USD exchange rate holds above 1.1250, although it registered small weekly losses. The pair finds support as US Dollar momentum eases.

GBP/USD progressed towards 1.3300 with recovery signs, driven by temporary US Dollar weakness. This shift comes ahead of anticipated US-China trade discussions set for the weekend.

Gold Prices Above 3300

Gold prices maintained levels above $3,300 amid geopolitical tensions involving Russia, Ukraine, and conflicts in the Middle East and at the India-Pakistan border. Such tensions continue to influence safe-haven demand for gold.

Upcoming events focus on the US CPI report and trade negotiations, particularly involving China. Economic data from US Retail Sales, as well as UK and Japanese GDP, remain in the spotlight.

A UK-US trade deal signals flexibilities on tariffs, though scepticism remains about broader policy changes. Both nations aim to ensure advantageous tariff regulations amidst ongoing global trade discussions.

Foreign Exchange Risks

Foreign exchange trading involves substantial risks, with leverage potentially amplifying losses as well as gains. Considering personal risk tolerance and seeking professional advice is highly recommended when engaging in such trades.

The latest reading of Canada’s unemployment rate, now at 6.9%, edges just above forecasts, suggesting the labour market is responding to current economic pressures, possibly from tighter financial conditions or a cooling demand cycle. Even a minor increase like this can express underlying slack forming in employment participation or business hiring. From this, we can begin to reassess exposure to Canadian dollar pairs—specifically those that hinge on labour strength metrics—since short-term economic productivity and rate path expectations are inherently tied to unemployment movements.

In currency markets, the EUR/USD pair maintaining stability above the 1.1250 figure, despite mild losses, implies that bullish momentum is currently softening without completely dissipating. The resilience here is not random—it’s found in the slight retreat of US Dollar strength, triggered partly by a series of data misses and revised expectations for further monetary tightening. Tactical allocations that depend on dollar positioning may benefit from pausing high-beta exposure to the euro while awaiting sharper US-based data signals.

Meanwhile, the British pound moved closer to the 1.3300 handle against the dollar, displaying trace indicators of recovery. Notably, this movement isn’t due to autonomous strength in the sterling, but rather to momentary frailty in the greenback ahead of high-level diplomatic talks between Washington and Beijing. In such pre-event spaces, volatility tends to compress slightly as traders adopt positioning ahead of potential shifts in flows. While not aggressive, the move offers short-window opportunities to trade supportive narratives on trade-exposed currencies.

In commodities, gold remaining above $3,300 per ounce continues to reflect broad macro uncertainty. Multiple fronts—ongoing geopolitical flare-ups in Eastern Europe and the South Asian subcontinent—are reinforcing gold’s defensive bid. When real yields stay subdued and external risks remain front-loaded, gold tends to preserve a tense but supported structure. Holding derivative positions tied to metals remains viable, but any increase in stability around those zones or unexpectedly hawkish inflation prints could bring fast retracements.

Near-term attention now turns to the upcoming US inflation data, which will likely act as a decisive point for index-linked products and any rate-sensitive derivatives. Alongside that, retail sales will shape consumption-related expectations and offer clues beyond wage figures. For the UK and Japan, GDP figures might affect crosses involving the pound and yen, specifically due to how each central bank is handling late-cycle policy.

Trade-related discussions between the US and China anchor a high-impact calendar into the weekend. From our perspective, positioning on trade-sensitive names and FX crosses ought to reflect this, particularly where leverage is applied. If talks signal progress, even on technical barriers or intellectual property enforcement, we could see fast reactions across risk assets and commodity currencies.

Additionally, the bilateral deal hinting at more adaptable tariff frameworks between the US and UK is worth watching, although actual implementation remains debated. For traders employing macro strategies based on geopolitical themes, the deal’s progress—or lack thereof—could slowly influence sentiment on both sides of the Atlantic, particularly surrounding sectors influenced by transatlantic regulations.

Managing exposure within this environment involves more than just directional conviction—it’s about identifying when sentiment begins to turn without waiting for the headline. Every data point and negotiation wrinkle compounds market expectations and liquidity behaviour. Staying close to the numbers, and how they adjust those expectations in reality rather than theory, offers the most sensible route through the short horizon. Always within the bandwidth of risk appetite.

Create your live VT Markets account and start trading now.

Increased optimism sees US stock indices expected to rise despite ongoing trade uncertainty and inflation concerns

US stocks are poised for an upward start as US and China prepare to meet in Switzerland. President Trump has suggested an 80% tariff, reduced from 145%, which could still lead to inflation and unemployment as small businesses may suffer.

The futures indicate potential gains: Dow up 112 points, S&P up 21 points, and NASDAQ up 95 points. Entering today, the S&P and NASDAQ are slightly lower by 0.40% and 0.28%, respectively. However, both remain above their 50-day moving averages at session lows. For the S&P, this average is 5555.65, while the 200-day moving average target is 5747.76.

Premarket Performance

The Dow industrial average is up 0.12% heading into Friday. In premarket trading: Nvidia shares are up 0.34% and 2.51% for the week. Alphabet is down 0.34% today and 5.94% for the week. Microsoft shares rose 0.36% today and 0.66% this week. Meta increased by 1.01% today and 0.16% this week. Apple gained 0.66% today but is down 3.83% weekly. Amazon shares rose by 0.53% today and 1.11% this week. Tesla gained 1.82% today but dropped 0.83% by yesterday’s close.

What we’re seeing here is an early signal of improved sentiment ahead of diplomatic talks in Switzerland. Markets have latched onto the idea that Washington may soften its previous stance on trade penalties, especially that sharp drop from a proposed 145% tariff to 80%. While 80% remains steep by historical standards, the reduction from prior expectations has cooled some of the harsher inflationary concerns that traders had priced in.

However, the backdrop remains tricky. Tariffs of that size, whether or not they go through, can weigh on small enterprises with thinner margins, often the first to feel the pinch of higher input costs. Inflation then becomes less a question of energy or labour, and more about imported intermediate goods, which can cascade through to consumer prices. Weakness in employment growth could follow, especially if firms begin cutting costs in response.

Now, looking at the broader picture through the futures market, there’s clear interest in buying into strength. The Dow pointing higher by over 100 points reflects a confidence that any policy developments out of Switzerland will err towards a cooling of recent hostilities—although traders should be mindful that no agreement has yet been signed. The early moves in the S&P and NASDAQ, too, bring them back above pullback levels seen earlier in the week. Their holding above the 50-day averages means short-term momentum hasn’t broken down entirely. However, the next resistance level, particularly the 200-day average in the S&P noted at 5747.76, will act as a technical marker for mean-reversion strategies.

Market Rotation and Strategies

We’re also following a noticeable rotation beneath the surface. Walmsley’s gains today, even if modest, demonstrate defensive buying, though a 5.94% slide over the week suggests deeper profit-taking or reallocation might be underway. Meanwhile, the movement in Pichai’s and Musk’s firms, though going in opposite weekly directions, points to shorter-term positioning over longer macro sentiment. The pickup in Bezos’s equity is also worth noting since a consolidation of strength there could pull broader consumer-related sectors slightly higher, given its spillover effect.

Derivatives traders should be watching volatility closely now—this mix of diplomatic uncertainty and technical support suggests a window for intermediate-range positioning but with readiness to unwind quickly. We should be treating support levels as tactical entry zones but not relying on them long-term. Option premiums could move sharply around the tariff decision, and spreads tied to mega-cap tech need adjusting in line with these week-to-date patterns. This includes careful hedging around weekly expiries that overlap with policy updates.

As Powell’s index continues to stabilise above 5555, daily closes and volume around that level may act as a short-term barometer. Algorithmic models may already be recalibrating, so discretionary traders will need to keep firm stops in place. Watching inputs from Geneva, and how quickly bond markets react to any signs of economic weakening, should guide us on whether to lean heavier into growth exposure or reduce it further.

In short, pricing risk correctly over the next week relies on staying close to data, keeping risk lean, and following through on rotations that look durable and not just reactionary.

Create your live VT Markets account and start trading now.

In April, actual employment change in Canada exceeded forecasts by 4.9K, reaching 7.4K

Canada’s net change in employment for April showed an increase of 7.4K, exceeding expectations set at 2.5K. This data reflects a better-than-anticipated outcome, providing insights into the country’s labour market conditions.

In the foreign exchange market, EUR/USD remains above 1.1250, suggesting a potential weekly loss despite recent stability. Meanwhile, GBP/USD is advancing towards 1.3300, recovering as traders focus on upcoming US-China trade discussions this weekend.

Gold prices maintain strength above $3,300 amid heightened geopolitical tensions impacting global perceptions of risk. Safe-haven demand has surged due to ongoing conflicts involving Russia-Ukraine, the Middle East, and India-Pakistan situations.

Focus on Economic Events

Several other economic events are also capturing attention, such as US Consumer Price Index reports and trade negotiations progress with China. Additionally, Retail Sales data from the US, and GDP figures from the UK and Japan remain in focus.

The complexity of foreign exchange trading is high, with significant leverage and risk involved. Thorough consideration of investment goals, experience, and risk tolerance is vital before engaging in such activities. Professional advice may be beneficial for those uncertain about the suitability of forex trading.

The stronger-than-expected change in Canadian employment figures for April — a gain of 7.4K jobs versus the anticipated 2.5K — points to ongoing resilience in the labour market that many had not fully priced in. These numbers signal continued hiring momentum, especially important as inflation expectations and prospective rate paths remain sensitive to jobs data. A tighter labour market could add weight to arguments for firmer policy stances in the near term if inflationary pressures persist, even if growth indicators remain mixed.

Currency and Commodity Market Analysis

In currency markets, although EUR/USD remains above the 1.1250 mark, its weekly trend hints at underlying weakness. We’ve noticed some rebalancing behaviour around key support levels, which may be more telling than the spot price alone. Traders possibly remain cautious due to looming macro releases, hesitant to take on exposure into the weekend. Meanwhile, GBP/USD’s move higher towards 1.3300 signals short-term optimism. While some of the momentum appears to be correction-driven, especially after earlier softness, attention is clearly shifting towards bilateral developments between Washington and Beijing, which hold implications beyond just tariffs and immediate trade flows. Any outcomes from the talks over the weekend could quickly move implied volatility curves, particularly in sterling and Asian currencies.

Gold continues to act as a barometer for geopolitical anxiety. Sustaining prices above $3,300 per ounce signals not just a short-term reaction, but persistent market concern over global instability. Beyond the widely reported Russia-Ukraine front, other areas like the Middle East and South Asia are generalising that worry across different asset classes. Demand for safety is affecting behaviour in options pricing as well, particularly around shorter-term hedges. There’s also been a quiet uptick in open interest in derivative contracts with out-of-the-money strikes, which suggests positioning for tail-risk events rather than ordinary fluctuations.

Turning back to macro data, upcoming US CPI reports are set to influence rate trajectories again. The bond markets, which have been unusually reactive to core inflation surprises, could inject higher volatility into FX pairs closely tied to US yields. UK GDP numbers are similarly impactful this time around, considering present speculation about when the Bank of England may opt to ease. We’re also eyeing Japanese economic output data, which may shape the narrative around the yen, particularly if the growth rebound fails to materialise as strongly as consensus expects.

From our perspective, the coming weeks are likely to demand a more dynamic approach when managing portfolio delta. Monitoring implied volatility in key US and UK pairs, as well as directional momentum in short-tenor futures contracts, seems essential. While some of the macro thematics appear long-standing, their interaction with short-dated options pricing or skew positioning can abruptly change as headline risk unfolds. As ever, understanding position book sensitivity and where gamma exposure lies in the week’s expiry profile will be telling when erratic market behaviour emerges. We see opportunity in spread strategies on narrower crosses and neutral gamma trades around headline events — low convexity profiles that can be managed actively without reliance on binary outcomes.

Create your live VT Markets account and start trading now.

Increased production led Diamondback Energy to surpass earnings expectations, reporting $4.54 per share for Q1

Diamondback Energy reported first-quarter 2025 adjusted earnings per share of $4.54, surpassing expectations and last year’s $4.50. Revenues reached $4 billion, an increase of 82% from the prior year, beating estimates by 8.1%.

The company repurchased $575 million in shares initially and a further $255 million later. It declared a quarterly dividend of $1 per share, payable on May 22.

Production And Pricing

Diamondback’s production averaged 850,656 barrels of oil equivalent per day, primarily oil, up 84.5% year-over-year. The average realised oil price was $70.95 per barrel, a 5.5% decrease from the previous year.

Diamondback’s cash operating cost was reduced to $10.48 per BOE from the previous year’s $11.52. Production and ad valorem taxes increased to $2.98 per BOE.

The company logged $942 million in capital expenditure, focusing on drilling and infrastructure. Adjusted free cash flow was $1.6 billion.

As of March 31, it held $1.8 billion in cash and $13 billion in long-term debt.

The company revised its guidance to reflect recent acquisitions, projecting oil volumes and a capital spending budget lower than previously forecasted.

Strong Earnings Among Energy Companies

Other energy companies also reported strong earnings due to increased production.

Diamondback’s latest quarterly update gave the kind of clarity markets like. EPS came in above both consensus and its own performance from the same period a year earlier. That shows both discipline and consistency, which is rare against such a volatile pricing backdrop. At $4.54 per share, there’s little doubt the firm is operating efficiently, even with slight headwinds in pricing.

Revenue grew strongly, with $4 billion marked—a sharp 82% improvement compared with the same stretch last year. It’s not just growth for growth’s sake either. Markets priced in something lower, so that 8.1% beat backed by fundamentals offers solid justification for the move higher. Importantly, this wasn’t just pricing driving earnings upward. Output was a central factor. A daily average of more than 850,000 BOE means the company completed more wells and got more out of each one.

However, while production increased nearly 85%, oil prices didn’t cooperate in quite the same way. Realised oil came in at $70.95 per barrel, a decent level in context, but down from last year’s numbers. That minor drag hasn’t derailed anything major, but it is worth noting. Margins were preserved in part because costs were cut—cash operating expenses per BOE trimmed by over $1. This likely reflects efficiency from scale and tighter field-level performance.

Additional share buybacks, totalling over $800 million across two tranches, send a direct signal on capital allocation priorities. The dividend at $1 per share on top reaffirms this. For those watching balance sheets, the $1.8 billion of cash and $13 billion in debt speak to a company still deploying capital, but not recklessly. The majority of the $942 million capex went where it should—drilling and infrastructure. That’s what powered the production boost, not one-off inventory sales or accounting quirks.

Guidance has been revised lower for spending and oil volumes, reflecting recent consolidation activity. At first glance, this may seem cautious. But less capital now, following acquisitions, suggests integrated assets are being deployed with restraint rather than overextension. Management isn’t chasing volume for its own sake. Lower activity forecasts plausibly reflect optimisation efforts post-acquisition—integrating rather than speeding up.

Other producers also reported stronger performance, driven largely by output gains. So, we’re seeing more supply, not necessarily reliant on price spikes to maintain profitability. That matters, because supply discipline is one of the few things stabilising derivative markets at the moment.

For now, the tighter rein on spending—paired with robust production and better-than-expected revenue—shapes a backdrop of stable operating leverage. As spread curves shift, and implied volatility reacts to production data and inventory builds, we should focus on how production trends may influence underlying price range expectations.

If production continues to climb while realisation levels soften slightly, it creates a narrower but more stable pricing environment. That may compress tails in near expiries. Both horizontal rig counts and completion efficiency should be monitored. Those will signal whether recent cost improvements can hold, and whether free cash flow projected near $1.6 billion can be sustained, or even bettered, without price support.

With valuation underpinned by buybacks and durable production, pricing sensitivities are unlikely to spike sharply in either direction near term. That means ranges may stay tighter—though extremes still hinge on inventory surprises and macroeconomic shifts. This is a backdrop where structure matters.

Create your live VT Markets account and start trading now.

Week ahead: Global economic turbulence as Trump sets the tone

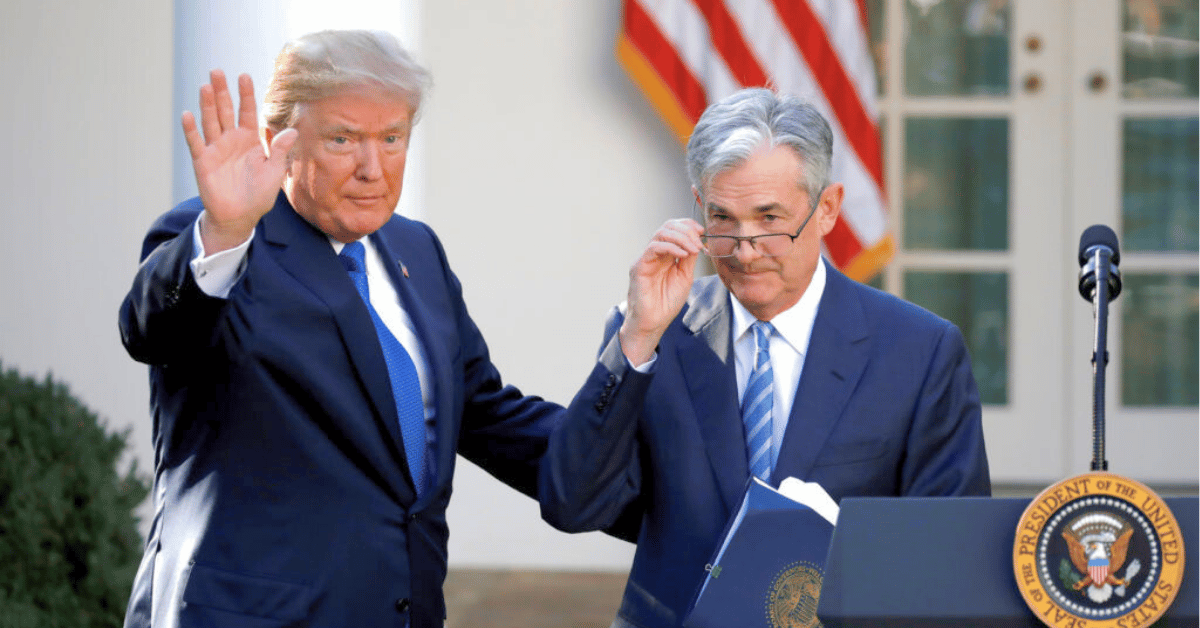
As the financial markets brace for another week of uncertainty, President Donald Trump has once again stirred debate with a series of bold moves. His renewed criticism of Federal Reserve Chair Jerome Powell – calling him “Mr. Too Late” and a “fool” – has put monetary policy back in the spotlight, while his direct call for Americans to buy stocks raises questions about market sentiment.

Beyond the economy, Trump’s push to raise taxes on individuals earning over $2.5 million to 39.6% marks a notable shift in fiscal policy discussions. Meanwhile, his call for a 30-day unconditional ceasefire between Russia and Ukraine introduces a new dimension to geopolitical conversations. As the week unfolds, investors, policymakers, and global leaders alike will be watching closely to see how these developments play out.

KEY ECONOMIC INDICATORS

Trade & Tariffs: Trade deal between the U.S. and the U.K.

  • The U.S. keeps a 10% base tariff on U.K. goods, expands market access, removes tariffs on U.K. steel/aluminum, applies 0% tariffs on U.S. agricultural exports and introduces tiered tariffs on U.K. car imports.
  • The U.S. Trade Representative may enforce actions on imported services.
  • Trump announced a $10 billion Boeing aircraft deal with the U.K.
  • The U.S. Commerce Secretary aims to strike a trade deal with a major Asian country.
  • The E.U. may impose extra tariffs on $95 billion worth of U.S. goods if talks fail.

U.K. Interest Rate

  • The Bank of England cut rates by 25 basis points, but the decision was divided.

Energy

  • U.S. and Russia are reportedly exploring ways to resume natural gas supplies to Europe.
key-economic-events

MARKET MOVERS

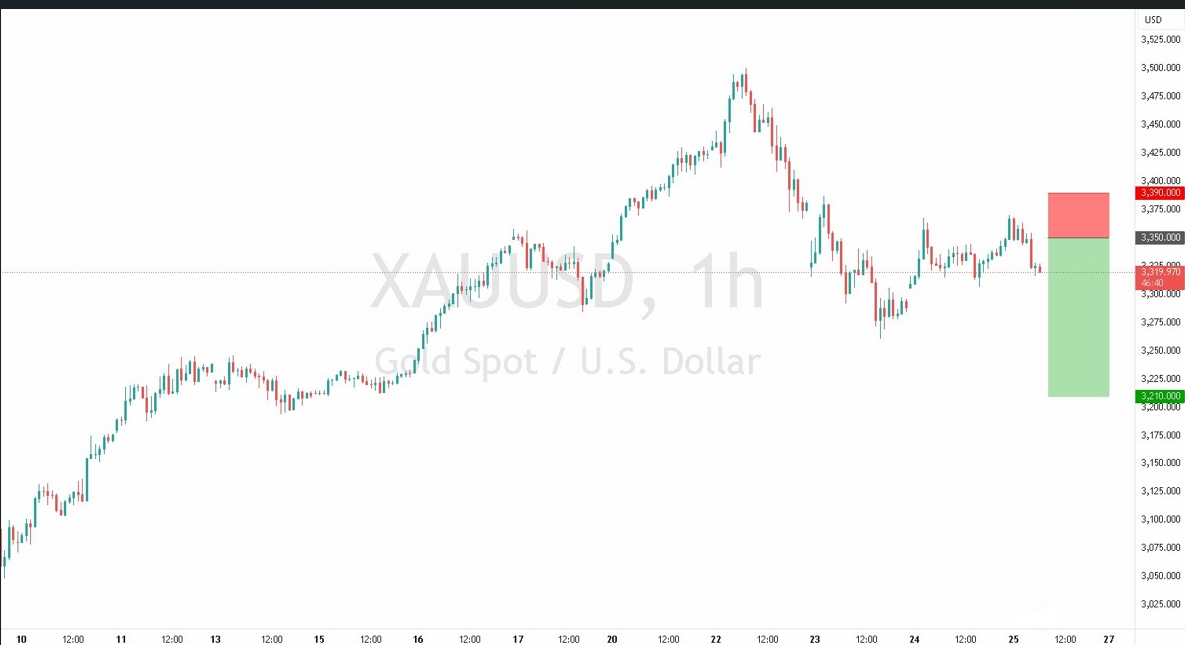
XAU/USD

xauusd-gold
  • Although the bulls are in control, the stalling positive momentum indicates a potential reversal.
  • While a corrective move lower is anticipated, a short-term bounce may occur before the next leg down.
  • Preference to sell into the trend.

Trade Opportunity: Target 1: 3,210 / Target 2: 3,200

DAX40

dax-40-vt-markets
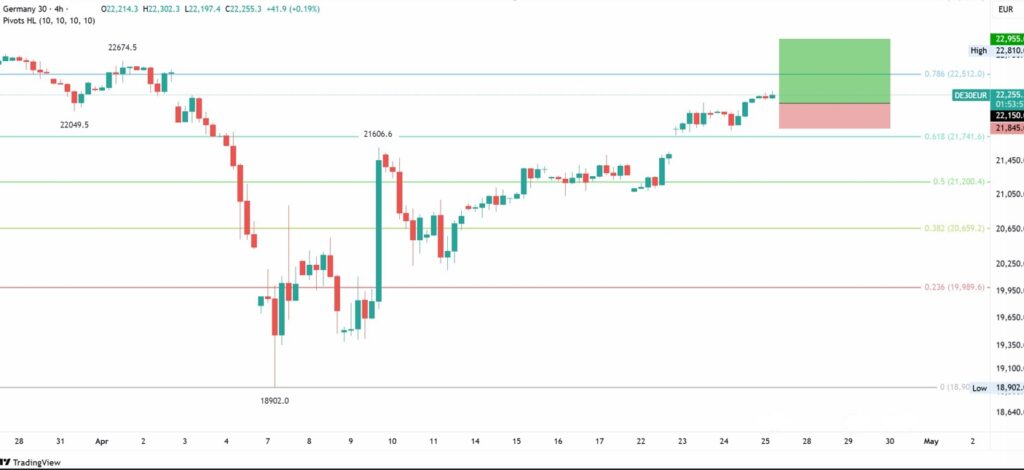
  • Short-term bias has shifted to the upside.
  • Market has posted four consecutive daily gains.
  • No clear signs of exhaustion in the current uptrend.
  • Attractive risk to reward setup for initiating long positions at market.
  • The 20-period 1-hour EMA is currently positioned at 22,150.

Trade Opportunity: Target 1: 22,955 / Target 2: 23,055

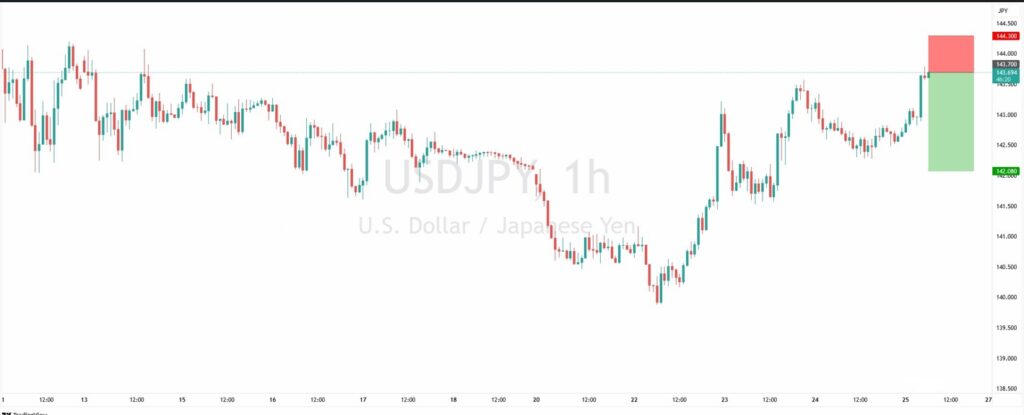
USDJPY

usdjpy-vt-markets
  • Registered modest daily gains, though price action remained within the range of the prior trading day – a sign showing indecision in the market.
  • Resistance is seen at 143.83, aligning with the 261.8% Fibonacci extension at 143.71.
  • While the expected move lower is corrective in nature, it presents a compelling risk to reward opportunity.
  • Medium-term bias remains neutral.

Trade Opportunity: Target 1: 142.08 / Target 2: 141.5

NEWS HEADLINES

Washington’s power play: Trade, treasury and the Dollar

  • U.S.-U.K. trade deal: President Trump announced a “breakthrough” trade agreement with the U.K., aiming to strengthen economic ties and reduce tariffs.
  • Dollar index: The U.S. Dollar Index rose 0.76% to 99.86, the highest level since April 10, signaling strong investor confidence.
  • Treasury Yields: The 10-year yield closed at 4.2740%, reflecting long-term market sentiment, while the 2-year yield settled at 3.7870%, which is more in-line with monetary policies.

Crypto frenzy: Bitcoin breaks $100K, Ethereum soars

  • Bitcoin surged over $5,000 to briefly touch $104,000 for the first time since early February. It was last traded at $102,773.
  • Ethereum jumped 20% on the day, now at $2,172.

Precious metals under pressure

  • Gold dipped 1.79% to close at $3,304.98/oz after touching a low of $3,290.
  • Silver fell slightly by 0.15% to $32.45/oz.

Oil spikes: Trade deal and sanctions fuel market rally

  • Oil prices jumped over 3% due to the U.K.-U.S. trade deal and U.S. sanctions on Iranian oil companies.
  • WTI crude rose 3.99% to $60.22/barrel.
  • Brent crude gained 3.69% to $63.17/barrel.

The Surge in the stock markets: Crypto plays shine, tech giants climb

  • Major U.S. stock indices posted gains, with the Dow Jones up 0.6%, the S&P 500 rising 0.58%, and the Nasdaq climbing 1.07%.
  • Crypto-related stocks led the rally, as Canaan surged 9%, Robinhood advanced 8%, and MicroStrategy gained 5%.
  • Tech giants performed well, with Google (GOOGL) increasing 2% and Tesla (TSLA) rising 3%.
  • The Nasdaq Golden Dragon China Index gained nearly 1%, driven by a 2% rise in Alibaba (BABA).
  • European markets saw solid gains, with the German index DAX up 1.02% and the Euro Stoxx 50 climbing 1.12%.
  • The U.K. FTSE 100 stood out as the exception, slipping 0.32%.

Click here to open account and start trading.

Back To Top
server

Hello there 👋

How can I help you?

Chat with our team instantly

Live Chat

Start a live conversation through...

  • Telegram
    hold On hold
  • Coming Soon...

Hello there 👋

How can I help you?

telegram

Scan the QR code with your smartphone to start a chat with us, or click here.

Don’t have the Telegram App or Desktop installed? Use Web Telegram instead.

QR code