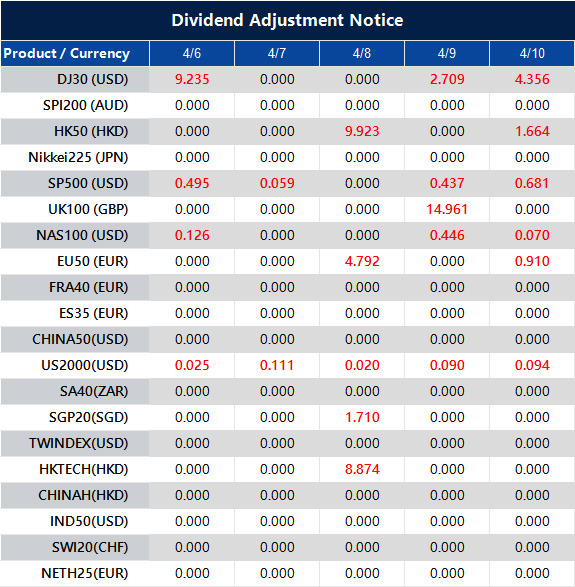
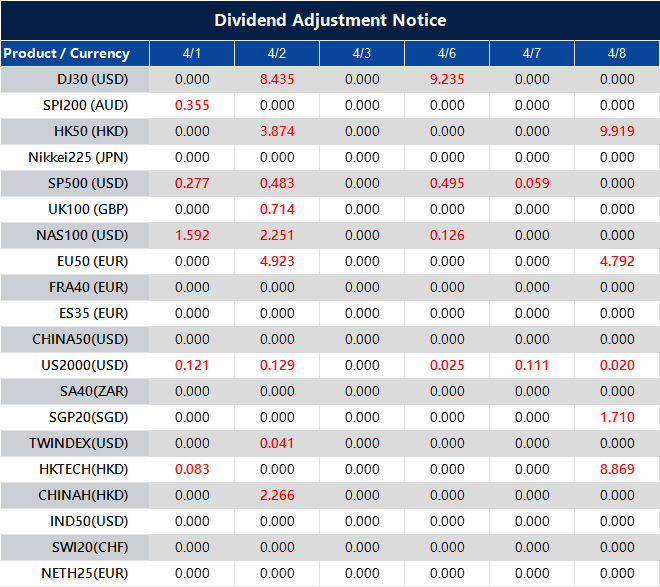
Please note that the dividends of the following products will be adjusted accordingly. Index dividends will be executed separately through a balance statement directly to your trading account, and the comment will be in the following format “Div & Product Name & Net Volume”.
Please refer to the table below for more details:
The above data is for reference only, please refer to the MT4/MT5 software for specific data.
If you’d like more information, please don’t hesitate to contact info@vtmarkets.com.
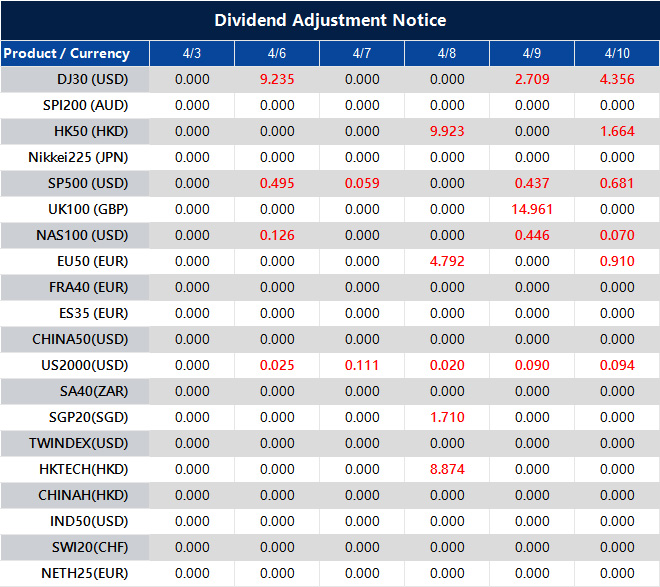
Dear Client,
To ensure fair trading conditions and manage market volatility during major economic announcements, VT Markets will apply temporary leverage adjustments on certain trading products during specific news periods and market opening/closing.
These adjustments are designed to protect clients from abnormal market fluctuations, sudden liquidity changes, and extreme price movements that may occur during high-impact news releases.
1.Products Affected
The temporary leverage adjustment may apply to the following products:
• Forex
• Gold
• Silver
• Oil
• Indices
• Commodities (including XPT and XPD)
2. Adjusted Leverage During News Releases and Market Opening/Closing
During the specified news period, maximum leverage will be adjusted as follows:
Forex: 200
Gold: 200
Silver: 50
Oil: 20
Indices: 50
Commodities: 5
Please note that each product with leverage already below the above will not be affected.
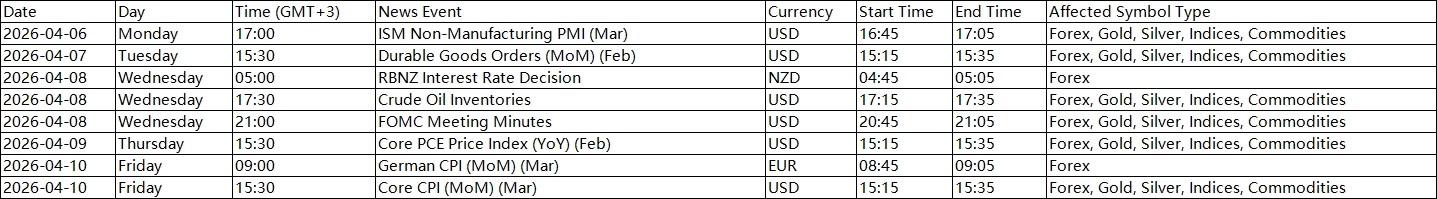
3. News Events That Can Trigger the Adjustment
Leverage adjustments may be applied during major economic announcements including:
• FOMC Interest Rate Decisions
• CPI (Consumer Price Index)
• GDP
• PMI / NMI
• PPI
• Retail Sales
• Non-Farm Payroll (NFP)
• ADP Employment Data
• Crude Oil Inventories
The above data is for reference only. Other significant macroeconomic releases from major economies may also be included.
Please refer to the table below for details of the upcoming events and affected instruments:
All dates and times are stated in GMT+3 (MT4/MT5 server time).
4. Affected Period of News Releases and Market Opening/Closing
Temporary leverage adjustments apply during the following periods:
Economic News Period
• 15 minutes before the announcement
• 5 minutes after the announcement
Market Opening / Closing Period
• 3 hours before the weekly market closing (Friday)
• 30 minutes after market reopening (Monday)
• 30 minutes before daily market closing (Monday – Thursday)
After the above period ends, leverage will automatically return to the original leverage.
5. Important Rules
• The adjustment only affects new positions open during the adjustment period.
• Positions opened before the adjustment period will not be affected.
• Once the adjustment period ends, original leverage will resume automatically.
We strongly encourage clients to take these temporary leverage adjustments into account when planning trading strategies during high-impact economic events.
If you have any questions, please contact our support team: info@vtmarkets.com.
Please note that the dividends of the following products will be adjusted accordingly. Index dividends will be executed separately through a balance statement directly to your trading account, and the comment will be in the following format “Div & Product Name & Net Volume”.
Please refer to the table below for more details:
The above data is for reference only, please refer to the MT4/MT5 software for specific data.
If you’d like more information, please don’t hesitate to contact info@vtmarkets.com.
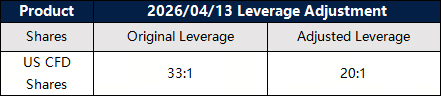
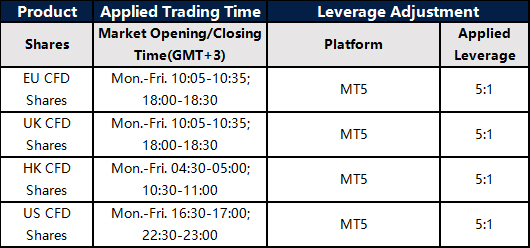
To provide a favorable trading environment to our clients, VT Markets will modify the trading setting of all Shares products. Please refer to the following details:
1. All US Shares products leverage will be adjusted to 20:1.
2. MT5 All Shares products dynamic leverage: New positions opened within 30 minutes before market closing and after market opening will start with a leverage of 5:1. After the mentioned period, the leverage will be resumed to original leverage and will not be adjusted back to 5:1.
The above data is for reference only, please refer to the MT4/MT5 software for specific data.
Friendly reminders:
1. All specifications for Shares CFD stay the same except leverage during the mentioned period.
2. The margin requirement of the trade may be affected by this adjustment. Please make sure the funds in your account are sufficient to hold the position before this adjustment.
If you’d like more information, please don’t hesitate to contact info@vtmarkets.com.
USOil near $100 to $150 keeps inflation risk live and limits room for the Fed.
USDX stays firm as Strait of Hormuz tension blocks cleaner risk recovery.
SP500 remains vulnerable while high oil prices squeeze growth expectations.
BTCUSD still behaves like risk, even as the CLARITY Act starts to reshape crypto.
JOLTS and Non-Farm Payrolls will test whether growth is slowing further.
XAUUSD faces a push and pull between safe haven demand and dollar strength.
The market is not waiting for data first. It is waiting for oil to blink.
The conflict remains the main source of market anxiety. A 15-point peace proposal has been floated through intermediaries in Pakistan, but Tehran says no talks have happened and rejects the plan.
Pakistan says it's preparing to host "meaningful talks" to end the US-Israel war with Iran even as Tehran accuses Washington of secretly planning a land assault while sending messages about possible negotiations https://t.co/lxTTcMOAPHpic.twitter.com/93EKWez9Cc
Iran is demanding full sovereignty over the Strait of Hormuz and a halt to all US-Israeli operations before any dialogue begins. That stand-off is keeping USDX elevated, leaving the S&P 500 under pressure and preventing traders from committing to a clearer risk-on view.
The core macro tension is now easy to spot. Each time peace hopes fade, oil jumps. Once oil holds near $100 to $150, the market stops treating this as just a war story and starts pricing it as a global cost-of-living and stagflation problem.
The Stagflation Trade
The market is no longer treating this as a headline-driven war scare that will fade in a few sessions. It is starting to price the slower damage that comes when conflict keeps energy markets tight for too long.
That is the shift underneath the tape. Each time peace hopes wobble, oil pushes up again. Once crude sits in a $100 to $150 range, the issue gets bigger than geopolitics. It starts to feed into freight, production, food, and household costs. That is when traders stop asking whether there is a war premium in oil and start asking whether the global economy is being pushed into a stagflation problem.
Iran war latest:
– Trump says Iran gave US most of 15 demands to end war – Oil advanced as Houthi militants in Yemen entered conflict – Aluminum stocks soar after two key producers hit – Pakistan is ready to facilitate peace talks – S&P 500 futures, shares in Tokyo and Seoul…
That is also why the mood feels heavy even on quieter days. The market is not waiting for one dramatic escalation. It is watching a more grinding risk build in the background, where growth slows but inflation does not cool in the way central banks would want.
Read more about the movement of oil prices and how it affects the global economy here.
The Fed and Why Risk Cannot Relax
This is where the old market playbook starts to break down. In a normal slowdown, traders would look to central banks for support. In this environment, that support looks less certain because high energy prices can keep inflation alive even as activity softens.
Federal Reserve Bank of Richmond President Tom Barkin said the US-Israel war in Iran threatens to add to already elevated inflationary pressures and clouds the economic outlook at a time when the labor market is fragile https://t.co/z7fIfBrDRW
That leaves policymakers in an awkward position. They may want to lean more supportive if growth weakens, but they cannot do that freely if oil is still feeding price pressure through the system. The result is a market that feels stuck between two problems at once. Growth looks more fragile, but inflation risk has not gone away.
That is why risk sentiment still struggles to settle. Traders are not just nervous about weaker data. They are nervous about weaker data arriving in a world where policy relief may come later and do less when it does arrive.
The CLARITY Act and a Market Still Trading Risk
At the same time, while the old world of stocks, bonds, and commodities is being pulled around by war and inflation fears, the crypto market is being forced into a more formal structure.
On March 20, 2026, Senators Tillis and Alsobrooks reached a compromise on the CLARITY Act around stablecoin yields. The key change is simple. Direct yield earned just by holding a stablecoin, in the style of a bank deposit, would be prohibited for non-bank entities. Yield tied to actual use, such as payments, transfers, or platform loyalty, would still be permitted.
In the short term, that can take some heat out of the market because passive yield had become part of the growth story for parts of crypto. In the longer term, though, it may end up making the space easier for larger institutions to engage with. The compromise draws a clearer line between what looks like a deposit substitute and what looks like usable financial infrastructure.
That is why the reaction is mixed rather than cleanly negative or positive. Some parts of the market may lose momentum first. But the broader framework becomes easier to defend if the rules are firmer and the biggest objections from the traditional banking side start to fade.
Key Symbols to Watch
USDX | USOil | BTCUSD | SP500 | USDJPY
Upcoming Events Table
Date
Currency
Event
Forecast
Previous
Analyst Remarks
30 Mar 2026
USD
Fed Chair Speaks
–
–
Tone matters more than guidance while oil drives pricing
31 Mar 2026
USD
JOLTS Jobs Openings
6.90M
6.95M
Softer labour demand could dent USDX after a strong run
03 Apr 2026
USD
Non Farm Employment Change
56K
-92K
A weak rebound would deepen the growth scare
03 Apr 2026
USD
Unemployment Rate
4.40%
4.40%
Any rise would add pressure to equities and risk FX
For a full view of upcoming economic events, check out VT Markets’ Economic Calendar.
Key Movements Of The Week
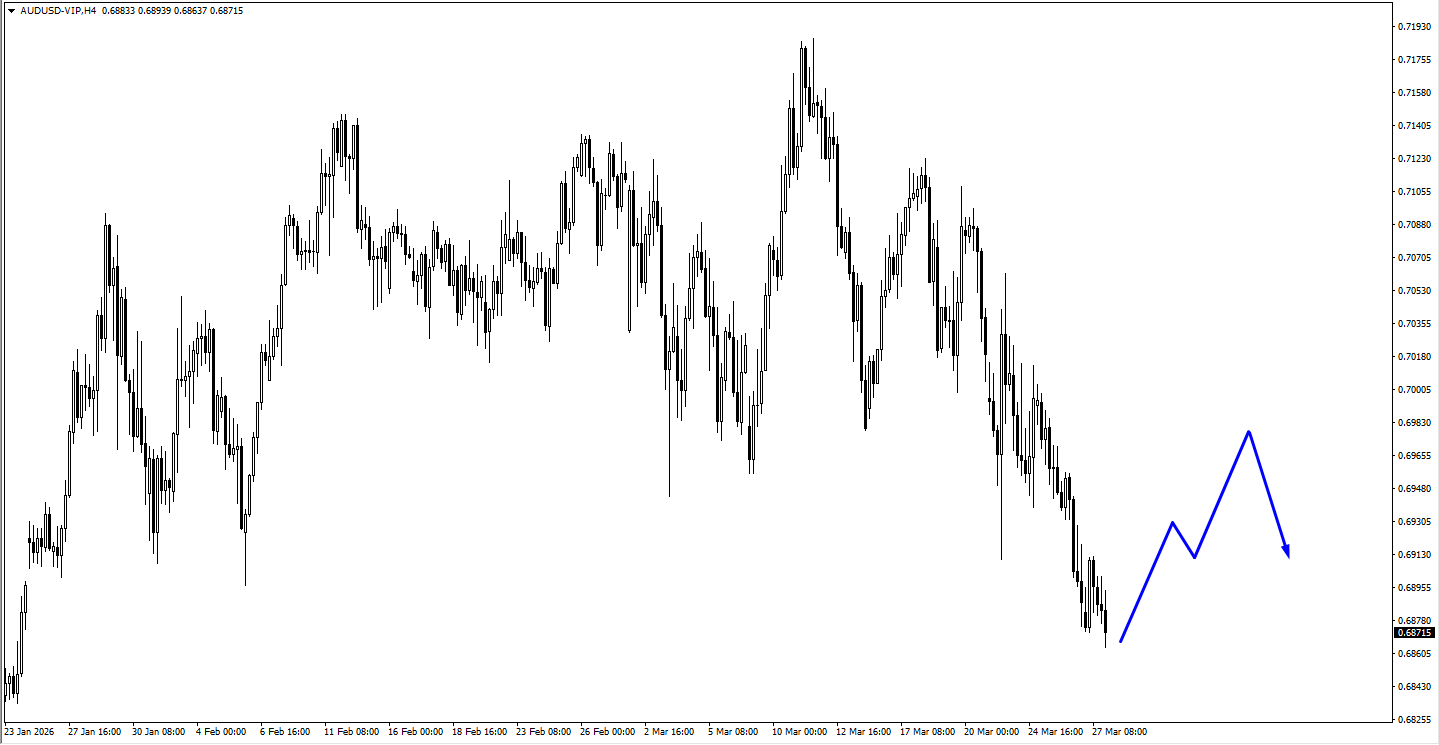
AUDUSD
AUDUSD has already broken 0.68965, which keeps the near-term structure tilted lower.
AUDUSD now needs to consolidate before another move down can develop cleanly.
AUDUSD remains exposed while USDX stays firm and the market leans defensive.
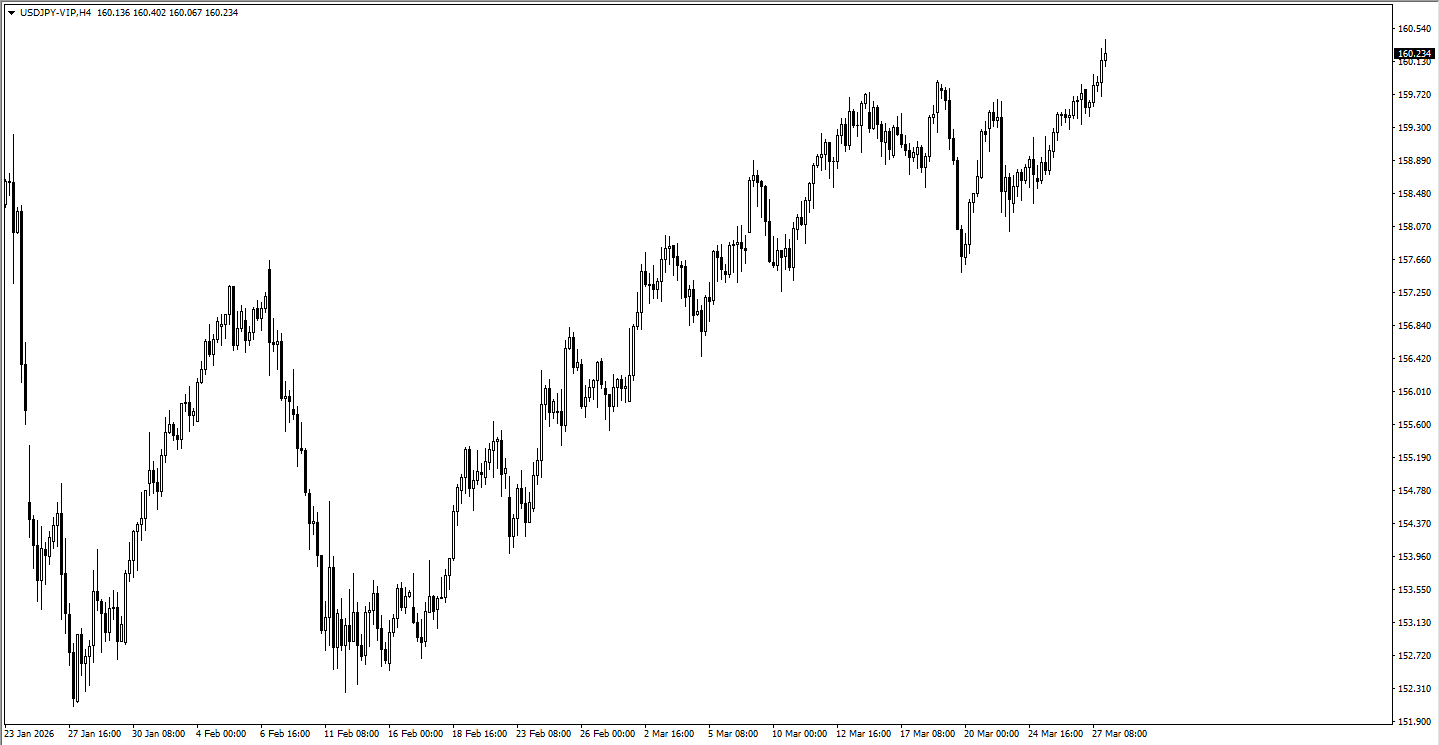
USDJPY
USDJPY broke above 159.89 and then cleared the 160.00 handle.
USDJPY is now trading in a follow-through zone, with 161.943 as the most recent high.
USDJPY can stay supported while the dollar holds up, though the pair is entering a more sensitive area.
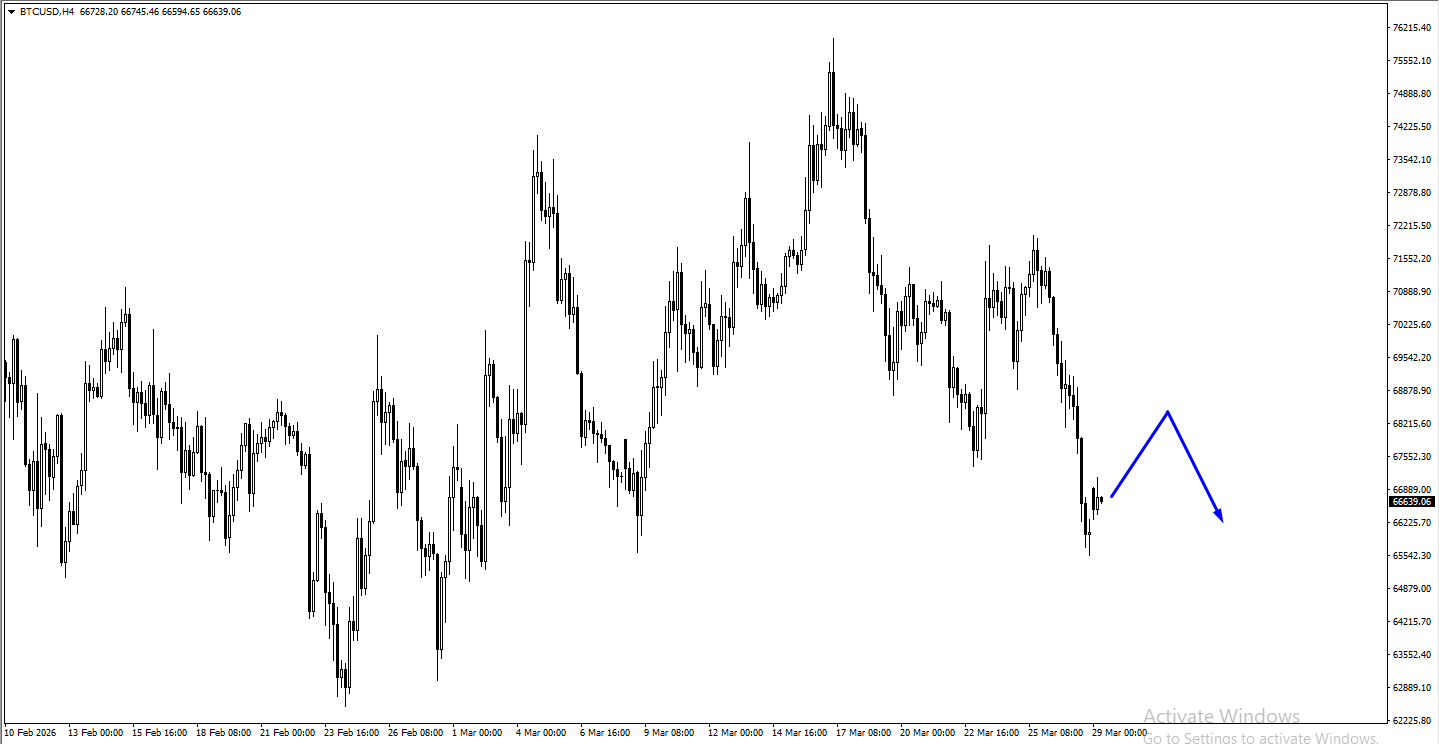
BTCUSD
BTCUSD is sitting at a crucial area with 2 possibilities now in play.
BTCUSD could move higher first, but the rally needs to be impulsive and buying should be dialled down above 74,000.
BTCUSD risks another leg lower if it turns into consolidation, with 60,502 the deeper downside level.
BTCUSD still carries an overall downward bias unless price breaks higher with force.
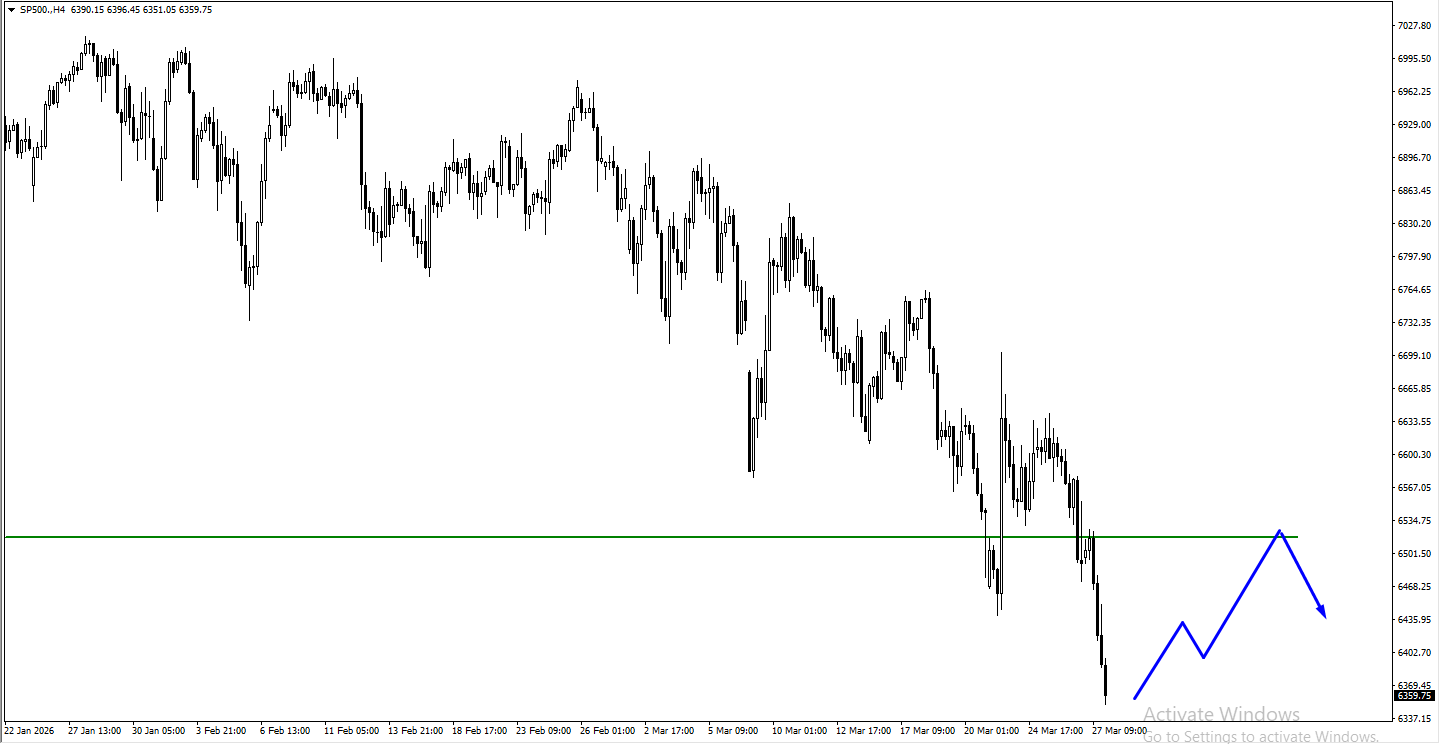
SP500
SP500 has already turned lower as sellers regained control.
SP500 still looks vulnerable if the next move is another consolidation phase.
SP500 remains tied to oil, growth fears and whether the Fed stays trapped by inflation.
Will April Bring A Turning Point?
The next date hanging over the market is April 6. That marks the end of the current 10-day tactical pause on strikes against Iranian energy plants. The working assumption in the market is that April could bring a more decisive turning point, even if that still falls short of full peace.
There is also a harder military and economic logic behind that view. One-third of Iran’s missile stockpile is said to be destroyed, another third buried or damaged.
The presence of the 31st MEU, with 3,500 Marines aboard the USS Tripoli, adds to the sense that pressure could ramp up quickly if talks fail. At the same time, there is a very clear economic incentive in the background, which is the push to get Brent crude back below $80 a barrel.
That leaves the market in a familiar place for now. Traders can see the outline of a possible endgame, but they still do not know whether it brings de-escalation, a harder strike phase, or a slower proxy conflict that drags through the rest of 2026.
Create a live VT Markets account today to access our platform features, including market insights and educational content.
Trader FAQs
Why is Oil More Important Than Data Right Now?
Because oil is shaping inflation, growth and rate expectations at the same time. That makes it the market’s main transmission channel this week.
Why is Bitcoin Still Weak if Regulation is Improving?
Because the short-term macro backdrop is still tight. CLARITY Act progress may help later, but for now BTCUSD is still trading like risk.
What is the Main Market Risk This Week?
The main risk is that oil stays elevated while US data softens. That would deepen the stagflation trade and keep pressure on equities and risk assets.
Please note that the dividends of the following products will be adjusted accordingly. Index dividends will be executed separately through a balance statement directly to your trading account, and the comment will be in the following format “Div & Product Name & Net Volume”.
Please refer to the table below for more details:
The above data is for reference only, please refer to the MT4/MT5 software for specific data.
If you’d like more information, please don’t hesitate to contact info@vtmarkets.com.