Back

Bessent anticipates a Trump-Xi call soon, suggesting tariffs can revert to previous levels if needed

A potential call between Trump and Xi could occur in the coming weeks or months. This may precede any face-to-face meeting between the two leaders.

Trump previously considered an 80% rate as insufficient for a Chinese embargo, proposing a return to the 54% tariff level from 2 April. Discussions may extend beyond the current 90-day timeline unless negotiations between both parties break down.

The 90 Day Timeline

The 90-day period is seen as an initial phase, with the possibility of extending it if needed. There is speculation on whether delays might lead Trump to lose patience if no progress is made.

Trade sentiment remains tethered to official cues, with timing and tone now playing a larger role in shaping expectations than sheer content. A potential conversation between the US and Chinese leadership has not yet been scheduled, but the suggestion alone triggered a slight stir in short-dated positions linked to tariff-sensitive sectors. The market response was not abrupt—rather, it showed early signs of recalibration, especially in December contract volatility.

Trump’s prior remarks regarding rollback figures, particularly his dismissal of the 80% proposal in favour of the earlier 54% rate, suggest that bargaining room on tariffs may continue to narrow. Investors should be wary of reading too much into short statements; the tendency to float trial balloons complicates outlook-building. Lighthizer has shown a preference for fixed structures over moving goalposts, and that steadiness tempers the more erratic signals seen elsewhere.

The Implications Of Extensions

The 90-day period, initially laid out as a cooling-off phase, functions more like a checkpoint than a final deadline. Concerns that this window might close without delivering outcome are no longer abstract. If public language from White House officials remains ambiguous, time decay on options will mirror indecision. We’ve already seen implied volatility climb at the first hint of delay, which tells us positioning continues to shift with headlines rather than fundamentals.

There is a growing chance the period could be extended quietly, especially if talks appear to have traction but no closure. What we’ve observed so far is positioning that reflects not only uncertainty but an active adoption of hedges favouring unmanaged risk. Structural bets on longer-term détente haven’t yet returned in the way they did last cycle—likely due to scepticism over whether enforcement mechanisms will materialise.

For our part, we’ve taken signals directly from bid-ask moves in the early January strips. The shortening of exposure windows, particularly in FX-linked derivative products, indicates heightened sensitivity to White House mood swings. Market-makers responded more quickly than expected, rebalancing order books to anticipate higher-frequency shifts in direction.

Mueller’s continued backdrop adds an element of unpredictability. While not directly tied to tariffs, the pressure in Washington translates into sporadic policy gestures, some of which feed back into trade strategy. Navarro remains a vocal figure, but his influence over timing appears diluted. Industry groups haven’t weighed in publicly in recent sessions, although their pressure behind closed doors could impact the next trade announcement.

Anecdotally, the bid for downside protection in emerging market proxies has crept upward. That’s partially explainable by rotation out of safer assets as traders seek yield, but it also reflects broader discomfort with the idea that any thaw might end prematurely. The narrative around progress remains speculative, yet enough friction persists to drive cautious positioning across the board.

Markets now wait not for what’s said, but for how long it takes to say it. Traders should avoid relying on calendar expectations and watch for verifiable outcomes instead. Deviation from timeline norms serves as a better gauge of momentum than any statement from either side. Tensions may not resolve quickly, but measurable shifts in volume and spread behaviour offer more reliable clues than optimistic language.

Create your live VT Markets account and start trading now.

The US Dollar strengthens against G10 currencies due to easing US-China trade tensions and market adjustments

The US Dollar is gaining strongly against the G10 currencies. This follows the reduction of tariffs by the US to 30% and China to 10% for 90 days, allowing more time for negotiations.

The Japanese Yen and Swiss Franc are underperforming, falling nearly 2% against the US Dollar. The Euro has dropped nearly 1.5%, with the Swedish Krona and British Pound down around 1%. The Canadian and Australian Dollars are faring better, each declining only 0.3% against the US Dollar.

Risk Appetite and Yield Movements

Equity markets in Asia and Europe show strong risk appetite, with US futures up by 3%. The US 10-year yield is climbing to 4.45%, from above 4.15% on April 30. The US 2-year yield is up by 11 basis points, reflecting changing expectations for Federal Reserve rate cuts.

Commodities see West Texas Intermediate oil pushing towards $75 per barrel after bouncing from $55. Copper remains flat, and gold prices decline, threatening a dip below $3200. The week includes US budget balance data, CPI, and retail sales figures. Federal Reserve officials, including Chair Powell, are scheduled for speaking engagements.

With the US Dollar pressing higher across the board, the recent rollback in trade tariffs serves as a supportive backdrop. Washington’s decision to lower levies to 30%, while Beijing scales back its own to 10% for a 90-day pause, acts as a de facto truce. This breathing room has lifted broad market sentiment. It is not a resolution, but it does reduce short-term uncertainty—something markets appreciate. We are seeing that reflected in the heightened appetite for risk assets.

Currencies traditionally sought during periods of market anxiety—namely the Japanese Yen and Swiss Franc—have lost ground rapidly. Nearly 2% lower against the Dollar, the drop speaks more to an unwinding of defensive positions than to an economic reassessment of those countries. The Euro’s slide, by contrast, edges closer to 1.5%. That marks a catch-up move with its own set of economic doubts layered over stabilising energy dynamics. Another notch down leads us to the Swedish Krona and Sterling, which both dipped by around 1%. The pullback there points to increasingly constrained central bank flexibility and widening growth differentials.

In contrast, the Canadian and Australian Dollars are bending but not breaking. Their losses of 0.3% suggest markets still expect resilience, particularly with commodity-linked assets holding up relatively well. Oil’s rebound—now challenging $75 per barrel from the recent dip at $55—is helping to steady both of those currencies amid broader Dollar strength. Copper remains unmoved, which puts a lid on any speculative enthusiasm. And then there’s gold—under pressure. Now teetering closer to the $3200 threshold, the metal’s decline signals that real yields may continue to rise and remove some of its allure as a hedge.

Powell and Policy Implications

Yields on the US 10-year benchmark are marching upward again, now nested around 4.45%, which was barely above 4.15% just two weeks ago. More interestingly, the 2-year note has firmed by 11 bps in just a few sessions. This type of move in short-dated yields points to a reevaluation: the market has begun pulling back from the idea of multiple rate cuts this year. The data calendar is partly responsible. With CPI, US retail sales, and the national fiscal balance all landing this week, there is no room for soft hands. Calm today could be under review tomorrow.

Powell and fellow policymakers are now stepping into the spotlight. What might have been seen as guidance a fortnight ago will now be parsed word-by-word for bias and shift. If they stick to a script that nods to sustained inflation exposure—rather than hinting at easing—the Dollar move has further to go. Particularly if rates expectations are more stubborn than previously expected.

From where we are, several takeaways are beginning to crystallise. Stronger equities, a bid in commodity-linked currencies, and flat-to-rising short yields imply reduced appetite for expecting lower US rates soon. That has to factor into positions. Dry powder should be kept available, as the rerating may not be over. Watching CPI and retail numbers isn’t optional—it will inform how deep or shallow any adjustments need to be. The tone of upcoming speeches may shape the front-end of the yield curve far more than technicals can. Markets are running, but conviction isn’t cemented. This isn’t a trend locked in. It’s a trajectory that’s gathering feedback.

Volatility surfaces for FX, rates, and commodities must be re-evaluated. In the coming sessions, overshoots and reversals will challenge stale positioning. The Dollar’s directional bias is pronounced, but not without speed bumps. Those are best managed with tighter hedging strategies and a more nuanced read on short-term risks. Yield curves, asset correlations, and term premiums are re-aligning. We should expect sharper responses to data and remarks, particularly as they challenge or confirm this new pricing regime.

Create your live VT Markets account and start trading now.

Forex market analysis: 12 May 2025

The Australian dollar, being commodity-linked by nature, received some strength with the Chinese exports rose 8.1% in April year-on-year, climbing to 0.6407 on Friday. Still, the AUDUSD pair remains poised for a 0.7% weekly decline, snapping a four-week winning streak amid shifting interest rate expectations and renewed U.S. dollar strength.

On the other hand, the New Zealand Dollar also slipped, falling 0.2% to 0.5892, extending its weekly decline to 0.9%. A break below 0.5894 marks a bearish signal, though support lingers near the 200-day moving average at 0.5882.

Technical Analysis

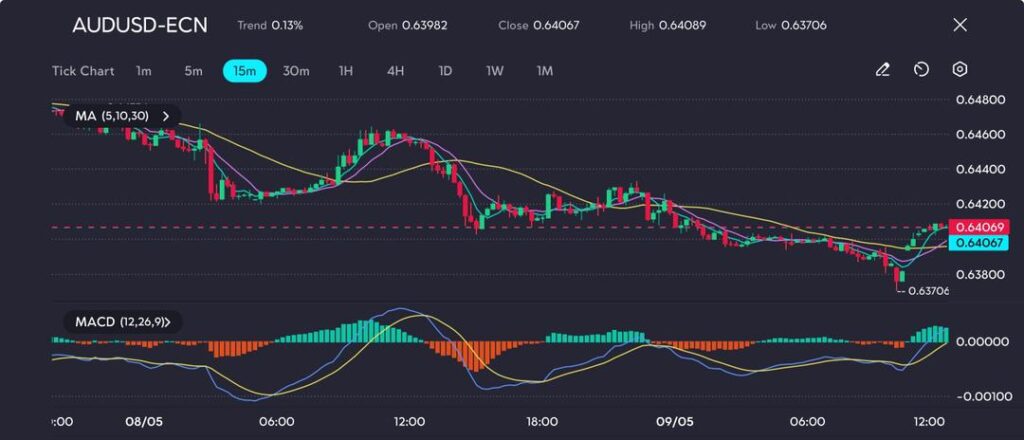
AUDUSD drifted lower throughout the session, touching a low of 0.63706 before staging a modest rebound. The MACD histogram has flipped into bullish territory, with a fresh crossover just as the price began reclaiming ground above the 5- and 10-period moving averages. The short-term recovery appears constructive, but overhead pressure remains near 0.64100–0.64200, where the 30-period moving average and prior support-turned-resistance converge.

audusd

Picture: AUDUSD bounces from 0.6370 low with MACD turning bullish, but 0.6420 remains key near-term hurdle, seen on the VT Markets app

For bulls to gain meaningful traction, the pair needs to break and hold above 0.64200, otherwise this may be a corrective bounce within a broader downtrend. A drop back below 0.63900 could see momentum reset toward the week’s low.

Global macro picture: Interest rate of the USD and tariff announcements

Behind the scenes, a hawkish tone from the Federal Reserve has scaled back bets on rate cuts this year. Market pricing now implies just 68 basis points of easing in 2025, down from 78 bps a day earlier. This has lifted the dollar across the board, with AUD and NZD underperforming.

President Donald Trump’s trade pivot also drove sentiment. While the Fed held rates steady, Trump’s announcement of a U.S.-UK trade deal and commitment to maintain Chinese tariffs has introduced volatility ahead of the U.S.-China meeting.

Cautious outlook for the Aussie and Kiwi

As such, rate cut expectations remain firm for the Reserve Bank of Australia, with markets fully pricing a 25bp reduction to 3.85% on May 20. Across the Tasman, the RBNZ is also expected to ease, with Westpac forecasting two cuts this year, citing persistent trade-related headwinds.

The Aussie may continue to hover below 0.6450 ahead of economic data and central bank expectations in this coming week. A downside break below 0.6370 could retest 0.6320, while trade optimism could offer temporary support near 0.6410–0.6425. Traders remain focused on tariff developments and Fed policy cues for direction.

Click here to open account and start trading.

Bessent believes tariffs on China are unlikely to drop below 10%, maintaining current levels as a guideline

The current level of tariffs is seen as a baseline, with measures to prevent further escalation now established. The United States imposes a 10% base tariff on China, supplemented by a 20% tariff related to the fentanyl issue, making a total of 30%.

There is no restoration of the de minimis exemption despite the tariff adjustments. On the other side, China continues with a 10% base tariff on the US, and there has been no relaxation on its previous restrictions on rare earth exports. The ceiling for China tariffs is set at the 2 April level, which is 54%.

Current Tariff Structures

With tariff ceilings identified and stabilised – the United States maintaining an effective 30% and China at 54% – we are now operating within firm upper boundaries. Washington’s dual structure, comprising a 10% baseline and an additional 20% linked to narcotics regulation, is unlikely to change near term. Meanwhile, Beijing has held its own response steady, preserving a 10% baseline while avoiding any backpedal on raw material controls.

The lack of a de minimis exemption reinstatement from the American side continues to weigh on cost efficiency. That disadvantages smaller consignments, pushing some firms to rely more heavily on consolidated shipping channels, which could reshape logistical decisions over the longer timeline.

From a macro-structural view, the fact that no new retaliatory measures have emerged signals a pause in the trade conflict escalation rather than resolution. Given that tariff caps have been declared by both capitals, near-term positioning shifts are more likely to be technical than thematic. So far, neither side appears prepared to gamble on further trade weaponisation, which leaves a static parameter base for pricing assumptions.

Liu’s silence on adjusting export license thresholds for critical minerals implies additional forms of tightness beyond tariffs. That should not be dismissed lightly, especially if other producers like Australia or Myanmar struggle to plug supply gaps. In that case, scarcity premiums may not take long to materialise again.

Enforcement and Market Dynamics

Yellen has instead refocused messaging onto compliance siphons headed through Mexico. That redirection of attention may drive policy-to-market lags but also signals where future enforcement bottlenecks could emerge. For us, that brings compliance costs and shipping origin strategies back under scrutiny. Watching the rerouting indicators – port volumes, warehousing demand and inland freight shifts – will be telling.

Volatility suppression in rate-sensitive derivatives tied to East Asian exporters has begun to fade. This is a direct outcome of the perceived tariff ceiling being firm. With protectionist tools temporarily hedged in, downside protection has become less thematic and more event-driven. Any levered exposure to product-channel-linked issuers warrants a review of rollover windows, particularly for semiannual hedges set earlier in Q1.

With headline triggers seemingly capped for now, the impetus shifts to secondary pressure points – freight rates, energy feedstock costs, and niche reagent imports. It may be worth also modelling in a flat rate around current tariff levels, and using scenario branches around shipment route diversity or component pricing velocity.

Derivatives tied to transport carriers on Pacific cross-trade routes should be approached cautiously as hedging convexities are increasingly being driven by tariff-induced bottlenecks rather than endogenous shipping trends. Closely watching effective volume-throughput metrics from Los Angeles and Shenzhen ports could offer early signals, especially if queue durations diverge beyond seasonal norms.

The rate of retracing in industrial equities remains too tightly correlated with sentiment on Sino-US friction reduction. An overly optimistic trading thesis on reduced trade tension could miss pricing complexity where actual bottom-line impact from tariffs remains unresolved. Instead, we prefer taking a structural view on term volatility rather than betting on near-month simplification narratives.

Contract exposure to aluminium, lithium derivatives and semiconductor-linked firms should be handled with attention to control jurisdictions. Given that Chinese export restrictions on rare earths remain in place, time spreads and inventory decay assumptions may become relevant again, especially if scrap supply in Western markets tightens under new compliance guidelines post-summer.

We are choosing to revisit expression mechanics across synthetic baskets with exposure greater than 30% to verticals affected by freight harmonisation, such as consumer electronics and low-margin manufacturing. When leverage clusters gather around flatlined policy zones, small shifts in interpretation become outsized in execution. Expect longer tails. Keep strike selection wary. Use time. Better to be long optionality than to presume policy roots will be quiet too long.

Create your live VT Markets account and start trading now.

A Rabobank forecast maintains USD/JPY at 140.00 amid optimism from a US-China trade agreement

The recent US-China trade agreement has led to optimism, affecting currency performances. The JPY has declined nearly 1.6% against the USD, becoming the weakest G10 currency over one session. There is an expectation of USD strength due to short covering, though the forecast for USD/JPY remains at 140.00 over 12 months.

The USD has struggled as the worst performing G10 currency so far this year. Although there was a bounce seen in the USD due to trade deal optimism, the build-up of long USD positions has contributed to its weak trend. Concerns over a potential US recession linked to tariff policies have further impacted the USD negatively.

Japan’s Trade Position

Japan holds a relatively strong position in trade talks with the US, being a major FDI provider and defence partner. However, the upcoming Upper House elections in Japan might add complexity to negotiations. The JPY’s recent gains suggest no immediate rush for BoJ rate hikes, but a potential rapid JPY unwind could influence rate hike expectations. This quarter’s short covering might support the USD, but a trade compromise between the US and Japan could lead to a USD/JPY downtrend in the later half of the year. The USD/JPY forecast is maintained at 140.00 for 12 months.

With short covering providing a temporary lift to the US dollar, market sentiment has shifted in the near term. However, the broader trajectory remains weighed down by persistent headwinds. The weak performance by the dollar over the year so far isn’t simply the result of positioning; deeper structural concerns are at play, particularly those tied to the long shadow cast by trade policy uncertainty and recessionary fears. When long positions unwind and sentiment turns, the move can be sharp, and we’ve now seen early signs of that rebalancing dynamic emerging.

Dollar-yen, in particular, has exhibited volatile behaviour in light of both political developments and market repricing. The recent softness in the yen was accelerated by geopolitical easing, but that shouldn’t suggest a durable trend favouring dollar appreciation. The depth of the USD’s underperformance earlier in the year implies that any rebound is more likely a correction than a reversal. The 1.6% single-day move in favour of the dollar may appear dramatic, but contextually it’s rooted in a combination of technical flow and provisional relief rather than a shift in macro fundamentals.

Monetary Policy Dynamics

In Japan, election season adds a layer of policy hesitation, especially regarding monetary tightening measures from the Bank of Japan. As such, there’s been a notable dampening of any imminent hawkish expectations, despite periodic yen strength. That resilience has partly reflected the absence of urgency more than the presence of renewed investor conviction. Should fiscal discussions around Japan’s defence and investment roles with the US advance meaningfully, adjustments to existing trade discounts could trigger liquidity-driven moves.

We see limited scope for continued yen depreciation under the current valuation, particularly if U.S. economic signals, such as PMIs or employment numbers, begin to falter. That would challenge the legs of the current USD rally, especially given how tied recent flows have been to sentiment around trade and risk. Moreover, any renewed pessimism about U.S. economic resilience would likely ignite calls for lower yields, stifling further upside in the pair.

Looking to the quarters ahead, expectations remain anchored—for now—around the 140.00 level. But should diplomatic proceedings between Tokyo and Washington evolve into a tangible framework, the pricing mechanism will begin to factor in long-term stability rather than short-term positioning swings. Those scenarios would demand rapid adjustment in exposure. A technical break lower in the pair triggered by treaty-driven capital realignments could test the durability of long dollar bets.

Participants should keep a close watch on correlations with equity risk and rates volatility, particularly as both Tokyo’s political structure and Washington’s trade rhetoric continue to influence capital flow. Our monitoring of implied volatility skews suggests investors may be underpricing downside risks as the time horizon moves past the current quarter. It remains to be seen whether risk appetite can sustain present levels without further reassessment of the fiscal and trade direction from either side.

Create your live VT Markets account and start trading now.

Current market sentiment shows bullish trends in oil, S&P 500, and cryptocurrencies, while gold and yen decline

Financial markets are experiencing shifts due to the recent U.S.-China agreement on tariff reductions. Gold prices have dropped by approximately 3%, making it less appealing as a safe-haven asset. This is due to improved sentiment from the tariff cuts.

Oil prices have risen between 2% and over 3%, influenced by positive trade developments and expectations for increased demand. However, higher OPEC production poses a risk that could affect these gains.

Market Bullishness and Currency Movements

The S&P 500 is bullish, with stock futures up due to easing U.S.-China tensions. The US dollar has risen to a one-month high, buoyed by the global growth outlook linked to tariff relief.

The Japanese yen is under selling pressure as investors move towards riskier assets, while the euro has weakened against the dollar. It is eyeing further declines towards the 1.09 level, primarily due to the dollar’s strength.

Cryptocurrencies are experiencing bullish sentiment, led by Ethereum’s 42% gain over five days. This is driven by optimism from the tariff cuts and a general increase in risk appetite.

The rise in stocks, the US dollar, cryptocurrencies, and oil underscores a strong “risk-on” sentiment from trade optimism. Traders should remain adaptive and closely track ongoing U.S.-China negotiations to manage risk effectively.

Market Reactions and Strategic Positioning

The existing developments in the markets point to a clear reaction from investors: optimism linked to the U.S.-China tariff reductions has encouraged widespread risk-taking. Assets typically seen as more volatile or growth-oriented—such as equities and cryptocurrencies—are benefiting from renewed confidence, while traditional safe-havens like gold and the yen have weakened. This shifting mood reflects an expectation that trade barriers will continue to ease, potentially lifting global economic activity and demand.

With that in mind, we’re seeing gold suffer from a rapid sell-off. It’s lost some of its defensive appeal, as traders rotate into more rewarding assets. The price action, particularly a 3% drop in a short period, is stark and telling. When sentiment swings fast, the reflex is to question the sustainability of safe-haven flows. If geopolitical frictions continue to unwind, retracements in gold could extend deeper in the sessions ahead.

Oil’s bounce, climbing over 3% in response to an expected demand rebound, is not without its threats. Increased OPEC output is quietly building in the background. That puts pressure on the recent upward move. It becomes less about sentiment and more about supply fundamentals from this point forward. Oversupply risks, particularly if output continues to climb while demand projections flatten, could change the direction quickly. Pricing in these risks means staying nimble, favouring trades that price in compression rather than independent momentum.

In equities, the S&P 500 has picked up fresh momentum. Relief over trade policy is helping move futures up, and there’s little resistance in sight in the near term. Relief from policy risk is not the same as growth, however. While index strength is still drawing attention, many positions are being shaped around cyclical and tech-heavy sectors, where the upside tends to concentrate disproportionately during recovery phases. We’re keeping close tabs on positioning data to identify whether speculative length continues to build.

The dollar, meanwhile, is tracing out a one-month high. Its sudden appeal seems rooted in better global growth projections and reduced risk of conflict from tariff escalations. It’s not just strength versus risky currencies; haven peers like the yen and even the euro are under pressure. The euro, in particular, has little near-term support. A slide towards the 1.09 region doesn’t just reflect dollar strength, but ongoing hurdles facing European economic recovery.

As for cryptocurrencies, Ethereum’s noticeable 42% rise in less than a week presents both opportunity and caution. That momentum is being driven by broader interest in risk-sensitive assets, rather than solely blockchain developments. Often, surges like this are met with speculative inflows that make valuations stretch beyond their organic state. We expect bursts of high-volume volatility across the crypto space in the short run. Between headlines and flows, markets like this are vulnerable to sharp pullbacks if sentiment reverses.

The overall theme is plain—a shift into risk. When we observe the rally across several uncorrelated markets—equities, digital coins, commodities—it suggests coordinated response rather than isolated movements. The ebb and flow of tariff negotiations still holds sway over positioning in these markets. We continue to manage exposure with these known factors in play. Swift re-pricing on headlines is to be expected, and we remain ready for either direction.

Create your live VT Markets account and start trading now.

After the US-China tariff reduction, gold experiences a decline exceeding 3.0% during European trading

The US-China Tariff Agreement

Gold prices have fallen over 2.5% intraday following an agreement between the US and China to reduce tariffs for 90 days. China will cut its tariffs on US goods from 125% to 10%, while the US will decrease its tariffs on Chinese goods from 145% to 30%.

Gold prices dropped more than 3% during the European trading session, approaching $3,231. This price movement follows market responses to tariff reductions, prompting an exit from safe-haven assets like gold.

The US-China tariff agreement has resulted in rising US yields, with the 10-year yield reaching 4.43%. This may drive inflation, as trade tensions ease, potentially increasing commodity demand, such as oil, which rose over 2% to $62.50.

The US Treasury Secretary noted an interest in further cooperation with China. As stock markets respond positively, US futures gained 2.50% to 3%, while Chinese and European stocks also saw increases.

Further gold price declines might test support levels, potentially dropping below $3,200. A recovery could face resistance at $3,284, with potential targets up to $3,500.

Impact of Interest Rates on Gold Prices

Interest rates are pivotal in currency strength, affecting gold prices since higher rates increase the opportunity cost of holding gold. The Federal Reserve’s policies on interest rates influence gold’s appeal compared to interest-bearing assets.

Right, so what’s happening here is a push-and-pull of strong forces in the market reacting to this rather unexpected trade thaw between the US and China. The mutual tariff de-escalation is effectively shifting investor sentiment away from defensive positions. Gold, which often benefits from uncertainty, has taken a swift hit—falling well over 2.5% intraday as participants weighed the implications of reduced trade barriers. The steepest part of that decline came during European hours, where it slid past 3%, nearing the $3,231 level. That alone signals a quick reassessment of risk exposure, especially among those looking for protective cover.

What’s equally relevant is the expansion in US 10-year Treasury yields. With the benchmark reaching 4.43%, it’s evident that investors expect some inflationary pressure to creep in, or at least increased economic activity from the removal of trade restrictions. Higher yields increase returns on government debt, hence draining some of the appeal of non-yielding assets like gold. And this is exactly where traders would be considering their positioning going into the next few weeks.

The uptick in yields and the rally in global equities—US futures climbing 2.5% to 3%, alongside broader gains in both Chinese and European shares—suggest that risk appetite is broadening. Markets are repositioning. The Treasury Secretary, for his part, hinted at openness to more economic engagement with China. That adds another layer of expectation across risk assets, allowing for a more optimistic tone across equities, commodities, and select currencies.

In terms of technical markers, there’s still room to test additional downside in gold. If it breaks below the $3,200 level, we could see further liquidation-driven selling. However, watch for any bounce as it approaches $3,284, which may act as a near-term cap. Any sustained move above that could put $3,500 back in sight, though present momentum doesn’t favour such an outcome unless adverse data or geopolitical hiccups appear.

From our perspective, the rate environment is now top-heavy in its influence. The yield curve, while not inverted, is clearly pulling capital toward interest-generating instruments. This undercuts gold’s appeal. The Fed’s stance on interest rates—especially in light of these new trade developments—will remain key. If policy signals suggest continuation of higher-for-longer rates, gold could struggle to find its footing.

That means for short-term directional trades, we’re watching both inflation data and forward guidance from monetary authorities. With trade barriers softening, commodities like oil—already above $62.50—are getting a tailwind, which supports inflation risks. This, in turn, feeds into yield expectations.

So it’s hardly the time for one-directional positioning. Monitor bond yields and central bank communications closely. Volatility around gold could remain elevated over the next several sessions. Short-term support and resistance levels should be reassessed frequently, with one eye on broader macro shifts and institutional flows.

Create your live VT Markets account and start trading now.

The US-China agreement excludes e-commerce’s duty-free shipments, raising costs for American online shoppers

The de minimis exemption allowed e-commerce shipments valued at $800 or less to enter the US duty-free. This threshold gave online retailers, especially fast fashion from China, greater access to the US market without import charges.

Last month, the White House removed this exemption, and the recent US-China trade deal does not reinstate it. Consequently, US consumers will face higher costs for overseas online shopping, regardless of the new trade agreement.

Impact on Consumer Discussions

Consumer discussions on platforms like the DHL sub-Reddit express concerns over tariffs. Many have noted that duties sometimes exceed the cost of the items ordered, indicating the burden tariffs place on US consumers.

Essentially, what’s happening here is a shift in trade policy that’s already begun to bite at a very practical level—with direct effects on consumer prices and purchasing behaviour. The original exemption, which allowed for goods valued under $800 to slip through without duties, provided a strategic loophole for fast fashion retailers and low-cost exporters outside the US. It kept delivery chains fast and costs down. For day traders and options specialists, what we’re really looking at now is a constraint that previously wasn’t priced in by broader markets.

Now that it’s been eliminated, this former cost advantage disappears entirely. The change hasn’t come with an accompanying tax holiday or adjustment period either, meaning the adjustment has been immediate, without cushioning. The US decision not to reintroduce this exemption, even in the context of recent bilateral engagements, removes any ambiguity around the policy’s durability.

As we’ve watched sentiment shift online, particularly in niche forums like supply chain logistics and international shipping discussion boards, there’s a recurring theme: unexpected charges at the point of delivery. This isn’t simply anecdotal noise—it’s early evidence that new cost layers are forming right at the consumer level.

If we take this back to volatility and where it might ripple, the most direct effect would be grouped around retailers with heavy dependency on cross-border e-commerce. Even if the base revenue looks intact for now, margin compression becomes more likely, especially if input costs can’t be passed through without hurting demand. Duty rates fluctuating by category only further complicate pricing models.

Monitoring Market Reactions

We’re watching carefully for changes in short interest and implied volatilities in logistics-sensitive equity baskets. These aren’t always immediate, but they nearly always follow shifts in underlying flows. In the same way, indexes that cover global consumer goods may begin to show mapped deviations from their domestic-facing peers. One doesn’t need a radical dislocation to move put-call ratios; even modestly lower receipts and occasional quarter-end surprises can build a pattern.

Longer-dated options may provide an entry point for those looking to position around second-order impacts. By this, we mean the pass-through effect where delayed delivery or surprise duties begin to trigger return spikes or reduced checkout conversions. Holiday seasons will likely bring forward some of these stresses sooner than later.

Also worth noting—exchange-traded funds tracking Chinese consumer expansion have remained relatively resilient, but that may not accommodate the removal of an $800 buffer on goods historically routed through intermediary platforms. Forward-looking balance sheets will likely need to price in some attrition, especially if the model depended heavily on low-friction customs clearance.

From our side, there’s also technical interest building on delta hedging activity tied to retail-linked exposure—something we haven’t seen with this cadence since plant shutdowns during heighted pandemic phases. Watching these shifts over several trading sessions should give us a better sense of how market makers are repositioning risk.

As risk takers in implied volatility terms, it’s periods like this—where government policy runs ahead of price discovery—where we tend to see tradable anomalies. The removal of frictionless low-value parcels introduces an unavoidable cost layer. That contrast, between durable myths around free shipping and the now very real customs bill, nudges closer to a misalignment.

We’ll monitor how this plays into earnings guidance from listed e-commerce platforms. If forecasts get a haircut, especially if justified by slowed international conversion rates or cart abandonment in affected postal regions, we wouldn’t be surprised to see revisions priced in fairly swiftly.

Create your live VT Markets account and start trading now.

Due to increased global risk appetite and a stronger US Dollar, gold prices decline sharply

Gold prices have experienced a decline, trading around $3,217 per ounce, a drop of over 3% from the previous session. This decrease is due to improved global risk sentiment and a stronger US Dollar, reducing Gold’s appeal as a safe-haven asset.

The easing of geopolitical tensions, such as the US-China trade agreement and improved relations between India and Pakistan, has also impacted Gold prices. The US Dollar Index trading above 100.60 makes Gold more expensive for those holding non-dollar currencies.

Impact Of Us Consumer Price Index

Market attention is now on the upcoming US Consumer Price Index release, which could affect the Federal Reserve’s policy decisions and subsequently influence Gold’s value. Gold is currently below significant technical levels, with the next support at $3,200, and potential declines towards $3,150 and $3,000 if support fails.

Gold remains inversely correlated with the US Dollar and risk assets, often rising with geopolitical instability or recession fears. Central banks, particularly in emerging economies, are increasing Gold reserves, adding 1,136 tonnes in 2022, the highest since records began. Gold’s price is influenced by various factors, including geopolitical events, interest rates, and currency values.

While we’ve witnessed a sharp pullback in Gold, there’s more to unpack than simply pinning the move on improved confidence or Dollar strength. The price has come off by more than 3% since the previous session and sits now around $3,217 per ounce — marking a clear break from last week’s relatively steady stance. Risk appetite is on the mend globally, driving demand for yield rather than safety, and Gold, typically the go-to in times of economic or geopolitical uncertainty, is naturally seeing outflows in this environment.

This improved sentiment may feel a touch fragile. Market participants are factoring in greater cooperation between major powers — we’ve noted a softening in some international flashpoints, including the easing trade discord between the U.S. and China. Diplomatic warming elsewhere, notably between India and Pakistan, has further cooled nerves that previously drove safe-haven demand. When tensions ease, Gold typically loses some of its defensive allure, and that pattern is playing out now.

Resistance And Technical Levels

We shouldn’t ignore that the US Dollar remains firm, with the Dollar Index persistently hovering above the 100.60 mark. This alone dampens non-Dollar buyers’ interest in Gold due to its higher relative cost. From a tactical standpoint, this adds a layer of resistance for any Gold recovery in the short term — when the Dollar has firm wind behind it, Gold tends to feel the drag.

All eyes now turn to the release of the U.S. Consumer Price Index. What markets discover in these inflation figures will likely chart the near-term path for the Fed’s stance. If hotter-than-expected, speculation may resume for tighter policy extensions, reinforcing Dollar positions and possibly putting more pressure on non-yielding assets like Gold. On the flip side, a softness in prices could be a green light for moderation, giving support to Gold bulls.

Right now, Gold is trading below some previously well-held technical zones. Support at $3,200 is being tested, and chatter has already turned to lower markers: $3,150 is near-term, but if that fails to hold, the market could start flirting with psychological support closer to $3,000. We’re aware that moves of this kind don’t play out gracefully — should volume spike on the way down, technical selling could accelerate, dragging support levels with it.

Historically, we’ve seen Gold rise when monetary tightening stalls, geopolitical risks flare, or recession signals deepen. While these elements aren’t in play with full force this week, they haven’t disappeared. Notably, the longer-term backdrop still includes consistent central bank buying, especially from emerging markets. Just last year, 1,136 tonnes were added to global reserves — the highest annual increase on record.

That data shouldn’t be taken as immediate fuel for price lifts but does provide a longer-term undercurrent of support. After all, central banks usually act with longer timeframes in mind, adding physical Gold to buffer against currency fluctuations and external shocks. These purchases help underpin the asset during periods of softness and may cap deeper drawdowns, particularly if prices drift closer to cost-average zones for those institutions.

For traders, this becomes less about timing the precise bottom and more about understanding what causes correlations to shift directionally. With volatility down and Fed uncertainty still hanging, we might expect tighter trading ranges in the coming sessions — but that false calm can change quickly once CPI data hits. Trading around macro data releases demands tight risk parameters, as any sharp deviation can launch directional moves with velocity.

Create your live VT Markets account and start trading now.

Greene noted wages and inflation trends are improving, yet concerns about their persistence remain high

BOE policymaker Megan Greene notes that inflation persistence indicators remain elevated. Medium-term inflation expectations are showing a slight increase, which is a concern.

The Bank of England recently cut rates, but differing views among central bank officials indicate ongoing internal debates. Despite some positive movement in wage and inflation measures, the overall levels are still considered too high by Greene.

Caution Within The Bank

Greene’s remarks suggest a degree of caution within the Bank, hinting that premature optimism about the inflation outlook may be misplaced. The upward drift in medium-term expectations underscores the challenge faced by policymakers: while some short-term figures appear to be improving, the broader picture still reflects price pressure that is too sticky for comfort. Markets had previously leaned into the idea of a more sustained easing cycle following the recent rate cut, but we ought to be mindful that a full-blown pivot could take longer to materialise.

The divergence among committee members reflects exactly what we’ve expected — a split between those who focus on current data showing signs of relief, and those like Greene, who keep one eye firmly on underlying measures that move more slowly. That divergence matters because it feeds into the uncertainty about timing and scale of future rate moves. For our part, we should give weight to the more conservative assessments, particularly when expectations begin influencing real-world behaviour, which can entrench price dynamics further.

Interestingly, although some measures such as wage growth have shifted marginally in a more favourable direction, they haven’t done so quickly or cleanly. For derivatives traders, an asymmetric approach is warranted. One-sided bets on aggressive easing could easily come undone if near-term inflation prints remain hot or expectations continue drifting up. Spreads centred on gradual cuts, or positioned for policy remaining steady longer than priced, may provide a better balance of risk versus reward.

Growing Divergence On The Committee

Volatility pricing — especially tied to near-term policy meetings — may now start to reflect the growing divergence on the committee. That increases the value of optionality. We can take advantage of wider pricing bands, using well-timed structures that benefit from overreactions to dovish headlines, while hedging against sharp repricing on the hawkish side.

Market participants should not only follow headline metrics but also dissect core indicators more closely tied to decision-making. Greene’s concern over embedded inflation expectations is less about a single data point and more about momentum. We must respect that flow — it moves slowly and tends not to reverse until policy decisively tightens or demand visibly weakens.

In short, we are not yet in the clear. Treat every assumption of a well-defined easing path with suspicion. Make use of the uncertainty. Pricing in flexibility at this stage may be the most prudent way forward.

Create your live VT Markets account and start trading now.

Back To Top
server

Hello there 👋

How can I help you?

Chat with our team instantly

Live Chat

Start a live conversation through...

  • Telegram
    hold On hold
  • Coming Soon...

Hello there 👋

How can I help you?

telegram

Scan the QR code with your smartphone to start a chat with us, or click here.

Don’t have the Telegram App or Desktop installed? Use Web Telegram instead.

QR code