The Ultimate Handbook on How to Read Trading Charts
Understanding how to read trading charts is fundamental for any trader aiming to navigate financial markets confidently. Trading charts visually represent price movements over time, allowing traders to analyze past performance and predict future trends. This guide will explain the basics of trading charts, different types, how volume influences analysis, and practical steps to interpret them effectively.
What Are Trading Charts?
Trading charts are graphical tools that display price data of financial assets such as stocks, forex, precious metals, or indices. These charts plot price on the vertical axis against time on the horizontal axis. By visualizing price fluctuations, traders can identify patterns, trends, and key support or resistance levels essential for making informed trading decisions. Learning how to read the trading chart allows traders to decode market sentiment and price behavior, which is crucial for timing entry and exit points.
Types of Trading Charts
There are several types of trading charts, each offering unique insights:
- Line Chart: The simplest form, connecting closing prices over a period. It’s useful for spotting overall trends but lacks detailed price information.
- Bar Chart: Displays open, high, low, and close (OHLC) prices for each time interval, providing more data about price volatility.
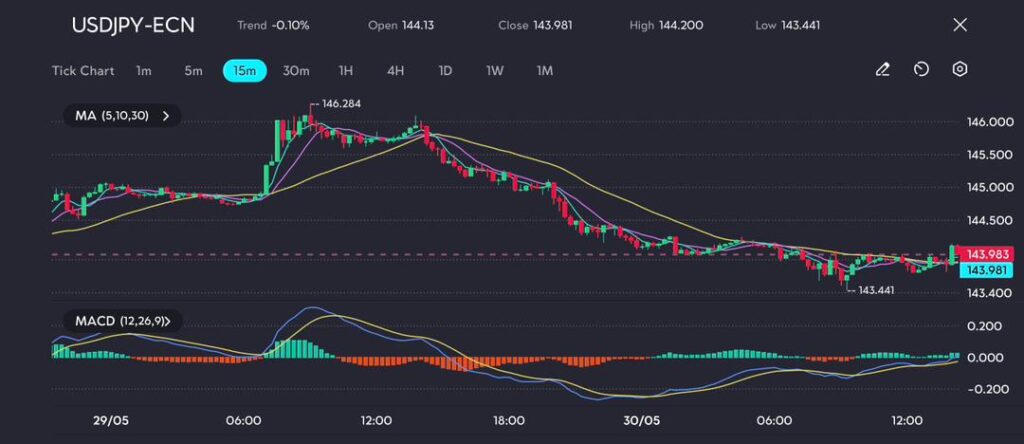
- Candlestick Chart: The most popular chart type among traders, showing OHLC with “candlesticks” that visually depict bullish or bearish price movements. Candlesticks are highly informative for recognizing market momentum and reversals.
Understanding how to read trading charts begins with recognizing which chart type suits your trading style and objectives.
Discover the 18 candlestick patterns you should know and learn.
Price Axis vs. Time Axis
Every trading chart consists of two axes:
- Price Axis (Vertical): Displays the price levels of the asset. Reading this axis tells you at what price the asset traded during the selected timeframe.
- Time Axis (Horizontal): Represents the passage of time, ranging from minutes to years depending on the chart’s timeframe.
Grasping the interaction between the price and time axes is essential in understanding market dynamics and accurately interpreting chart movements.
Volume and Its Role in Chart Analysis
Volume represents the number of shares or contracts traded during a specific time frame. It’s a critical component in chart analysis because it confirms the strength behind price movements.
High volume during an uptrend suggests strong buying interest, reinforcing the trend’s validity.
Low volume in a price move may signal a weak or unsustainable trend, often preceding reversals.
Incorporating volume analysis into how to read the trading chart enhances decision-making by showing whether price moves are supported by active market participation.
How to Identify Trends?
Identifying trends is key to successful trading. Trends indicate the general direction of price movement and can be classified as:
- Uptrend: A series of higher highs and higher lows indicates bullish market sentiment.
- Downtrend: A series of lower highs and lower lows showing bearish momentum.
- Sideways/Range-bound: Price moves within a horizontal channel, indicating indecision.
When learning how to read trading charts, spotting these trends early helps traders position themselves advantageously in the market.
New to trading? Learn how to start trading for beginners.
How to Read Trading Charts?
To effectively read trading charts, follow these steps:
Step 1: Choose the Right Chart Type
Candlestick charts are widely used because they display open, high, low, and close prices clearly, helping traders spot buying or selling pressure. Line charts are simpler, connecting closing prices to show general trends. Selecting the right chart type depends on your trading style and what detail you need.
Step 2: Set the Appropriate Timeframe
Your trading timeframe influences what you see on the chart. Day traders typically use short timeframes like 1 to 15 minutes to capture quick moves, while swing traders prefer hourly or daily charts to focus on medium-term trends. Long-term investors often analyze weekly or monthly charts. Choosing the right timeframe helps match the chart’s signals with your trading strategy.
Step 3: Analyze Price Patterns
Recognizing patterns such as head and shoulders, double tops, or triangles can indicate potential market direction changes. These formations give clues about whether a trend will continue or reverse, helping traders make informed decisions.
Step 4: Evaluate Volume
Volume shows how many units of an asset have been traded. High volume during a price move confirms strong market interest and the likelihood of a sustained trend. Low volume, however, suggests weak momentum and possible reversals.
Step 5: Identify Support and Resistance Levels
Support acts as a price floor where buying interest may push prices back up, while resistance is a ceiling where selling pressure might reverse an uptrend. Spotting these levels enables traders to set better entry and exit points.
Step 6: Use Trendlines
Drawing lines that connect consecutive highs or lows helps visualize the trend direction. Uptrend lines connect higher lows, showing bullish momentum; downtrend lines connect lower highs, indicating bearish pressure. Trendlines also help identify when a trend might be weakening.
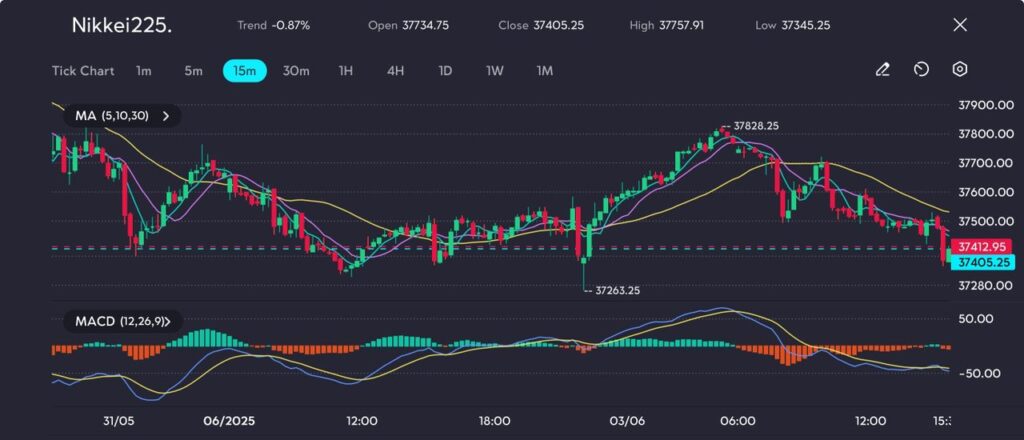
Step 7: Combine Indicators
Technical indicators like moving averages and the relative strength index (RSI) provide additional confirmation of trends or overbought/oversold conditions. Using indicators alongside chart patterns reduces false signals and improves trading accuracy.
By systematically applying these techniques, traders can master how to read the trading chart to make informed trading decisions.
Conclusion
Mastering how to read trading charts is essential for making well-informed trading decisions. By selecting the right chart type, choosing an appropriate timeframe, analyzing price patterns, evaluating volume, identifying support and resistance levels, using trendlines, and combining technical indicators, traders gain a comprehensive understanding of market behavior. With consistent practice and the right tools, traders can confidently interpret charts to better time their trades and improve their overall trading performance.
Learn How to Read Trading Charts with VT Markets!
VT Markets provides access to MetaTrader 4 and MetaTrader 5—trusted and reliable platforms equipped with advanced charting tools and real-time market data to help you master how to read trading charts. With a demo account, you can practice trading risk-free, sharpen your skills, and build confidence before trading live. VT Markets supports traders at all levels with educational resources and expert guidance to help you read trading charts effectively.
Start your trading journey with VT Markets and gain the confidence to interpret charts like a professional.
Frequently Asked Questions (FAQs)
1. How to read trading charts effectively?
To read trading charts effectively, follow these key steps:
- Step 1: Choose the right chart type, such as candlestick or line charts.
- Step 2: Set the appropriate timeframe based on your trading style.
- Step 3: Analyze price patterns to spot trends and reversals.
- Step 4: Evaluate volume to confirm the strength of price movements.
- Step 5: Identify support and resistance levels as key decision points.
- Step 6: Use trendlines to visualize the direction and strength of trends.
- Step 7: Combine technical indicators like Moving Averages and RSI for confirmation.
Practicing these steps regularly will help you master how to read trading charts confidently.
2. How important is volume in reading trading charts?
Volume is critical as it validates price movements. High volume confirms trends, while low volume may indicate weak or false moves.
3. Can I use multiple chart types simultaneously?
Yes, combining line, bar, and candlestick charts can provide a comprehensive view of market conditions.
4. How do I decide the best timeframe for reading charts?
Choose a timeframe aligned with your trading style. Short-term traders use minute charts, while long-term traders prefer daily or weekly charts.
5. What are support and resistance levels, and why do they matter?
Support and resistance are price points where the market tends to reverse or stall. Identifying these helps traders make better entry and exit decisions.
6. How do technical indicators complement trading charts?
Indicators like moving averages and RSI provide additional data on momentum and trend strength, confirming or warning against signals seen on the charts.
7. Is it necessary to use a demo account to learn how to read trading charts?
Yes, demo accounts allow you to practice chart reading and trading strategies without risking real money, which is essential for gaining confidence.
8. How often should I check trading charts when day trading?
Day traders often monitor charts continuously or at very short intervals (1-5 minutes) to catch quick price movements and adjust trades accordingly.


 | VT Markets")

 | VT Markets")

 | VT Markets")