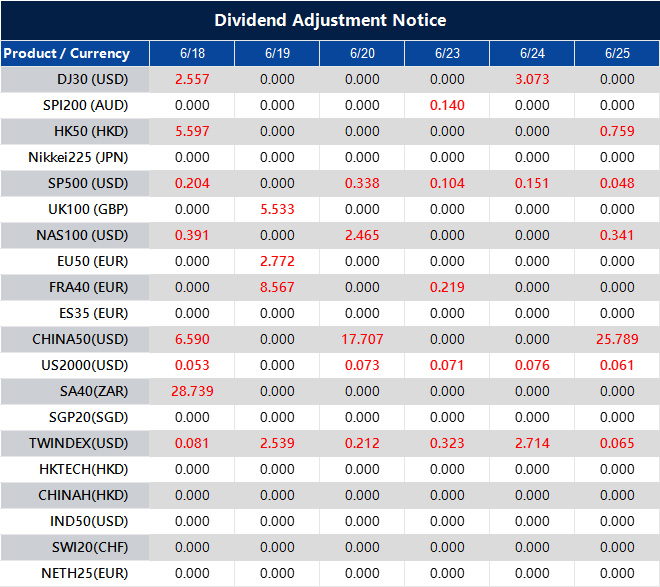
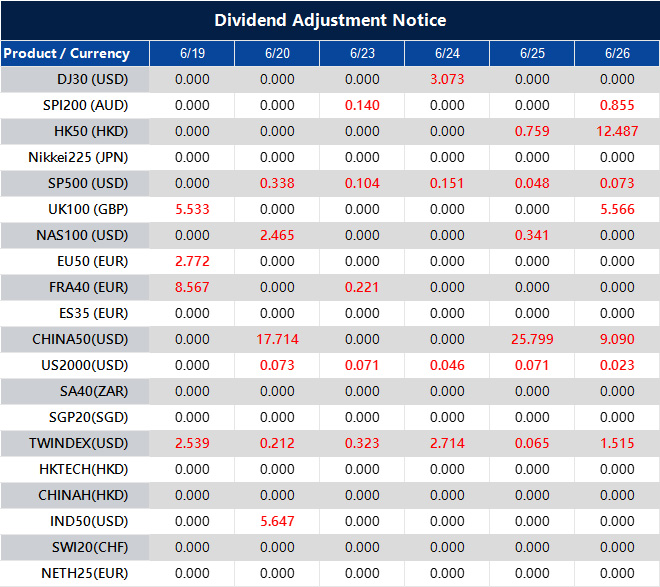
Please note that the dividends of the following products will be adjusted accordingly. Index dividends will be executed separately through a balance statement directly to your trading account, and the comment will be in the following format “Div & Product Name & Net Volume”.
Please refer to the table below for more details:
The above data is for reference only, please refer to the MT4/MT5 software for specific data.
If you’d like more information, please don’t hesitate to contact info@vtmarkets.com.
Bull Trap vs Bear Trap: Key Differences You Need to Know
In the world of trading, not every breakout or breakdown leads to a trend. Often, these moves are deceptive, designed to mislead traders into poor entries before the market sharply reverses. These deceptive patterns are known as bull traps and bear traps formations. For traders across stocks, forex, indices, or precious metals, understanding the bull trap vs bear trap dynamic can mean the difference between profit and premature losses. This article explores both bull trap and bear trap in detail, how to identify them, and how to avoid falling for them.
What Is a Bull Trap?
A bull trap occurs when a market appears to break above a key resistance level, triggering buying interest and optimism. However, instead of continuing upward, the price quickly reverses, forcing late buyers to exit at a loss.
Example: In April 2024, the S&P 500 briefly broke above $5,300 after a soft inflation print. Traders expected a continued rally. But hawkish Fed comments quickly reversed the move, and the index fell below $5,100 — a clear bull trap that caught breakout buyers.
How to Identify a Bull Trap
Spotting a bull trap before it is complete requires careful observation of both price action and trading volume. Here are key signs:
1. Weak volume on the breakout
If the price breaks above resistance but volume stays low, it suggests there’s no real conviction behind the move. Breakouts need strong participation to hold.
2. Bearish divergence
When indicators like RSI or MACD form lower highs while price makes higher highs, it signals weakening momentum. This often precedes a reversal.
3. Lack of confirmation
A breakout that fails to stay above the resistance level — especially if the price pulls back within a few candles — may not be genuine. Watch for sustained closes.
4. Reversal candlesticks
Bearish patterns such as a shooting star or bearish engulfing near resistance often indicate buyer exhaustion and the potential for a trap.
What Is a Bear Trap?
A bear trap is the inverse. It occurs when a market appears to break below support, prompting traders to open short positions. The price soon reverses upward, catching those short positions off guard.
Example:Tesla (TSLA) fell from around $480 in December 2024 down to approximately $214 by April 7, 2025, following a sharp earnings miss. A rebound to about $270–$290 in mid‐May created optimism among traders. Some positioned for recovery, but the bounce quickly faded, and TSLA fell back below $270—a straightforward bull trap that caught momentum buyers seeking a reversal.
How to Identify a Bear Trap
Bear traps are common during panic selling or when sentiment is overly bearish. Key indicators include:
1. Breakdown without follow-through volume
A price break below support should be backed by heavy selling. If volume is low, it may reflect a lack of conviction — suggesting the move could reverse.
2. Quick recovery above support
If the price drops below support but reclaims it quickly — especially within the same session — it signals that sellers failed to maintain control.
3. Bullish divergence
When price makes lower lows but indicators like RSI or MACD start trending upward, it reveals hidden buying pressure. This divergence often precedes sharp reversals.
4. Short-lived breakdowns
Intraday dips that reverse before the market closes indicate a trap. These sudden recoveries tend to squeeze short positions and spark quick rallies.
Bull Trap vs Bear Trap: Head-to-Head Comparison
The table below breaks down the key differences between a bull trap and bear trap, highlighting how each pattern behaves, who it typically traps, and what signals traders should watch for.
Factor
Bull Trap
Bear Trap
Direction of Fake Move
Upward breakout
Downward breakdown
Traps Which Traders?
Buyers (long positions)
Sellers (short positions)
Market Sentiment
Overly bullish
Overly bearish
Common Conditions
Euphoria, FOMO, weak breakouts
Panic selling, fear-driven reversals
Key Indicators
Bearish divergence, low volume
Bullish divergence, volume mismatch
Typical Outcome
Rapid drop after breakout
Sharp recovery after breakdown
1. Direction of Fake Move
In a bull trap, the price appears to break upward past resistance, attracting buyers. In contrast, a bear trap shows a downward break below support, luring in short-sellers. In both cases, the move is deceptive and soon reverses.
2. Traps Which Traders?
A bull trap typically catches buyers entering long positions too early. A bear trap, on the other hand, snares sellers who short the market expecting further decline. Both groups are forced to exit quickly when price reverses.
Bull traps emerge during overly optimistic or euphoric conditions, when traders fear missing out on a rally. Bear traps happen in fearful markets, where panic prompts traders to sell or short aggressively.
4. Common Conditions
Bull traps often appear in moments of FOMO or weak breakouts — where buyers jump in without confirmation. Bear traps tend to occur during panic selling or after news-driven moves that lack sustained pressure.
5. Key Indicators
In a bull trap, you may see bearish divergence on momentum indicators and low volume on the breakout. In a bear trap, bullish divergence and a lack of strong selling volume are early warnings of a false breakdown.
6. Typical Outcome
The aftermath of a bull trap is usually a quick price drop, triggering stop-losses for long trades. A bear trap often results in a sharp price recovery, forcing short-sellers to cover at higher prices, fueling the reversal further.
Tips to Avoid Bull Trap and Bear Trap
Getting caught in a trap can lead to significant drawdowns. Here are practical strategies to avoid them:
1. Wait for confirmation
Avoid jumping into the first breakout or breakdown. Look for additional confirmation like retests of the breakout level or strong closes above or below key levels. This confirms the move has strength and is not a false signal.
2. Use multiple timeframes
A signal on a short timeframe, like a 5-minute chart, might be noise when viewed on a longer timeframe, such as the daily chart. Confirm the setup on higher timeframes to reduce the risk of trading on short-term fluctuations that don’t reflect the overall trend.
3. Watch volume closely
Volume is a key indicator of the strength behind a move. Weak volume during a breakout or breakdown can signal that the move lacks real conviction, increasing the likelihood of a reversal.
4. Use technical indicators effectively
Indicators like RSI, MACD, or moving averages can help confirm price action. For example, RSI divergence can alert you to potential bull or bear traps. Use these alongside price action and volume for a more holistic analysis.
5. Set stop-losses wisely
Always define clear risk boundaries. Place your stop-loss at a point where the trade setup becomes invalid (e.g., below key support for a long position or above resistance for a short). Avoid placing stops at arbitrary levels or round numbers, as these may be targeted by market makers.
Trading based on FOMO (fear of missing out) or emotional reactions to news often leads to entering trades too early or in the wrong direction. Stick to your strategy, and avoid chasing the market based on short-term price action.
In Summary
Bull traps and bear traps are deceptive price movements that can confuse traders. A bull trap occurs when a breakout above resistance fails, causing prices to reverse downward, while a bear trap happens when a breakdown below support quickly reverses, trapping short-sellers. Understanding the key differences between these traps helps traders avoid costly mistakes and make more informed decisions.
Start Trading Today With VT Markets
VT Markets provides traders with an intuitive and feature-rich trading platform, MetaTrader 4 and MetaTrader 5, designed to help identify and avoid common market pitfalls like bull and bear traps. With advanced trading tools, customizable indicators, and comprehensive market analysis, VT Markets equips traders with the necessary courses to make informed decisions and navigate price fluctuations with confidence.
A bear trap occurs when the price breaks below support, leading traders to believe the market is headed lower. However, the price quickly reverses and rises, trapping short-sellers who entered expecting further declines.
2. What is a bull trap?
A bull trap happens when the price breaks above resistance, creating the illusion of a bullish trend. However, the price reverses and falls, leaving traders who bought into the breakout caught in a losing position.
3. What is the difference between a bull trap and a bear trap?
A bull trap involves a false breakout above resistance that quickly reverses downward, while a bear trap involves a false breakdown below support that rebounds upward. Both traps mislead traders into entering the wrong positions.
4. How can I avoid bull traps and bear traps?
To avoid these traps, look for confirmation before entering trades. Wait for volume confirmation, check for divergence on technical indicators, and ensure price actions are consistent across multiple timeframes. Always manage risk with proper stop-loss orders.
5. What tools can help traders avoid traps?
Technical indicators like RSI, MACD, and volume analysis can help identify potential traps by showing divergences or lack of momentum. Advanced charting platforms also provide real-time market data, enabling traders to spot traps before they happen.
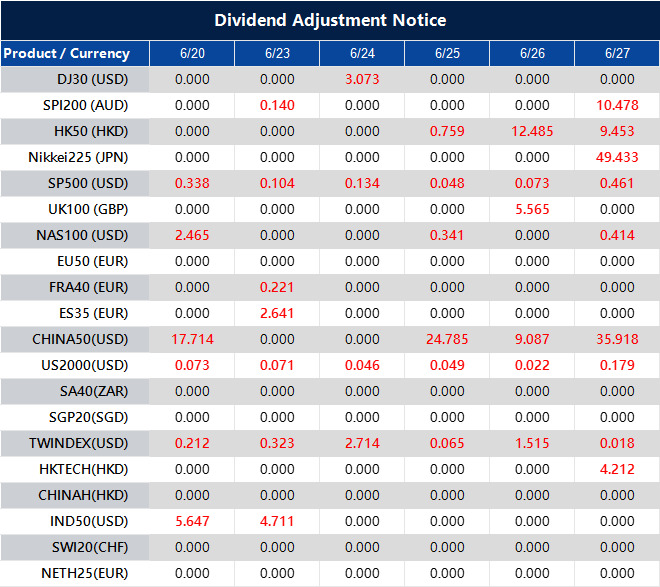
Please note that the dividends of the following products will be adjusted accordingly. Index dividends will be executed separately through a balance statement directly to your trading account, and the comment will be in the following format “Div & Product Name & Net Volume”.
Please refer to the table below for more details:
The above data is for reference only, please refer to the MT4/MT5 software for specific data.
If you’d like more information, please don’t hesitate to contact info@vtmarkets.com.
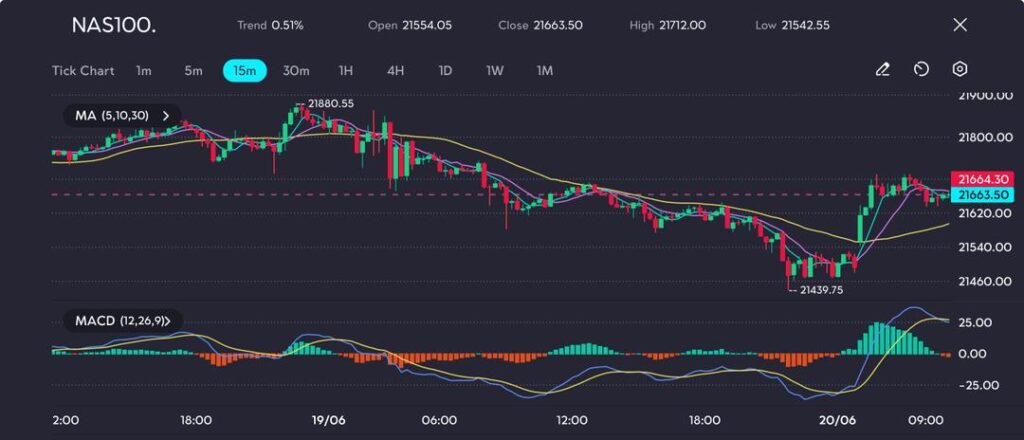
Geopolitical tensions continue to cast a shadow over global markets, leaving investors cautious and risk appetite subdued. Amid the uncertainty, the Nasdaq 100 is showing early signs of recovery, with technical indicators pointing to a potential short-term rebound.
Nasdaq 100 rebounds amid tension
The Nasdaq 100 posted a modest recovery in early Friday trade, bouncing from an intraday low of 21,439.75 to finish the session around 21,663.50.
After opening flat and initially extending overnight losses, the tech-heavy index found some stability as the MACD histogram flipped into positive territory and prices climbed above short-term 15-minute moving averages.
This rebound unfolded amid a cautious mood across Asian markets, driven by ongoing geopolitical tensions.
Traders remained wary as Israel continued targeted airstrikes on Iranian nuclear sites, prompting retaliatory missile and drone attacks from Iran.
With the conflict now entering its second week and no diplomatic resolution in sight, uncertainty remained elevated.
Adding to market jitters, reports suggest former President Donald Trump has given himself a two-week window to consider potential US military intervention.
This pattern echoes previous foreign policy flashpoints and has introduced fresh ambiguity into global risk sentiment.
Overnight, Nasdaq and S&P 500 futures slipped 0.3% during Asian trading hours, as traders reacted to headlines in the absence of US market activity due to the Juneteenth holiday.
Technical outlook
From a technical perspective, the Nasdaq 100 appears to be staging a rebound after finding support at the 21,439.75 level.
The index had previously peaked near 21,880.55 on 19 June before entering a descending channel, characterised by lower highs and lower lows ‒ signalling short-term bearish momentum.
Picture: Bulls regain footing after sharp Nasdaq dip, as seen on the VT Markets app.
Friday’s recovery saw the index push above both the 5 and 10-period exponential moving averages, supported by rising price momentum.
The MACD indicator has printed a bullish crossover from oversold levels, with a strong green histogram that has started to flatten ‒ indicating that early upside momentum may be losing steam.
Currently, the Nasdaq 100 (NAS100) is testing the 21,660–21,680 resistance zone, which previously served as a consolidation area during the recent decline.
A decisive move above 21,712 ‒ the session’s intraday high ‒ could open the door for a push towards the 21,800 level.
However, failure to clear this barrier may trigger a pullback towards 21,580 or even 21,540, where the rising 30 EMA is beginning to offer technical support.
A breakout above 21,712 could re-ignite bullish sentiment, while a drop below 21,500 would likely invite renewed selling pressure ‒ particularly if geopolitical developments in the Middle East worsen.
Trading can be exciting, but without a clear plan, it’s easy to get caught up in the emotions of the market. Whether it’s fear, greed or hesitation, emotions often lead to poor decisions — and unnecessary losses.
That’s why two of the most important tools in any trader’s toolkit are the stop-loss and take-profit orders. These simple but powerful features can help you protect your capital, lock in profits and trade with more confidence — even if you’re just starting out.
In this article, we’ll break down exactly what these tools are, how they work, and how you can start using them in your own trading today.
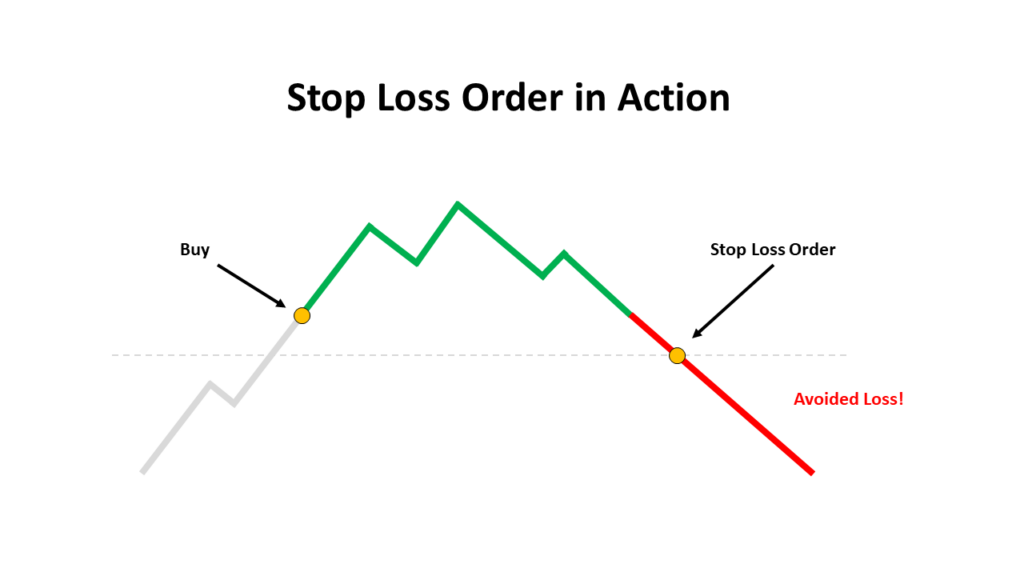
What is a stop-loss order?
A stop-loss order is a tool that automatically closes your trade if the market moves against you by a certain amount. Its main purpose is to limit how much you lose on a single trade.
Let’s say you buy EUR/USD at 1.1000, and you’re willing to risk 50 pips. You set your stop-loss at 1.0950. If the market falls to that level, your trade is automatically closed — no need to be at your screen.
This means you don’t have to constantly monitor the charts or panic during fast market moves. You’ve already set the maximum loss you’re willing to take, and the platform does the rest.
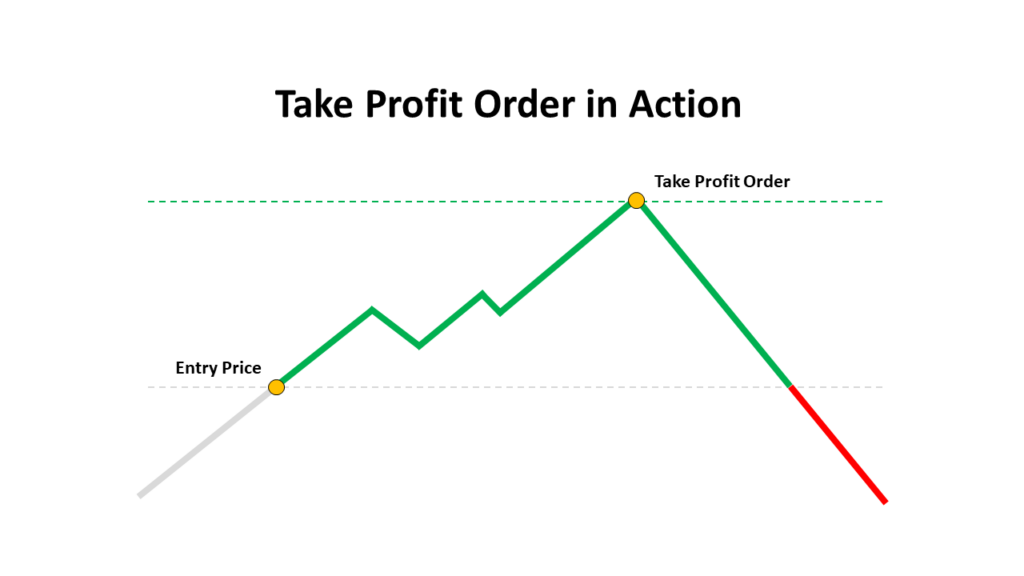
What is a take-profit order?
A take-profit order works in the opposite direction. It automatically closes your trade when the price hits your chosen profit target.
For example, if you sell GBP/USD at 1.2700 and want to take profit at 1.2600, you simply set your take-profit at that level. Once the price drops to 1.2600, your trade is closed, and the profit is locked in.
This helps you avoid the temptation to “let it run” and risk giving back your gains. It’s especially useful when you can’t be at your computer or want to remove emotions from your decision-making.
Why stop-loss and take-profit orders matter
The market can move in unexpected ways — especially around major news events or during volatile sessions. Stop-loss and take-profit orders help you manage this uncertainty with clear, pre-planned exits.
Here’s why they matter:
They protect your account from big losses.
They reduce emotional trading by removing the need to make snap decisions.
They improve discipline and help you stick to your strategy.
They support consistent risk management, especially when combined with proper lot sizing.
No strategy wins 100% of the time, but smart use of SL and TP helps you stay in the game and grow steadily over time.
Note: During major events or extreme volatility, prices can sometimes “gap” past your stop-loss or take-profit level. This is rare, but it’s something to be aware of.
How to set stop-loss and take-profit levels
There’s no one-size-fits-all method, but here are a few common approaches to help you set smart levels.
One is the percentage-based approach. Decide how much of your capital you’re willing to risk per trade — for example, 1–2%. If your account is $1,000 and you’re risking 2%, your maximum loss per trade is $20. From there, calculate your stop-loss distance and lot size accordingly.
You can also use technical analysis to guide your levels. Support and resistance zones, trendlines, moving averages and indicators like the Average True Range (ATR) can help you identify logical price points to exit a trade — both for cutting losses and taking profits.
For example, you buy AUD/USD at 0.6600. You identify a recent support level at 0.6550 and resistance at 0.6700. You set your stop-loss at 0.6550 (50 pips below entry) and your take-profit at 0.6700 (100 pips above entry). This gives you a risk-to-reward ratio of 1:2, meaning you’re risking 1 unit to potentially gain 2 — a smart rule for beginner traders.
Most platforms, including VT Markets’ MetaTrader 4/5 and mobile app, allow you to set stop-loss and take-profit levels when opening a trade or at any time while it’s active.
Common mistakes to avoid
Even experienced traders make mistakes — but you can avoid the most common ones:
Setting your stop-loss too close to your entry price. This can lead to getting stopped out by normal market fluctuations. Give your trade enough room to breathe by considering volatility and market structure.
Placing your stop-loss too far away. While it might reduce the chance of being stopped out early, it can expose you to losses larger than your planned risk.
Moving your stop-loss further once the trade goes against you. This is usually an emotional reaction, not part of a strategy. It often turns a manageable loss into a much bigger one.
Not using stop-loss or take-profit orders at all. Leaving trades unmanaged can result in uncontrolled risk, especially during fast market moves or news events.
Always plan your stop-loss and take-profit levels before entering a trade. It’s one of the simplest ways to stay disciplined and protect your capital.
Final tips for beginners
The most important thing you can do is treat stop-loss and take-profit orders as part of your trading plan — not as an afterthought. Deciding where to exit a trade should happen before you enter it. This helps you stay disciplined and prevents emotional decision-making when the market gets unpredictable.
Practising in a demo account is a smart way to build confidence. It allows you to test different stop-loss and take-profit strategies, experiment with lot sizes, and learn from your mistakes without risking real money. Once you’re comfortable, applying the same structure in a live account becomes much easier.
It’s also worth reviewing your trades regularly. Looking back at where your stop-loss or take-profit was triggered — and why — can teach you a lot about your trading patterns. You’ll start to notice what works, what doesn’t, and how to fine-tune your strategy over time.
And finally, don’t be discouraged by small losses. They’re part of the process. Protecting your capital is more important than trying to win every single trade. With consistent use of stop-loss and take-profit orders, you’ll be better equipped to manage risk — and trade with more clarity and control.
Conclusion
Mastering stop-loss and take-profit orders is a key step in becoming a more disciplined, consistent trader. These tools don’t just protect your capital — they give your strategy structure, help you stay focused, and remove emotion from your decisions.
If you’ve been practising in a demo environment, now’s the time to apply those skills in real market conditions. A live account with VT Markets gives you everything you need to trade with confidence — from flexible order types to advanced tools and expert support.
You’ve built the foundation. Now take the next step and bring your strategy to life.
The US dollar is showing renewed strength as traders respond to a softer Fed stance and escalating geopolitical risks. With monetary policy easing on the horizon and safe-haven demand rising, the greenback is holding firm despite market volatility.
Fed policy shift boosts dollar momentum
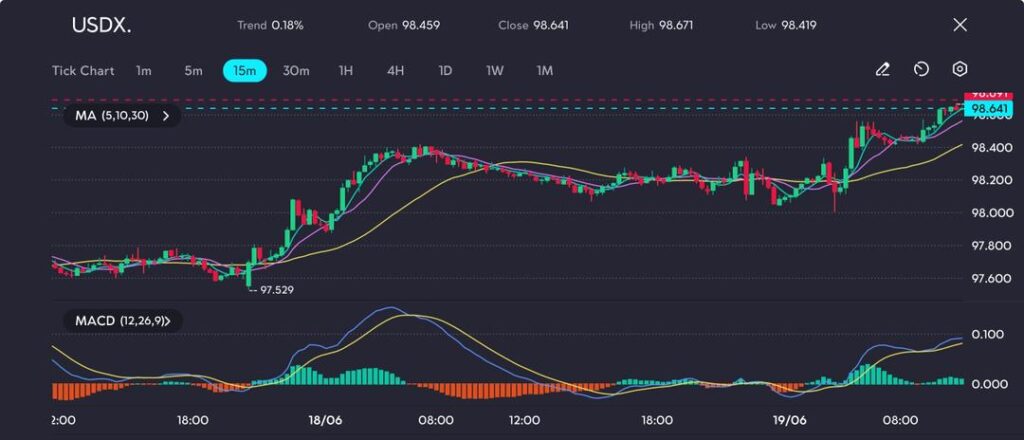
The US Dollar Index (USDX) remained resilient near 98.9 on Thursday, consolidating after a week of sharp movements influenced by central bank messaging and heightened geopolitical uncertainty.
The index ended the day at 98.641, slightly below its intraday peak of 98.671, yet holding above a key resistance zone—a sign of sustained bullish momentum.
The US economy is decelerating so much that we should expect Fed rate cuts to resume in September. That’s largely bullish for Treasuries but bearish for the US dollar and equities. https://t.co/7o23v3rudx
This strength in the US dollar followed the Federal Reserve’s latest policy update, where the central bank kept interest rates unchanged but adopted a more dovish tone than markets had expected.
Chair Jerome Powell highlighted potential inflationary pressures driven by trade tensions and tariff-related disruptions under President Trump’s policies, warning that price growth could reaccelerate.
In a surprise move, the Fed revised its 2025 forecast, now expecting two 25 basis point rate cuts, up from the previously anticipated one.
This dovish shift has led to significant repositioning across Treasury yields and forex markets, drawing renewed inflows into the greenback.
Geopolitical tensions fuel safe-haven demand
The dollar’s appeal has also been reinforced by its safe-haven status, especially as global risk sentiment deteriorates.
The Israel–Iran conflict, now in its second week, has introduced a war-risk premium across asset classes.
Although US officials have not confirmed any involvement, reports suggest contingency plans are in development in case of further escalation.
Escalating tensions were intensified by a strong warning from Iran’s Supreme Leader Ayatollah Ali Khamenei, who declared that any US military intervention would cause “irreparable damage.”
This rhetoric has driven traders toward defensive assets—with the US dollar among the key beneficiaries in times of heightened uncertainty.
Technical analysis: Bullish momentum intact for USDX
On the 15-minute chart, the US Dollar Index is forming a strong bullish continuation pattern.
After establishing a base near 97.529, the index has steadily moved higher, producing a series of higher lows and higher highs, and reaching 98.641.
Consolidation breakout pushes USDX toward fresh highs, as seen on the VT Markets app.
The moving averages (5, 10, and 30 periods) are aligned in a bullish formation, with the shorter-term MAs consistently leading above the 30-period average—confirming the current uptrend.
The MACD supports this view, with a positive-expanding histogram and the MACD line remaining above the signal line, both indicating strong upward momentum.
Price briefly consolidated between 98.20 and 98.40, forming a bullish flag pattern that resolved to the upside.
With minimal retracement after breakout, the price is now testing fresh highs, signalling continued buyer dominance.
Looking ahead, the US dollar may continue to benefit from risk-off sentiment in global markets.
However, if inflation pressures return while the Fed remains committed to rate cuts, the greenback could face conflicting macro forces. As long as USDX stays above 98.4, the short-term bullish bias remains intact.
With both dovish signals from the Federal Reserve and escalating Middle East tensions, the US dollar is being supported by a dual narrative of monetary policy recalibration and safe-haven demand.
Technical indicators confirm the bullish outlook, though traders should remain cautious of shifting macroeconomic conditions that could challenge the current trend.
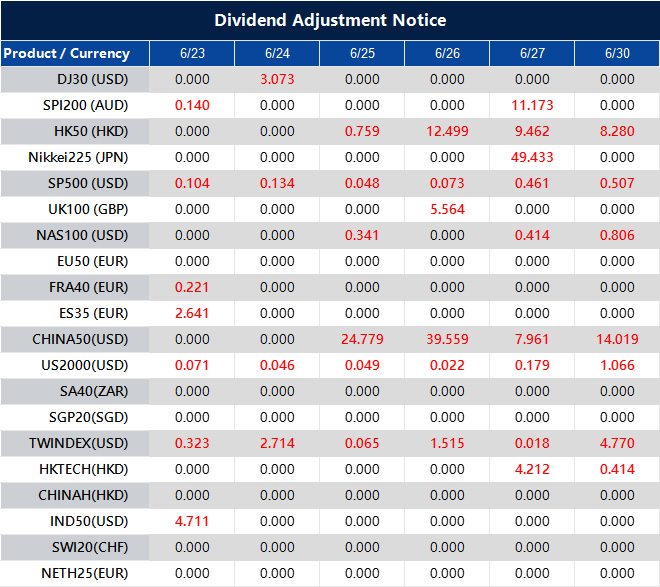
Please note that the dividends of the following products will be adjusted accordingly. Index dividends will be executed separately through a balance statement directly to your trading account, and the comment will be in the following format “Div & Product Name & Net Volume”.
Please refer to the table below for more details:
The above data is for reference only, please refer to the MT4/MT5 software for specific data.
If you’d like more information, please don’t hesitate to contact info@vtmarkets.com.
VT Markets Launches Global Trading Competition with a USD1,000,000 Prize Pool, Focusing on Strategy, Precision, and Performance
19 June 2025 – Sydney, Australia – VT Markets, a leading multi-asset brokerage, is raising the stakes for traders worldwide with the launch of the VT Trading Arena – a high-intensity, 10-week global competition with up to USD1,000,000* in cash prizes up for grabs.
Running from 23 June to 31 August 2025, the VT Trading Arena is set to be one of the standout trading events of the year and a centrepiece of VT Markets’ 10th anniversary celebration. Open to traders of all levels, the VT Arena offers a world-class competitive stage where participants can test their skills, sharpen their strategies, and compete for global recognition, exclusive rewards, and their share of one of the largest prize pools in the industry.
With a total prize pool of USD1,000,000, the competition is divided into two tiers to cater to all experience levels. The Beginner Tier prize pool stands at a total of USD300,000, whereas the Advanced Tier is allocated USD700,000. This tiered structure allows traders to compete within their skill range while still aiming for the respective top prizes.
In addition to the main prize pool, participants can win extra cash prizes, including a grand prize of USD10,000 for the top trader every 5 weeks. The second-place finisher will receive USD7,000, and third place will earn USD3,000 – providing multiple opportunities to win beyond the main prizes.
To participate, traders simply need to open a VT Markets account, deposit a minimum of USD1,000 and meet the competition’s minimum trade requirements to qualify. Each eligible deposit earns one spin on the prize wheel, offering even more chances to win attractive prizes such as USD1,000 in cash, trading vouchers, hospitality tickets to exclusive match and race days, and more.
The global trading competition is designed not only to offer a thrilling experience, but also to foster a sense of community among traders worldwide. With a decade of innovation behind it, VT Markets is using this milestone moment to transform the trading experience — turning it into a global avenue of ambition, excellence, and opportunity.
For full details on how to participate, eligibility requirements, how to win, and the full list of prizes, please visit: https://vttradingarena.com/
*Terms and Conditions apply.
About VT Markets
VT Markets is a regulated multi-asset broker with a presence in over 160 countries as of today. It has earned numerous international accolades including Best Online Trading and Fastest Growing Broker. In line with its mission to make trading accessible to all, VT Markets offers comprehensive access to over 1,000 financial instruments and clients benefit from a seamless trading experience via its award-winning mobile application.
Japanese markets gained strength as a weaker yen and positive investor sentiment boosted equities and commodities. Despite some cautious economic data, overall momentum remains upbeat with potential for further gains.
Japanese equities surge on softer yen and strong risk appetite
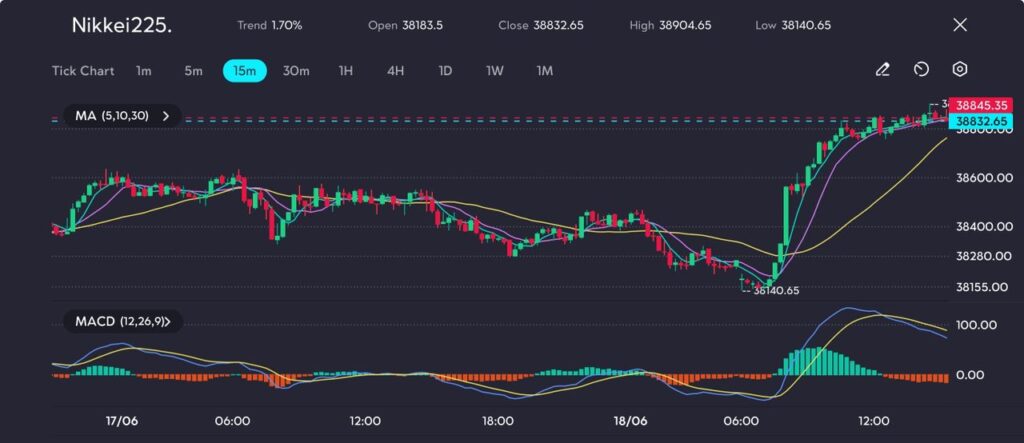
Japanese stocks surged notably on Wednesday, with the Nikkei 225 closing at 38,832.65 – its highest level in four months – driven by a softer yen and renewed investor confidence in risk assets.
The Bank of Japan’s decision to hold interest rates and slow its withdrawal from the bond market was widely expected and should help reassure investors, though there will be plenty of interest in Governor Ueda’s press conference, analysts said. https://t.co/jH4vjHDbii
The index climbed 1.7% during the session, gaining momentum in the afternoon after breaking above the 38,140.65 intraday support. The Nikkei peaked at 38,904.65 before slightly retreating to close near its highs.
This bullish sentiment extended to commodity-linked markets. Osaka Exchange rubber futures for November delivery rose 2.69%, settling at 305 yen per kilogram, reaching an intraday peak of 305.6 yen, the highest since late May.
Weather and currency trends support commodity and equity gains
Weather disruptions continue to underpin the rally, as heavy rainfall hampers rubber tapping operations in Japan and major producers like Thailand.
Flash flood warnings issued for 20–23 June in Thailand have heightened concerns over potential crop damage and near-term supply constraints.
Currency moves further boosted Japanese equities. The yen slid to a one-week low of 145.445 against the US dollar, enhancing the appeal of Japanese stocks to foreign investors.
The inverse relationship between the yen and the Nikkei remains intact, with a weaker yen supporting exporters and attracting overseas demand for yen-denominated assets.
However, Japan’s recent macroeconomic data added a cautious note. Exports declined in May for the first time in eight months, largely due to lower automobile shipments.
Ongoing US tariffs are pressuring Japanese car exports, raising concerns about potential weakening in rubber demand if manufacturing activity slows.
Despite this, immediate supply tightness coupled with speculative buying appears to be the dominant factor driving prices currently.
Technical analysis: Momentum and resistance levels to watch
The Nikkei 225 demonstrated strong gains during the latter part of Wednesday’s trading, closing at 38,832.65 – up more than 1.7% from the opening level.
Buyers drive late-session rally toward key resistance zone, as seen on the VT Markets app.
After a period of consolidation through much of 17 and early 18 June, the index broke decisively above the 38,140.65 support, triggering a sharp rally that hit an intraday high of 38,904.65 before easing slightly near the close.
Technical indicators confirm the bullish momentum. The MACD histogram displayed several robust green bars, signalling upward pressure, although the MACD line’s slope is flattening, suggesting possible short-term fatigue.
Price action is approaching resistance in the 38,850 to 38,900 range, a zone that has previously capped advances.
Meanwhile, the 5-, 10-, and 30-period exponential moving averages (EMAs) remain bullishly aligned and sharply diverging, reinforcing the strength of the current trend.
Given persistent adverse weather forecasts and prevailing risk-on sentiment in Tokyo, the Nikkei and rubber futures may continue to face upward pressure through the week.
Traders should closely monitor evolving weather conditions and Bank of Japan policy announcements, as these factors could trigger either a pause or acceleration in price movements.
Please note that the dividends of the following products will be adjusted accordingly. Index dividends will be executed separately through a balance statement directly to your trading account, and the comment will be in the following format “Div & Product Name & Net Volume”.
Please refer to the table below for more details:
The above data is for reference only, please refer to the MT4/MT5 software for specific data.
If you’d like more information, please don’t hesitate to contact info@vtmarkets.com.


 | VT Markets")


 | VT Markets")


 | VT Markets")