Back

Uptrends, downtrends, and profits: Master trend analysis

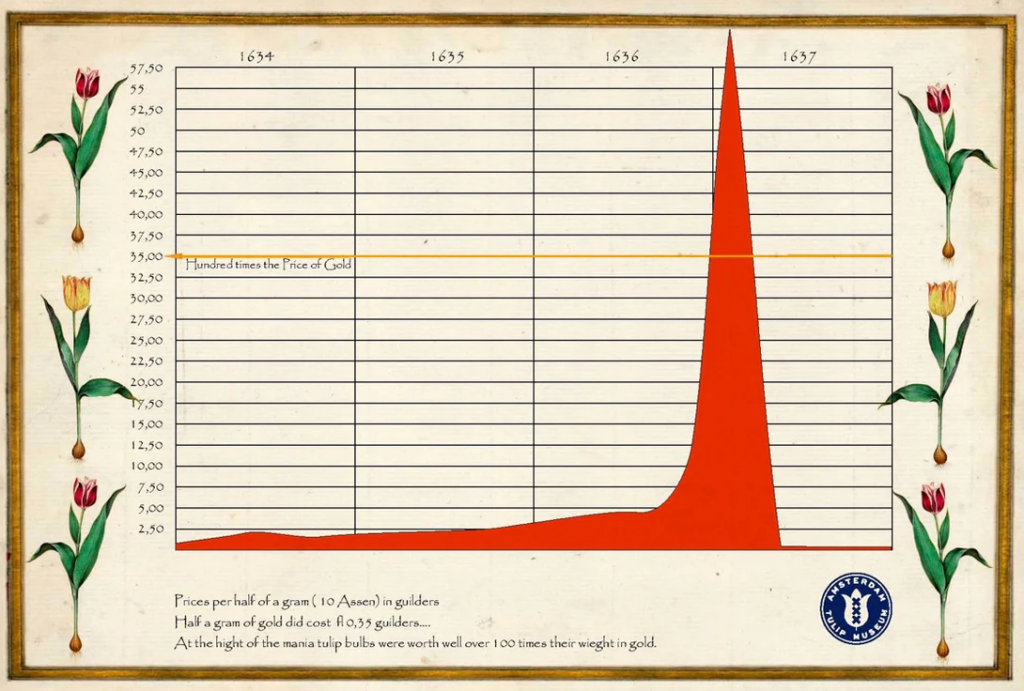
In the 1630s, the Dutch Republic was gripped by an extraordinary financial phenomenon known as Tulip Mania. Tulip bulbs became so coveted that their prices skyrocketed, with some rare varieties fetching sums equivalent to luxurious houses. At its peak, a single bulb could sell for more than 10 times the annual income of a skilled craftsman.

However, this bubble burst spectacularly in February 1637, leaving many investors ruined. Had modern trend analysis tools been available, traders might have spotted the unsustainable uptrend and the signs of an impending reversal, potentially avoiding catastrophic losses.

Today’s financial markets are vastly more sophisticated, but the fundamental concept of identifying and following trends remains crucial for traders. Whether you are dealing in stocks, commodities, or cryptocurrencies, understanding trend analysis and employing effective trend trading strategies can significantly enhance your trading performance.

What is trend analysis?

Trend analysis is the process of examining historical price data to identify patterns and predict future price movements. At its core, it’s about recognising the direction in which an asset’s price is moving over time.

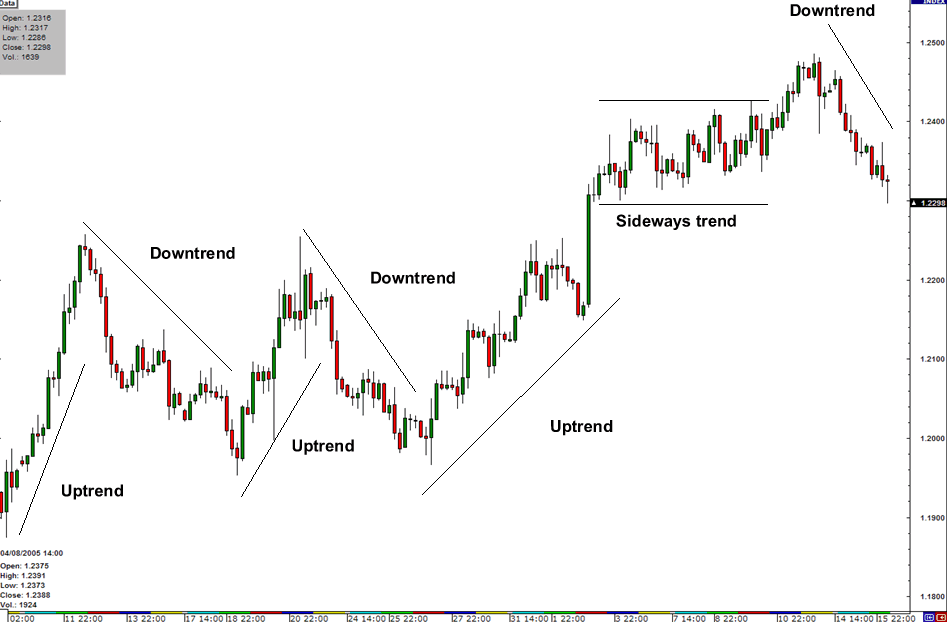
There are three primary types of trends:

1. Uptrends: Characterised by higher highs and higher lows.

2. Downtrends: Marked by lower highs and lower lows.

3. Sideways trends: When prices move within a horizontal range.

It’s important to note that trends can exist across various timeframes – from minutes to years. A stock might be in a long-term uptrend on a weekly chart but experiencing a short-term downtrend on a daily chart. This multi-timeframe nature of trends underscores the importance of clearly defining your trading horizon.

Key tools for trend analysis

Several tools can help traders identify and confirm trends.

Moving averages

These smooth out price data to create a single flowing line, making trends easier to spot. The two most common types are:

  • Simple Moving Average (SMA): Calculates the average price over a specific number of periods.
  • Exponential Moving Average (EMA): Gives more weight to recent prices, making it more responsive to new information.

Trendlines and channels

Trendlines are drawn by connecting a series of highs or lows. When prices move between two parallel trendlines, it forms a channel. These visual tools help traders see the overall direction and potential support/resistance levels.

Technical indicators

These mathematical calculations based on price and/or volume can provide additional insights. Popular ones include:

  • Moving Average Convergence Divergence (MACD): Helps identify trend changes and momentum.
  • Relative Strength Index (RSI): Measures the speed and change of price movements.

For example, if the price of Apple stock is consistently staying above its 50-day moving average, and the MACD line is above its signal line, these could be strong indications of an uptrend.

Identifying trends

Spotting the beginning of a trend early can lead to significant profits, but it’s not always straightforward. Here are some key points to consider:

1. Look for a series of higher highs and higher lows for an uptrend, or lower highs and lower lows for a downtrend.

2. Confirm the trend with multiple indicators. For instance, an uptrend might be confirmed when prices are above a moving average, and the RSI is above 50.

3. Be aware of potential trend reversals. These often start with a failure to make a new high (in an uptrend) or a new low (in a downtrend).

Remember, no single indicator is foolproof. Always look for confirmation from multiple sources before making trading decisions.

Popular trend trading strategies

Once you’ve identified a trend, how do you profit from it? Here are three common strategies.

Trend following

This strategy involves entering trades in the direction of the established trend. Traders might buy when the price crosses above a moving average in an uptrend, or sell when it crosses below in a downtrend.

  • Pros: Can lead to large profits if you catch a strong trend.
  • Cons: Can result in numerous small losses during choppy, trendless periods.

Breakout trading

This involves entering a trade when the price breaks through a significant level, anticipating that the breakout will lead to a new trend.

  • Pros: Can get you into a trend early.
  • Cons: Many breakouts fail, leading to quick losses (false breakouts).

Pullback trading

In this strategy, traders wait for a temporary move against the trend (a pullback) before entering in the direction of the main trend.

  • Pros: Often provides a better risk-to-reward ratio.
  • Cons: You might miss the trade if the pullback doesn’t occur.

For instance, in an uptrend, a trader might wait for the price to pull back to a rising trendline or a key moving average before buying, anticipating that the uptrend will resume from this level.

Risk management in trend trading

While trend trading can be profitable, it’s crucial to manage risks effectively:

1. Always use stop-loss orders to limit potential losses. In trend trading, these are often placed just below recent swing lows (for longs) or above recent swing highs (for shorts).

2. Proper position sizing is vital. Never risk more than a small percentage (many professionals suggest 1-2%) of your trading capital on a single trade.

3. Avoid over-leveraging. While leverage can amplify profits, it can also lead to substantial losses if a trade goes against you.

Remember, no trend lasts forever, and even the strongest trends will have counter-trend moves. Always be prepared for the unexpected.

In conclusion, trend analysis and trend trading strategies are powerful tools in a trader’s arsenal. By learning to identify trends, confirm them with multiple tools, and apply appropriate trading strategies, you can enhance your trading performance. However, always remember that trading carries inherent risks. Practice these techniques with a demo account, continually educate yourself, and always trade within your risk tolerance.

Ready to apply these strategies in real markets? Open a live account with VT Markets today. With advanced charting tools and a wide range of assets, VT Markets provides an ideal platform for trend traders. Start your journey now, but remember to trade responsibly.

Dividend Adjustment Notice – Oct 3,2024

Dear Client,

Please note that the dividends of the following products will be adjusted accordingly. Index dividends will be executed separately through a balance statement directly to your trading account, and the comment will be in the following format “Div & Product Name & Net Volume ”.

Please refer to the table below for more details:

The above data is for reference only, please refer to the MT4/MT5 software for specific data.

If you’d like more information, please don’t hesitate to contact info@vtmarkets.com.

Dividend Adjustment Notice – Oct 02,2024

Dear Client,

Please note that the dividends of the following products will be adjusted accordingly. Index dividends will be executed separately through a balance statement directly to your trading account, and the comment will be in the following format “Div & Product Name & Net Volume ”.

Please refer to the table below for more details:

The above data is for reference only, please refer to the MT4/MT5 software for specific data.

If you’d like more information, please don’t hesitate to contact info@vtmarkets.com.

Dividend Adjustment Notice – Oct 01,2024

Dear Client,

Please note that the dividends of the following products will be adjusted accordingly. Index dividends will be executed separately through a balance statement directly to your trading account, and the comment will be in the following format “Div & Product Name & Net Volume ”.

Please refer to the table below for more details:

The above data is for reference only, please refer to the MT4/MT5 software for specific data.

If you’d like more information, please don’t hesitate to contact info@vtmarkets.com.

Notification of Trading Adjustment in Holiday (Updated) – Oct 1,2024

Dear Client,

Affected by international holidays, the trading hours of some VT Markets products will be adjusted.

Please check the following link for the affected products:

Notification of Trading Adjustment in Holiday (Updated)

Note: The dash sign (-) indicates normal trading hours.

Friendly Reminder:

The above data is for reference only, please refer to the MT4/MT5 software for specific data.

If you’d like more information, please don’t hesitate to contact info@vtmarkets.com

Dividend Adjustment Notice – Sep 30,2024

Dear Client,

Please note that the dividends of the following products will be adjusted accordingly.

Index dividends will be executed separately through a balance statement directly to your trading account, and the comment will be in the following format “Div & Product Name & Net Volume ”.

Please refer to the table below for more details:

The above data is for reference only, please refer to the MT4/MT5 software for specific data.

If you’d like more information, please don’t hesitate to contact info@vtmarkets.com.

Dividend Adjustment Notice – Sep 27,2024

Dear Client,

Please note that the dividends of the following products will be adjusted accordingly. Index dividends will be executed separately through a balance statement directly to your trading account, and the comment will be in the following format “Div & Product Name & Net Volume ”.

Please refer to the table below for more details:

The above data is for reference only, please refer to the MT4/MT5 software for specific data.

If you’d like more information, please don’t hesitate to contact info@vtmarkets.com.

A Complete Guide To What is an Overweight Stock?

Understanding an Overweight Stock / Overweight Shares

An overweight stock is a classification given by analysts or investment firms when they believe that a stock is poised to outperform the market or its sector. It suggests that the stock is expected to deliver higher returns than the benchmark index or other stocks in the same category. The term “overweight” is part of a rating system where analysts recommend whether investors should hold more of a particular stock in their portfolio than typically advised.

In simpler terms, if an analyst rates a stock as overweight, it means they believe that the stock offers strong potential for growth and is worth allocating more capital compared to other stocks or the industry average. It’s the opposite of terms like underweight (indicating expected underperformance) or equal weight (suggesting the stock should be held in the same proportion as others in the index or sector).

How Analysts Use Overweight Ratings

When analysts give an overweight rating, it’s typically based on in-depth research that looks at a company’s financial health, earnings potential, and competitive position in the market. Analysts often compare the stock to other companies in the same sector or to the benchmark index (such as the S&P 500) to determine whether it is likely to generate better returns. An overweight rating is a signal for investors to consider increasing their holdings in that stock relative to others.

For example, if an investment fund normally holds 5% of a stock within a portfolio but an analyst rates it as overweight, they may recommend increasing the stock allocation to 7% or more because of its expected strong performance.

Overweight vs. Other Ratings

Understanding how an overweight stock fits into an overall investment strategy is crucial. Let’s break down the common ratings used by analysts:

  • Overweight: The stock is expected to outperform the market or sector, suggesting investors should allocate more funds to it.
  • Equal Weight: The stock is expected to perform in line with the market or sector, meaning investors should hold it in equal proportion to other stocks in their portfolio.
  • Underweight: The stock is expected to underperform, so investors are advised to allocate less of their portfolio to it.

Why Would a Stock Be Rated Overweight?

Several factors can lead to a stock being rated overweight:

  • Strong Earnings Growth: Companies that demonstrate consistent earnings growth may be rated overweight due to their potential to outperform peers.
  • Positive Industry Trends: A stock in a booming sector (e.g., technology or renewable energy) may receive an overweight rating if it’s positioned to benefit from industry growth.
  • Undervalued Stock Price: Analysts may believe the current stock price is undervalued relative to the company’s future potential, making it a good time to buy.
  • Favourable Economic Conditions: External factors, such as low interest rates or strong consumer demand, can make a company’s stock more attractive, justifying an overweight rating.

How to Use Overweight Stock Ratings

If you’re an investor looking to optimise your portfolio, an overweight rating can serve as a buy signal. However, it’s essential to use these ratings as part of a broader investment strategy, not as the sole reason to buy a stock. Combining an overweight rating with your own research on the company’s financials, management, and industry trends can help you make more informed investment decisions.

For example, if an analyst rates a technology stock as overweight due to its leadership in artificial intelligence, you should investigate whether the company’s financials back up this claim. Look into factors like revenue growth, profit margins, and competitive advantages before making your move.

Risks of Overweight Stock Ratings

While an overweight rating can indicate strong potential, there are always risks involved:

  • Market Conditions Change: Economic downturns or shifts in industry trends could negatively impact even the most promising stocks.
  • Overvaluation: Sometimes a stock that appears overweight may become overvalued, meaning its price has climbed too high relative to the company’s actual performance. This could lead to a correction in the stock price.
  • Short-Term Volatility: Overweight stocks may experience short-term volatility that could cause a temporary dip in stock price, even if the long-term outlook remains positive.

How Should Beginners Interpret Overweight Stocks?

For beginners, an overweight rating is a positive signal, suggesting the stock could outperform others. However, it’s important not to rely solely on this rating. Always combine it with your own research—check the company’s financial health and current market trends. Diversification is also key for beginners; spreading your investments across several stocks can help manage risk and provide more stability.

Should Beginners Trade Overweight Stocks via CFDs?

Yes and No. Yes, because CFDs allow you to profit from both rising and falling markets, making them appealing when trading overweight stocks. However, no if you don’t fully understand leverage, which can amplify both gains and losses. Beginners should trade small amounts, use a strong risk management strategy, and practice with a demo account before risking real capital.

What is the Starting Capital To Start Trading Overweight Stocks?

The starting capital to trade overweight stocks depends on your broker and stock price. Many brokers let you begin with £500 to £1,000, but it’s crucial to assess your risk tolerance. Beginners should avoid putting all their capital into one overweight stock; instead, consider diversifying across multiple stocks to spread the risk. Also, account for any trading fees and potential losses when deciding on your starting capital.

Should You Buy or Sell an Overweight Stock CFD?

The decision to buy or sell an overweight stock CFD depends on your market outlook. If you believe the stock will rise based on the overweight rating, you might choose to buy. Conversely, if market conditions indicate a decline, consider selling or taking a short position in a CFD. Always ensure you have done thorough research and have a solid risk management strategy in place before making any moves.

Frequently Asked Questions (FAQ): Overweight Stock

1. What does it mean if a stock is rated as overweight?

When a stock is rated as overweight, it indicates that analysts believe the stock is expected to outperform others in the market or its sector. Investors are advised to allocate more capital to this stock compared to others in the same portfolio or index.

2. How does overweight differ from underweight in stock ratings?

An overweight rating suggests the stock will outperform, while an underweight rating signals expected underperformance. Investors are recommended to hold more of overweight stocks and less of underweight ones in their portfolios.

3. Is an overweight rating a buy signal?

Yes, an overweight rating is often interpreted as a buy signal, but it should be combined with further research. Analysts suggest holding more of the stock relative to others due to its potential for higher returns.

4. Should I always invest in overweight-rated stocks?

While overweight ratings suggest positive outlooks, they shouldn’t be the sole factor in your decision. It’s essential to assess the company’s financials, risk tolerance, and market conditions before investing.

5. How do analysts decide to rate a stock as overweight?

Analysts evaluate a stock’s earnings growth, valuation, industry trends, and economic conditions to determine whether it will outperform. They compare it to the company’s competitors and market benchmarks to give an overweight rating.

6. Are there risks in investing in overweight stocks?

Yes, overweight stocks carry risks like overvaluation, market volatility, and changing economic conditions. While analysts may expect outperformance, unexpected market shifts can impact stock performance.

7. How often should I check overweight ratings for updates?

Analyst ratings can change frequently based on new financial reports, market trends, and economic events. It’s a good idea to regularly check for updates and review any changes to the stock’s outlook.

Wrapping Up

An overweight stock rating is a positive indicator from analysts, suggesting the stock has strong growth potential and may outperform the market or its peers. It encourages investors to allocate more capital to the stock compared to others in their portfolio. However, while these ratings can be helpful, they should be used alongside personal research and consideration of the overall market conditions. Whether you’re a seasoned investor or new to the market, understanding what an overweight stock means can help you make more strategic investment decisions.

Ready to start trading overweight stocks? Apply what you’ve learned with VT Markets, manage your risk, and explore Shares CFD trading with confidence. Begin your trading journey today!

The Fed’s rate cut: What every trader needs to know

The Federal Reserve’s recent decision to cut interest rates by 50 basis points could make or break your trading strategy.

On 18 September 2024, the Fed lowered the federal funds rate, adjusting the target range to between 4.75% and 5%. Whether you’re invested in stocks, bonds, or even cryptocurrencies, this move affects how you should approach the market.

In this article, we will break down the immediate and long-term impacts across different markets and provide actionable tips to help you navigate these changes.

Understanding the Fed rate cut

The federal funds rate is the interest rate at which banks lend money to each other overnight. By adjusting this rate, the Federal Reserve aims to influence broader economic conditions. The recent 50-basis-point cut signifies the Fed’s intent to stimulate economic growth and combat potential recessionary pressures.

Historically, rate cuts have often led to increased market activity. For instance, the series of rate cuts in 2001 and 2008 initially spurred stock market rallies, though these were tempered by concurrent economic challenges. Understanding these patterns can provide valuable context for interpreting current market movements. But how does this play out across different financial markets today?

Impact on currencies

A Fed rate cut typically weakens the US dollar, as lower interest rates reduce the attractiveness of dollar-denominated assets. This can strengthen major currency pairs like EUR/USD and GBP/USD, while emerging market currencies may also appreciate, benefiting countries with dollar-denominated debts.

For forex traders, a weaker USD creates opportunities to trade stronger currencies like the Euro or Yen. However, since the forex market is highly influenced by global economic conditions and geopolitical events, it’s crucial to monitor these trends alongside the rate cut.

Consequences for the stock market

Stock markets generally react positively to rate cuts, as lower borrowing costs can enhance corporate profits and spur economic growth. Sectors like technology, real estate, and utilities often benefit; for instance, real estate firms may capitalise on cheaper financing to boost stock values.

However, financial stocks, especially banks, might struggle due to reduced profit margins, as lower rates narrow the spread between loan and deposit interest. If you’re holding financial stocks, it may be wise to reassess your position.

Keep in mind that stock market reactions can be unpredictable. If the rate cut was anticipated, it may have already been “priced in,” limiting immediate effects. Additionally, factors like slowing GDP growth or rising inflation could lead to a quick reversal of any gains.

Bond market reactions

In the bond market, yields and interest rates move inversely. When the Fed cuts interest rates, bond yields typically fall, driving up the price of existing bonds. This is because older bonds with higher yields become more attractive compared to newly issued ones at the lower rate.

If you already hold bonds, their market value may rise. Corporate bonds, particularly those with higher ratings, may see yield spreads narrow, reflecting the reduced risk of default in a low-rate environment. On the other hand, new bond buyers will face lower returns.

Investors often flock to bonds during times of uncertainty, driving yields even lower in what’s called a “flight to quality.” As a result, you should consider balancing your portfolio between bonds and other assets to manage risk.

Effects on commodities

Commodities, particularly gold, often rise in response to rate cuts. Gold is considered a safe-haven asset, and lower interest rates reduce the opportunity cost of holding non-yielding assets like precious metals. This could push gold prices higher.

Other commodities may also benefit if the rate cut successfully stimulates economic growth. For example, increased industrial activity might boost the demand for metals like copper and steel.

However, the relationship between interest rates and commodity prices isn’t always straightforward, as factors such as global demand, supply chain disruptions, and geopolitical events can play a significant role.

Cryptocurrency market implications

The cryptocurrency market’s reaction to rate cuts can be mixed. Lower rates may encourage risk-taking, drawing investors to high-risk assets like cryptocurrencies. Conversely, rate cuts can signal economic instability, prompting risk-averse investors to avoid volatile assets like Bitcoin and Ethereum.

Bitcoin, known as “digital gold,” might gain from its perceived ability to hedge against inflation, especially amid fears of rising prices from loose monetary policy. However, the crypto market is highly unpredictable and influenced by various factors, so exercise caution.

Long-term effects to consider

While short-term market movements often grab headlines, the long-term effects of a Fed rate cut can have significant consequences:

  • Inflation risk: Lower interest rates can drive inflation as borrowing increases, eroding purchasing power and potentially affecting the real returns on your investments.
  • Sustained growth or overheating? Rate cuts aim to stimulate growth, but rapid economic expansion may lead to asset bubbles, resulting in inflated stock or real estate prices that could trigger market corrections.
  • Global impact: The Fed’s decisions also influence global markets. Other central banks may adjust their policies in response, affecting global trade, investment flows, and currency values.

Actionable tips

Navigating market changes after a Fed rate cut can be challenging. Here are five key strategies:

1. Diversify: Spread investments across stocks, bonds, commodities, and currencies to minimise risk.

2. Monitor indicators: Keep track of inflation, GDP growth, and employment data for economic insights.

3. Use stop-loss orders: Protect against sudden movements by setting stop-loss orders, like 2% below your entry point.

4. Time your trades: Identify as a short-term or long-term investor and adjust your focus accordingly.

5. Stay disciplined: Avoid emotional trading; stick to your strategy during volatility.

Conclusion

The Fed’s recent rate cut will significantly impact financial markets, but each economic situation is unique. While historical patterns provide insight, staying informed and adapting your strategies is crucial.

Now is the time to review your portfolio and make adjustments to align with the new economic landscape. Whether you’re investing in stocks, bonds, forex, or commodities, a diversified approach will enhance your confidence.

Start now by opening a live account with VT Markets to navigate this evolving market landscape.

Dividend Adjustment Notice – Sep 26,2024

Dear Client,

Please note that the dividends of the following products will be adjusted accordingly. Index dividends will be executed separately through a balance statement directly to your trading account, and the comment will be in the following format “Div & Product Name & Net Volume ”.

Please refer to the table below for more details:

The above data is for reference only, please refer to the MT4/MT5 software for specific data.

If you’d like more information, please don’t hesitate to contact info@vtmarkets.com.

Back To Top
server

Hello there 👋

How can I help you?

Chat with our team instantly

Live Chat

Start a live conversation through...

  • Telegram
    hold On hold
  • Coming Soon...

Hello there 👋

How can I help you?

telegram

Scan the QR code with your smartphone to start a chat with us, or click here.

Don’t have the Telegram App or Desktop installed? Use Web Telegram instead.

QR code