We are currently experiencing disruption to our system and services due to the outage of Amazon Web Services (AWS) in the US-EAST-1 region since GMT +3 10:11. It has affected multiple platforms worldwide, including major financial applications.
If you are experiencing unstable connection OR unable to connect across our platforms, we recommend that you take the following measures: 1. Replace VPN node 2. Temporary disable VPN
Please be assured that our technical teams are actively working with AWS to restore full stability. Service recovery remains our top priority, and we thank you for your patience and understanding. In the meantime, if you require urgent assistance, please reach out to your account manager or contact us at info@vtmarkets.com.
For urgent deposit or withdrawal issues, please contact customer service on the official website immediately.
Please note that the dividends of the following products will be adjusted accordingly. Index dividends will be executed separately through a balance statement directly to your trading account, and the comment will be in the following format “Div & Product Name & Net Volume”.
Please refer to the table below for more details:
The above data is for reference only, please refer to the MT4/MT5 software for specific data.
If you’d like more information, please don’t hesitate to contact info@vtmarkets.com.
The Dow Jones Industrial Average dropped 446 points, or 0.97%, to 45,526 on Friday, leading US benchmarks lower as traders turned defensive following a strong rally earlier in the week. The move marked the sharpest single-day loss for the index in nearly a month and reflected a broad wave of profit-taking across cyclical and industrial sectors.
Wall Street Pulls Back From Highs
The steep decline of the index came as traders reassessed recent gains that had lifted the index above 47,000 earlier in the week. The pullback was driven by renewed caution over global growth risks, falling oil prices, and ongoing US-China trade tensions that have rattled investor confidence.
Amid the chaos of erratic US tariff announcements, Chinese exporters making everything from kitchen appliances to Halloween decorations have responded by selling more goods to buyers in Europe, Latin America, the Middle East and Africa https://t.co/ushB6lTyGM
Futures tied to the S&P 500 fell 1.4%, while Nasdaq futures were down 1.3%, pointing to a wider tech-led retreat.
Market participants cited thin liquidity and fading momentum as reasons for the correction, noting that traders had started to lock in profits ahead of key earnings releases next week.
Technical Analysis: DJ30
The Dow Jones Industrial Average (DJ30) fell sharply to 45,526.22, down 0.97%, as investors rotated out of equities following renewed concerns over corporate earnings and the potential for prolonged monetary tightening. The index is pulling back from its recent peak near 47,090, suggesting that the multi-month rally may be losing steam amid shifting risk sentiment.
From a technical perspective, the Dow is testing short-term support after breaking below its 5- and 10-day moving averages, a sign that momentum has weakened.
The next key support lies around 45,000, followed by the 44,200 zone; a previous consolidation area from mid-September. On the upside, resistance remains between 46,200 to 47,000, where sellers re-entered the market.
The MACD indicator reflects this cooling trend: the histogram has flipped into negative territory, and the MACD line has crossed below the signal line, confirming the loss of upward momentum.
The slope of the moving averages suggests that if price fails to recover above 46,000 soon, a deeper correction could unfold.
Market Outlook
The Dow remains in an uptrend on the medium-term charts, but near-term sentiment appears fragile as traders weigh the effects of weaker commodities, slowing global growth, and expectations of additional Federal Reserve rate cuts later this month. While the recent pullback looks corrective rather than structural, volatility may persist until earnings season provides stronger direction.
Please note that the dividends of the following products will be adjusted accordingly. Index dividends will be executed separately through a balance statement directly to your trading account, and the comment will be in the following format “Div & Product Name & Net Volume”.
Please refer to the table below for more details:
The above data is for reference only, please refer to the MT4/MT5 software for specific data.
If you’d like more information, please don’t hesitate to contact info@vtmarkets.com.
To provide a favorable trading environment to our clients, VT Markets will modify the trading setting of all Shares products. Please refer to the following details:
1. All US Shares products leverage will be adjusted to 20:1.
2. MT5 All Shares products dynamic leverage: New positions opened within 30 minutes before market closing and after market opening will start with a leverage of 5:1. After the mentioned period, the leverage will be resumed to original leverage and will not be adjusted back to 5:1.
The above data is for reference only, please refer to the MT4/MT5 software for specific data.
Friendly reminders:
1. All specifications for Shares CFD stay the same except leverage during the mentioned period.
2. The margin requirement of the trade may be affected by this adjustment. Please make sure the funds in your account are sufficient to hold the position before this adjustment.
If you’d like more information, please don’t hesitate to contact info@vtmarkets.com.
Please note that the dividends of the following products will be adjusted accordingly. Index dividends will be executed separately through a balance statement directly to your trading account, and the comment will be in the following format “Div & Product Name & Net Volume”.
Please refer to the table below for more details:
The above data is for reference only, please refer to the MT4/MT5 software for specific data.
If you’d like more information, please don’t hesitate to contact info@vtmarkets.com.
Fiat currency is the foundation of modern economies, representing money issued by governments that is not backed by a physical commodity but holds value through public trust and legal authority. It affects everything from inflation and interest rates to international trade and forex markets. You’ll learn more about what fiat currency means, how it works, and why it remains central to today’s financial system in this article.
What Is Fiat Currency?
Fiat currency, also known as fiat money, refers to money that has value because a government declares it legal tender and people trust its worth. The term fiat comes from the Latin word meaning “let it be done.” Unlike commodity money, which is backed by a physical asset such as gold or silver, fiat currency holds value through collective confidence in the stability and credibility of the issuing government and its central bank.
Examples of fiat currencies include the US dollar (USD), euro (EUR), British pound (GBP), and Japanese yen (JPY)—all widely used in global trade, investment, and daily transactions. Essentially, fiat money’s value is built on trust: as long as people believe the government will preserve its purchasing power, the currency remains accepted and stable.
How Does Fiat Currency Work?
Fiat currency works through a framework of government regulation, central bank management, and public confidence. Unlike gold or silver, which have intrinsic value, the worth of fiat money depends on the economic stability and credibility of the issuing country.
Central banks—such as the US Federal Reserve, European Central Bank (ECB), or Bank of England—are responsible for controlling the money supply, interest rates, and inflation levels. They adjust these tools to promote sustainable economic growth and maintain price stability. For example, when inflation rises, a central bank may increase interest rates to reduce borrowing and slow down spending. Conversely, during a slowdown, it may cut rates or inject liquidity to stimulate demand.
Example: The US Federal Reserve and the European Central Bank regularly adjust interest rates to manage inflation. In 2024, the Federal Reserve maintained rates between 5.25% and 5.50% to counter inflationary pressures, while the European Central Bank kept its key rate at 4.5% to stabilise prices.
History and Evolution of Fiat Currency
The origins of fiat currency can be traced back to China’s Tang and Song dynasties, when merchants began using flying cash and later government-issued paper money as early forms of state-backed currency. For centuries afterward, most nations relied on the gold standard, where money was directly tied to gold or silver reserves.
Modern fiat systems emerged in 1971, when US President Richard Nixon ended the dollar’s link to gold, allowing currencies to float freely. Since then, nearly all countries have adopted fiat money, with the US dollar, euro, and yen among the most dominant currencies today. As of 2024, the US dollar represents about 59% of global foreign exchange reserves, according to the IMF.
Fiat currency offers several key advantages that make it the backbone of modern economies:
Monetary flexibility: Governments can adjust the money supply to manage inflation and stimulate growth when needed.
Economic stability: Central banks can influence interest rates to support employment and control price levels.
Crisis response: Fiat systems allow rapid implementation of fiscal stimulus during economic downturns.
Efficient transactions: Paper and digital forms make payments fast, scalable, and convenient for global trade.
Example: During the COVID-19 pandemic, global stimulus programs made possible by fiat systems supported economic recovery, leading to a 3.1% rebound in global GDP in 2023, according to the World Bank.
Disadvantages of Fiat Currency
While fiat currency provides flexibility and convenience, it also comes with several drawbacks:
Inflation risk: Excessive money printing can erode purchasing power and lead to inflation.
Dependence on trust: Its value relies entirely on public confidence in the government and central bank.
Potential for mismanagement: Poor fiscal or monetary policies can devalue a currency or trigger crises.
Vulnerability to hyperinflation: In extreme cases, uncontrolled money supply growth can destroy a currency’s value.
Example: Argentina recorded 117.8% annual inflation in 2024, down from 211.4% in 2023, while Venezuela reported 48% year over year in 2024. According to IMF estimates, global inflation eased from 6.9% in 2023 and continued trending lower into 2024 and 2025.
Fiat Currency vs Commodity Money
To better understand what fiat currency means, it helps to compare it with commodity money, which derives value from the physical material it’s made of. The key differences are summarised below:
Aspect
Fiat Currency
Commodity Money
Backing
Government decree
Physical commodity (e.g., gold, silver)
Value Source
Public trust and policy
Intrinsic commodity value
Flexibility
High
Low
Example
USD, EUR, JPY
Gold coins, silver bars
Under the Gold Standard, the US dollar was pegged to gold until 1971. Today’s fiat currencies provide greater flexibility, allowing central banks to pursue full employment and price stability rather than fixed convertibility.
Fiat Currency vs Cryptocurrency
As digital assets gain popularity, many people compare fiat currency with cryptocurrency to understand how they differ in value, structure, and stability. The following table highlights their main distinctions:
Feature
Fiat Currency
Cryptocurrency
Control
Centralised (Government/Central Bank)
Decentralised (Blockchain)
Form
Physical and digital
Digital only
Value Basis
Legal authority and trust
Algorithmic scarcity and demand
Stability
Generally stable
Highly volatile
Cryptocurrencies such as Bitcoin and Ethereum are often viewed as alternatives to fiat money, but their volatility remains a major challenge. For example, Bitcoin’s price fluctuated between USD 25,000 and 70,000 in 2024, while fiat currencies like the US dollar maintained relatively stable purchasing power. Meanwhile, more than 130 countries are exploring or testing central bank digital currencies (CBDCs), showing how digital innovation is reshaping the future of fiat systems.
Why Is Fiat Currency Valuable?
The value of fiat currency, or fiat money, comes from public trust, government authority, and the overall strength of a nation’s economy. Unlike gold or other tangible assets, fiat money has no intrinsic value — it is valuable because people and institutions believe others will accept it in exchange for goods, services, or debt settlement.
Fiat currencies retain their value as long as the issuing government can maintain price stability, control inflation, and uphold confidence in its financial system. For example, the Swiss franc (CHF) and Singapore dollar (SGD) are considered among the world’s most stable currencies, supported by low inflation, disciplined fiscal policies, and resilient economies.
However, when trust weakens — such as during political instability, fiscal mismanagement, or excessive money printing — a fiat currency’s value can decline rapidly. Historical cases like Zimbabwe and Venezuela illustrate how hyperinflation can erode public confidence, rendering money nearly worthless.
Fiat currency is evolving with the rise of digital payments, mobile banking, and central bank digital currencies. Cash usage is declining globally, replaced by electronic and contactless payments.
Governments are also exploring Central Bank Digital Currencies (CBDCs) — digital versions of fiat money designed to make transactions faster and more secure. As of 2025, over 130 countries are researching or testing CBDCs, according to the Atlantic Council.
With digital payments projected to reach USD 11.5 trillion globally by 2025, fiat money is set to remain dominant but in increasingly digital forms that blend traditional trust with new technology.
In Summary
Fiat currency remains the backbone of the global economy. It derives its value from public trust and government authority, supporting flexible monetary control, economic stability, and efficient trade. Although it faces risks such as inflation and policy mismanagement, its adaptability ensures its continued relevance in modern finance. As digital payments and Central Bank Digital Currencies (CBDCs) expand, fiat money will remain essential—evolving into more digital, interconnected, and technology-driven forms while maintaining its central role in the world’s financial system.
Start trading today with VT Markets and experience a seamless forex environment built for all types of traders.
Frequently Asked Questions (FAQs)
1. What is fiat currency?
Fiat currency refers to government-issued money not backed by a physical commodity but by public trust and state authority.
2. What gives fiat currency its value?
Its value is based on the issuing government’s stability, monetary policy, and the public’s confidence in its ability to maintain purchasing power.
3. What are examples of fiat currencies?
The most traded fiat currencies include the US dollar, euro, Japanese yen, and British pound.
4. What is the difference between fiat money and commodity money?
Commodity money has intrinsic value based on the material it’s made of (like gold or silver), while fiat money has value through government decree and public trust.
5. How is fiat currency different from cryptocurrency?
Fiat currencies are centrally issued and regulated, while cryptocurrencies are decentralised and operate on blockchain networks.
6. Can fiat currency lose its value?
Yes. Poor economic management, excessive money printing, or loss of public confidence can lead to devaluation or hyperinflation.
7. Is fiat currency used in forex trading?
Yes. Forex trading involves exchanging one fiat currency for another, such as EUR/USD or USD/JPY, based on exchange rate fluctuations.
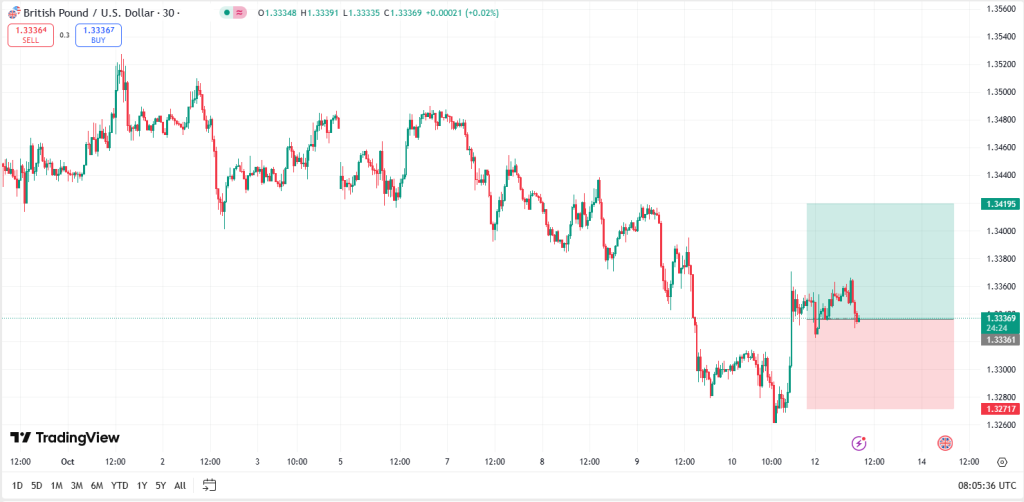
The British pound (GBP/USD) opens the week trading near 1.3400 to 1.3440, caught in a tight range as traders digest a wave of disappointing UK economic data and brace for global macro headwinds. With the pair trading below key resistance at 1.3470 to 1.3500 and under pressure from multiple short-term moving averages, the path forward hinges on both domestic fundamentals and broader risk sentiment.
UK economic weakness fuels BoE rate cut speculation
Recent labor market data has painted a mixed but increasingly fragile picture of the UK economy. The unemployment rate rose to 4.8% in August, its highest since May 2021, while wage growth slowed to 4.4%, missing expectations. The number of payrolled employees also declined, signaling that hiring momentum is fading. These developments have intensified market speculation that the Bank of England may consider rate cuts in early 2026, especially as inflation remains sticky but no longer accelerating.
Globally, the U.S. dollar remains firm as traders await further clarity from the Federal Reserve. While recent U.S. business sentiment data suggests a potential slowdown, Fed officials have maintained a cautious tone, keeping rate cut expectations in check. Meanwhile, geopolitical tensions and trade policy shifts, particularly the renewed U.S.–China tariff standoff, continue to influence risk appetite, indirectly impacting GBP/USD flows.
Technical analysis: GBP faces key resistance
GBP/USD remains capped below the 1.3470 to 1.3500 resistance zone. A decisive break above 1.3535 would signal a bullish reversal and open the door to 1.3550 and 1.3600. On the downside, a break below 1.3322 could resume the broader downtrend, targeting 1.3300 and potentially 1.3140 if momentum accelerates.
Resistance: 1.3470, 1.3500, 1.3550, 1.3600
Support: 1.3410, 1.3330, 1.3300, 1.3140
Bullish setup: Long entries on breakout above 1.3470–1.3500 with confirmation.
Bearish setup: Short positions on rejection from resistance or break below 1.3322.
Range play: Buy near 1.3330, sell near 1.3470 with tight stops until breakout confirms direction.
What to watch this week
With GBP/USD hovering near mid-range levels, traders should monitor upcoming UK inflation data, U.S. retail sales, and central bank commentary for directional cues. Until a breakout occurs, the pair is likely to remain range-bound, with macro headlines driving short-term volatility.
Please note that the dividends of the following products will be adjusted accordingly. Index dividends will be executed separately through a balance statement directly to your trading account, and the comment will be in the following format “Div & Product Name & Net Volume”.
Please refer to the table below for more details:
The above data is for reference only, please refer to the MT4/MT5 software for specific data.
If you’d like more information, please don’t hesitate to contact info@vtmarkets.com.
The valuation debate has returned with force. The S&P 500 and Nasdaq have climbed sharply this year, with tech and AI names driving much of the gains. Some analysts warn these levels echo past bubbles as one red flag lies in market breadth, that is, only a few names carry the broader rally.
The Current Market Structure: Narrow and Top-Heavy
When indices advance while many constituents lag, breadth suffers. Goldman Sachs executives argue the rally still rests on earnings and growth expectations rather than pure speculation. Jamie Dimon of JPMorgan also voiced the concern: Projections of a material correction within 6 to 24 months have been floated. Where many see upside, some caution that the downside risk is underpriced.
WATCH: Earnings season starts next week, with the S&P 500 trading at about 23 times forward earnings and Jamie Dimon and the IMF have warned of a possible bubble, as Elena Casas reports https://t.co/pW77nkwkcnpic.twitter.com/4EOPh9hLbB
Federal Reserve and central bank speeches loom as catalysts, where a dovish tone might support risk assets, while hawkish surprises could crush momentum.
But in recent sessions, tariff talk between the U.S. and China has rattled sentiment. Threats of 100% tariffs and export restrictions triggered the S&P to drop 2.7%, Nasdaq down 3.6%, and Dow off nearly 1.9%. That reversal shows how quickly sentiment can shift. Escalating rhetoric with China raises the risk of headwinds just when the valuation stretch is already high. Markets have shown sensitivity to policy noise.
Upcoming Economic Events
Date
Event
Forecast
Previous
Analyst Remarks
15 Oct
Fed Chair Powell speaks
—
—
Watch for guidance on interest-rate management.
16 Oct
PPI m/m
0.30%
-0.10%
Inflation pulse for the dollar.
16 Oct
Retail Sales m/m
0.40%
0.60%
Growth vs inflation mix; one can offset the other. Refer to structure.
Key Movements of the Week
Another is stretched technicals, whereby momentum indicators at extremes across multiple markets hint at vulnerability. The upcoming earnings season may deliver the first major stress test. If guidance disappoints or margin pressure emerges, the narrative could tilt.
US Dollar Index (USDX)
The dollar retreated from 98.90–99.00, matching the monitored resistance zone from last week’s report.
Support now rests near 98.20, with the next downside target at 97.90 if momentum continues lower.
Bias stays bearish below 98.90; traders should watch for any consolidation between 98.20–98.70 before re-entry.
S&P 500 (SP500)
The index collapsed from the 6,750 monitored resistance, plunging toward 6,510 on heavy risk-off flows.
Momentum stays bearish while below 6,600–6,620; next downside zones sit near 6,440 and 6,395, the latter matching your monitored area.
Short-term traders may seek relief rallies into 6,600 to fade; only a clean break above 6,660 would ease pressure.
Gold (XAUUSD)
Price paused around 4,010 after a steep run, consolidating above 3,985–3,995 on H4.
Bias stays upward while above 3,980; a push through 4,045 would refocus 4,080 then 4,100.
Tactics: keep size modest into resistance, buy dips 3,990–4,010 with tight risk; fade only on a clean close back below 3,980.
Bitcoin (BTCUSD)
Bitcoin fell sharply from 122,700, hitting a low near 109,600 before stabilising around 111 200.
Short-term structure favours a bounce if 108,600 – 107,240 holds as support, matching your monitored zone.
Bias stays cautious: expect intraday rebounds toward 113,000 – 115,000, but sustained recovery depends on broader risk sentiment.
EURUSD
EURUSD steadied near 1.1620, rebounding from the 1.1580–1.1600 monitored support area.
Short-term bias turns mildly bullish toward 1.1660; a clean break above this level could extend to 1.1700.
Watch for consolidation between 1.1580–1.1660; a drop below 1.1580 would reopen the path to 1.1520.
USOil
Oil extended losses, breaking below the 60.55 monitored level and now testing 58.35 support.
If consolidation fails above 58.00, price could slide toward the next key area near 53.00, as noted in your report.
Short-term rebounds may face resistance around 59.80–60.50; trend bias stays bearish while below 60.55.
Key Takeaway for the Week
Cautiously, the path higher remains possible, but downside risk is rising. Traders should lean into hedging, favour relative strength strategies, and avoid overcommitting to momentum names at extremes. Hedged positions, selective exposure, and respect for technicals will matter more than chasing momentum.