Back

Forex market analysis: 7 April 2025

The US stock market is under intense pressure as investor confidence takes a hit from worsening global trade tensions and fears of an economic slowdown. Uncertainty around future policy moves and a sharp shift in sentiment have triggered a broad sell-off, with traders pulling back from riskier assets and turning to safer options. This environment of heightened volatility is challenging even experienced market participants, as the outlook grows increasingly fragile.

US markets tumble amid rising volatility and trade concerns

The US stock market is experiencing its most turbulent week in recent years, as mounting trade disputes and global economic uncertainty prompt investors to abandon equities in favour of safer assets.

As of 9:42 AM GMT, S&P 500 E-mini futures dropped 159 points (-3.11%), extending a two-day plunge that has shaved 10.5% off the index, wiping nearly USD 5 trillion in market value.

The benchmark has now declined over 20% from its record highs, confirming its entry into bear market territory—the first since the COVID-19 crash in March 2020.

Tensions escalated after President Donald Trump reaffirmed his stance on maintaining tariffs and delaying negotiations with China, insisting that trade imbalances must be addressed first.

Markets have taken this as a sign that the trade war could be prolonged, fuelling fears of deeper economic disruption.

Nasdaq 100 futures slumped 598.5 points (-3.41%), and Dow futures fell 1,178 points (-3.06%), signalling broad-based selling.

The Nasdaq Composite has officially entered a bear market, weighed down by a steep decline in tech stocks, while the Dow Jones Industrial Average has retreated over 10% from recent peaks.

Rush to safe-haven assets intensifies

Investors are flocking to safe-haven instruments as risk appetite deteriorates.

The 10-year US Treasury yield has fallen to 3.953%, slipping beneath the critical 4% psychological threshold, as demand for government bonds accelerates. This sharp drop underscores growing recession fears.

Market participants now estimate a 54% chance of a fifth Federal Reserve rate cut this year, suggesting that further monetary easing could be on the cards to cushion the impact of trade headwinds.

The CBOE Volatility Index (VIX)—often dubbed the Wall Street fear gauge—soared 7.57 points to 52.88, its highest reading since the early COVID-19 shock. This heightened volatility reflects deepening market unease and ongoing uncertainty.

S&P 500 technical outlook: Bearish pressure remains

Short-term technical indicators paint a grim picture for the S&P 500 (SP500).

A 15-minute candlestick chart shows the index sliding from 4,964.07 to a low of 4,802.15, before recovering slightly to close at 4,886.02.

Bearish alignment across the 5, 10, and 30-period moving averages points to persistent selling momentum.

From sell-off to setup—SP500 claws back after touching fresh lows, as seen on the VT Markets app.

The MACD (12,26,9) signals a potential shift, with the histogram turning green after extended lows—an early indication of possible technical relief. However, there’s no definitive sign of a trend reversal.

The index may be poised for a short-term rebound, but downside risk remains elevated. A decisive move below the 4,800 support level could pave the way for a rapid test of February’s lows.

Outlook: high volatility and fragile sentiment

With uncertainty high and Washington maintaining a tough trade stance, markets are likely to remain volatile.

While the prospect of further rate cuts could provide temporary support, investor sentiment remains on edge.

Any rebound in equities might turn out to be a bear market trap if macroeconomic data—such as Thursday’s consumer price report—fails to signal a meaningful shift in inflation dynamics.

In the near term, a defensive investment approach is advisable. Expect continued flows into bonds and traditional safe-haven sectors, as equities may remain under pressure until there’s clearer policy guidance or economic improvement.

Click here to open account and start trading.

Dividend Adjustment Notice – Apr 07 ,2025

Dear Client,

Please note that the dividends of the following products will be adjusted accordingly. Index dividends will be executed separately through a balance statement directly to your trading account, and the comment will be in the following format “Div & Product Name & Net Volume”.

Please refer to the table below for more details:

Dividend Adjustment Notice

The above data is for reference only, please refer to the MT4/MT5 software for specific data.

If you’d like more information, please don’t hesitate to contact info@vtmarkets.com.

Week ahead: Trump tariffs to stir market turbulence

As we approach the week of 7 to 11 April 2025, several key developments are poised to influence global financial markets. Market participants are closely monitoring President Trump’s tariff policies and their potential economic implications, as well as upcoming economic data and earnings reports. These events could significantly shape investor sentiment and market trends in the short term.

KEY INDICATORS

Trump’s tariff policy and market impact

  • 2 April: President Trump declared a national emergency over the US trade deficit, invoking the IEEPA and introducing a two-tier tariff system.
  • 5 April: A 10% baseline tariff will take effect on all imports at 12:01 a.m. EDT.
  • 9 April: Additional “reciprocal” tariffs will target countries with large trade surpluses with the US.
  • Global markets reacted negatively, with sharp declines in Asian equities reflecting investor concerns over trade disruptions.
  • Economists warned that tariffs could push inflation above 4%, straining household budgets and dampening consumer spending.
  • The policy risks triggering a global trade conflict, with affected countries considering retaliatory measures that may destabilise international trade relations.

Key US economic data releases

  • 10 April: Consumer Price Index (CPI) for March will track changes in consumer-level inflation.
  • 11 April: Producer Price Index (PPI) for March will reflect trends in wholesale pricing.
  • 11 April: Preliminary Consumer Sentiment Index for April will gauge public confidence in the economic outlook.

Earnings season and Fed update

  • 7 April: Dave & Buster’s (PLAY) is expected to report earnings per share (EPS) of USD 0.66 on USD 547.99 million in revenue, marking an 8.5% year-on-year decline.
  • 7 April: Levi Strauss (LEVI) is projected to post EPS of USD 0.28 on USD 1.54 billion in revenue, reflecting a 1.1% year-on-year decrease.
  • 7 April: Greenbrier Companies (GBX) is scheduled to announce its earnings; details are yet to be disclosed.
  • 9 April: The Federal Reserve will release the minutes from its March FOMC meeting, providing insight into its economic outlook and potential policy direction.
  • 10 April: JPMorgan Chase (JPM) is expected to report continued growth, following a 21% increase in adjusted profit and an 11% rise in revenue in the previous quarter.
  • 10 April: Wells Fargo (WFC) is anticipated to provide an update on its financial performance amid evolving economic conditions.

MARKET MOVERS

XAU/USD

  • The primary trend remains bullish.
  • We anticipate a temporary pullback.
  • Any setbacks should be contained around yesterday’s low.
  • The preferred strategy is to buy on dips.
  • Key support is found at 3075.0.

Trade opportunity: Target 1: 3135 // Target 2: 3145.

GER40 DAX

  • There is no clear signal that the downward trend is nearing its end.
  • While our overall outlook remains bearish, a corrective bounce is possible without altering the prevailing downtrend.
  • We anticipate a higher correction.
  • Entering a sell position at current levels presents a poor risk/reward setup.
  • A break below 21,700 will confirm the continuation of bearish momentum.
  • The measured move target is 21,500.

Trade opportunity: Target 1: 21,600 // Target 2: 21,500.

EUR/USD

  • The pair continued its upward momentum from 1.0778, recording net daily gains yesterday.
  • It is currently trading at its highest level in the past six months.
  • A key Fibonacci confluence zone is found at 1.1105.
  • Our medium-term outlook remains bearish below 1.1014, with a target towards 1.0700.
  • While there is potential for slight buying at the open, any gains are expected to be capped.

Trade opportunity: Target 1: 1.0837 // Target 2: 1.0700.

NEWS HEADLINES

Market reaction to tariff announcements

  • The US Dollar Index fell by 1.69%, closing at 101.94, reflecting investor concerns over the tariff announcement.
  • The 10-year US Treasury yield dropped below 4% for the first time since October, closing at 4.0620%, while the 2-year yield dropped to 3.7490%.
  • Spot gold fluctuated wildly with a daily range exceeding USD 110, closing down 0.76% at USD 3114.28 per ounce.
  • Spot silver closed down 6.11%, at USD 31.82 per ounce, amid market volatility.
  • WTI crude oil fell by 5.8%, closing at USD 66.56 per barrel, and Brent crude dropped 4.79%, closing at USD 69.81 per barrel due to the tariffs and OPEC+ production increases.

Stock market performance: US & global declines

  • The Nasdaq dropped 5.97%, its largest single-day loss since March 2020, while the S&P 500 fell by 4.84%, and the Dow Jones dropped 3.98%.
  • The Philadelphia Semiconductor Index fell by 9.88%, and the KBW Bank Index dropped by 9.86%, its biggest decline since the regional banking crisis.
  • Major tech stocks were all down: Apple fell over 9%, Amazon and Meta lost over 8%, Nvidia dropped over 7%, and Tesla fell over 5%.
  • European stocks saw broad declines: the DAX30 dropped 3.08%, the FTSE 100 fell 1.55%, and the Euro Stoxx 50 dropped 3.6%.
  • Hong Kong stocks opened sharply lower with the Hang Seng Index dropping 1.52% and the Tech Index falling 2.09%, although both indices recovered slightly towards the close.

Chinese A-shares market & broader economic impact

  • The Shanghai Composite fell 0.24%, the Shenzhen Component dropped 1.4%, and the ChiNext Index declined 1.86%.
  • Agricultural and logistics stocks showed strength, while automotive and industrial equipment sectors underperformed, reflecting global trade uncertainties.

Click here to open account and start trading.

What Is Scalping in Trading: A Comprehensive Guide 

Understand What Scalping Is in Trading

Scalping is a popular trading strategy that focuses on making quick profits from small price changes. Whether you’re new to trading or an experienced trader, understanding scalping and how to implement it effectively is essential if you want to incorporate this strategy into your trading plan. In this article, we’ll break down what scalping is, how it works, its advantages and disadvantages, and how to get started with scalping trading.

What Is Scalping in Trading?

Scalping is a trading strategy that involves making many small trades to profit from minor price movements throughout the day. The goal of scalping trading is to capture small profits quickly, typically within minutes, by entering and exiting positions frequently. Scalpers often trade in highly liquid markets like forex pairs (EUR/USD, GBP/USD), stocks, or commodities like WTI and Brent crude, where price fluctuations occur in small increments.

In essence, what is scalping in trading boils down to taking advantage of short-term price movements that happen during the day, allowing traders to accumulate small profits that can add up over time.

How Scalping Works?

Scalping works by identifying small price movements in highly liquid assets. Traders using this strategy look for opportunities to buy low and sell high (or sell high and buy low) in a matter of seconds or minutes. The key is to execute trades quickly and frequently while minimizing the risk of large losses.

Scalp trading relies on technical analysis and indicators like moving averages, Bollinger Bands, and RSI to spot trends and identify entry/exit points. Scalpers typically use high leverage to maximize their profits, though it’s important to remember that leverage can also amplify losses.

Advantages & Disadvantages of Scalping

Scalping offers quick trading opportunities with the potential for rapid profits, but it also comes with challenges such as high stress and transaction costs. Below, we will explore the advantages and disadvantages of scalping in more detail.

The Advantages of Scalping

Scalping trading offers several benefits, especially for those who prefer to stay actively involved in the markets. Here are some advantages:

Quick Profit Potential: Because scalpers aim for small price movements, they can rack up profits quickly. Even though individual profits per trade are modest, a series of successful trades can lead to significant overall gains.

Frequent Trading Opportunities: Scalpers often encounter numerous opportunities to enter and exit the market throughout the day, making it ideal for those who enjoy active market participation.

Less Exposure to Market Volatility: Scalpers generally hold positions for short periods, minimizing their exposure to overnight market risks and broader market volatility. They also avoid big price swings that could affect longer-term traders.

Liquidity: Scalpers focus on highly liquid assets like major currency pairs, which offer tighter spreads and are easier to trade in and out of quickly.

The Disadvantages of Scalping

While there are clear benefits, scalping also comes with its challenges:

High Stress and Intense Focus: Scalping requires undivided attention and quick decision-making. The speed at which trades need to be executed can be stressful and mentally exhausting.

Transaction Costs: Scalpers tend to execute a large number of trades, and many brokers charge a commission or spread for each transaction. These costs can eat into profits, especially if the strategy isn’t executed successfully.

Risk of Frequent Losses: Scalpers may experience multiple small losses throughout the day, and the pressure to recover those losses can be overwhelming. Effective risk management strategies are essential to avoid significant drawdowns.

Requires Advanced Trading Knowledge: Successful scalping involves a solid understanding of market mechanics and a well-tested strategy. It’s not recommended for beginners, as it can be difficult to master.

How to Get Started with Scalping Trading

If you’re interested in scalp trading, here’s how you can get started:

Step 1: Choose the Right Market

To succeed in scalping, it’s important to trade in highly liquid markets. Popular markets for scalping include forex pairs like EUR/USD and GBP/USD, and commodities such as wti crude and Brent crude oil. These markets experience frequent price movements and offer ample opportunities for small, quick trades.

Step 2: Select the Right Time Frame

For scalping trading, the most common timeframes are 1-minute (M1) and 5-minute (M5) charts, which help identify quick price fluctuations for executing trades.

Step 3: Use the Right Tools

To implement scalping effectively, use advanced charting tools and platforms that offer fast execution speeds. Additionally, leverage technical indicators like Moving Averages, RSI, and Bollinger Bands to help identify trends and entry/exit points.

Step 4: Implement Risk Management Strategies

Risk management is crucial when scalping. Set a tight stop-loss to limit losses and define a take-profit level for small, consistent gains. Additionally, use smaller position sizes to manage risk effectively while scalping.

Step 5: Monitor the Markets and Execute Trades

Stay alert and look for small price movements to capitalize on. When you spot a potential opportunity, execute the trade quickly. Scalping is about speed, so the ability to make quick decisions is key.

Step 6: Practice with Demo Account

Before trading with real money, practice scalp trading on a demo account. This will help you get familiar with the process, test your strategy, and refine your skills without the risk.

Step 7: Stay Informed and Disciplined

Scalping requires focus and discipline. Keep up with market news and price trends, and stay disciplined by sticking to your trading plan. Don’t chase large profits—focus on consistent small wins.

Case Study: Scalping in the Forex Market

Let’s take a look at a simple example of scalping in the forex market:

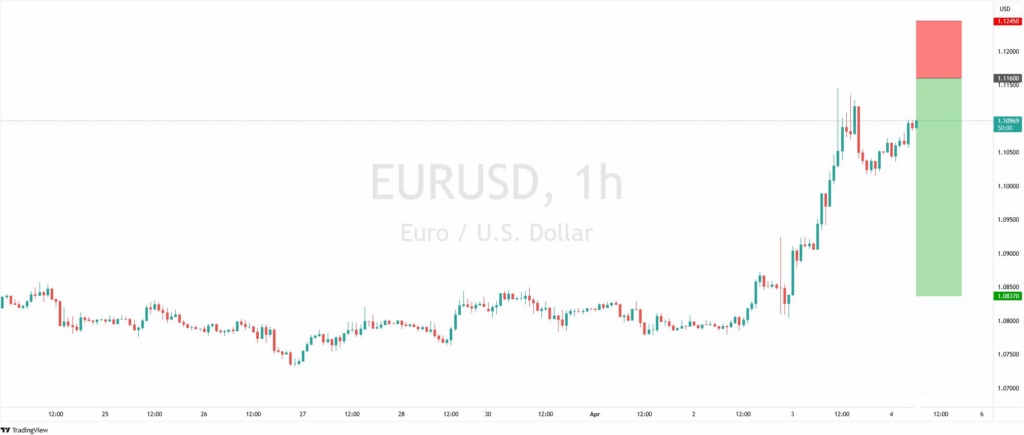
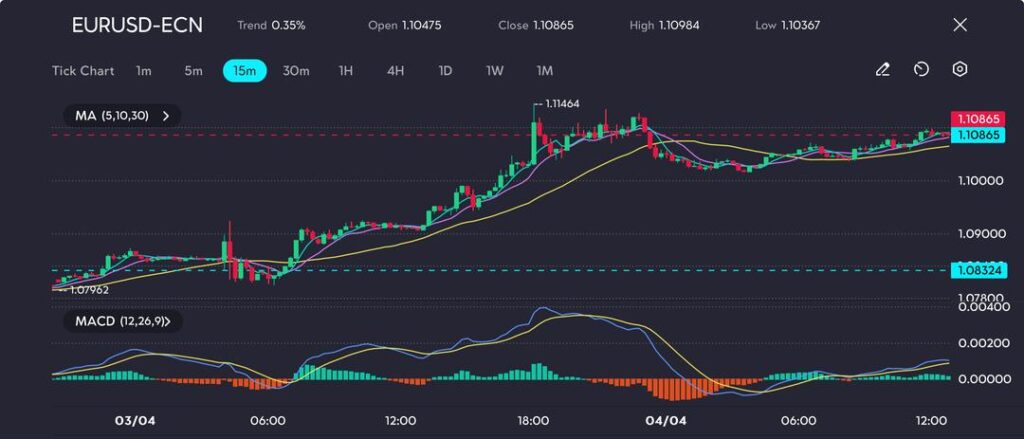
Imagine you are trading the EUR/USD currency pair. You decide to scalp using a 1-minute chart and use a simple strategy of buying when the price crosses above a 5-period moving average and selling when it crosses below. Throughout the day, you make dozens of these small trades, each aiming for a 5-pip gain. Even though each trade might only make a small profit, the cumulative result of successful trades leads to a consistent profit.

For example, you make 20 successful trades in one day, each earning 5 pips. If each pip is worth $10, that would lead to a total profit of $100 for the day. This may seem small per trade, but it adds up over time with many successful trades.

Discover the top 10 strongest currencies in the world

Conclusion

Scalping is an effective strategy for traders who thrive in fast-paced environments and are willing to commit the time and effort required to monitor the markets consistently. However, it’s not for everyone. Scalp trading can be profitable when executed correctly, but it also comes with risks that should be carefully managed.

If you’re considering trying out scalping, it’s important to use the right tools, practice with a demo account, and assess whether the strategy suits your trading style. Whether you’re new to the world of trading or a seasoned professional, scalping trading can offer unique opportunities to profit from short-term market movements.

Scalp in Different Asset Markets Today with VT Markets

At VT Markets, we provide a wide range of assets for scalping, including forex pairs, commodities, and indices. With our advanced trading tools, low spreads, and fast execution times, scalp trading is made even easier for traders. Whether you’re trading WTI crude or currency pairs like EUR/USD, VT Markets offers an ideal platform to implement your scalping strategy effectively.

Additionally, you can take full advantage of MetaTrader 4 and MetaTrader 5, two of the most popular and reliable trading platforms available today. Both platforms offer powerful charting tools, automated trading features, and rapid execution speeds, making them perfect for executing quick trades in a fast-paced scalping environment.

Frequently Asked Questions (FAQs)

1. What is scalping in trading? 

Scalping is a strategy where traders make multiple small trades to profit from small price movements, typically holding positions for a few seconds to minutes.

2. How does scalping trading work? 

Scalpers buy and sell quickly, capitalizing on minor price changes. This involves analyzing the market for small fluctuations and executing many trades throughout the day.

3. How do I choose the right asset for scalping?

Choose highly liquid assets with low spreads, such as popular forex pairs (EUR/USD, GBP/USD) and commodities like WTI and Brent crude oil. Aim for assets with moderate volatility and low transaction costs.

4. What tools do I need for scalping?

Traders typically use technical indicators such as moving averages, RSI, and Bollinger Bands, as well as fast execution platforms like VT Markets.

5. Is scalping trading profitable?

Scalping can be profitable when executed properly, but it requires discipline, fast decision-making, and effective risk management.

6. What are the risks involved in scalp trading?

Risks include high transaction costs, market slippage, emotional stress, and the potential for overtrading.

7. Can I use scalping for forex?

Absolutely. Scalping is most commonly used in forex trading due to the liquidity and tight spreads offered by major currency pairs.

8. Can I practice scalping with VT Markets? 

Yes, VT Markets provides a robust platform for scalpers with fast execution times, tight spreads, and a variety of assets to choose from.

9. What is the difference between scalping and day trading?

The key difference between scalping and day trading is that scalping involves making many quick trades for small profits within minutes, while day trading involves holding positions for hours, aiming for larger price movements.

Forex market analysis: 4 April 2025

The euro is on the rise as traders turn away from the US dollar, unsettled by growing trade tensions and confusion around US economic policy. With uncertainty in the air, many investors are seeking safer options—and right now, the euro is proving to be one of them.

Euro strengthens amid dollar weakness and global trade tensions

The euro saw a notable rally on Thursday, closing at 1.10865 and recording a 2.4% gain for the week—its most significant weekly rise in over a year.

This surge follows a sharp repricing across global currency markets, as the US dollar comes under pressure due to intensifying trade disputes and a deterioration in trader sentiment.

The catalyst behind this shift was President Donald Trump’s decision to impose tariffs ranging from 24% to 54% on key trade partners, fuelling concerns of an uncoordinated trade war lacking clear objectives.

As investors seek safer alternatives, the euro has emerged as a favoured option, briefly touching 1.10984—its highest level since January.

EUR/USD technical overview

On the 15-minute chart, EUR/USD displays strong bullish momentum, having advanced steadily from the 1.078 region to a peak of 1.11464 before consolidating around the 1.10865 mark.

Euro on the rise—bulls hold ground after a strong breakout, eyeing higher levels, as seen on the VT Markets app.

The pair remains in an upward trend, with prices well above the 5, 10, and 30-period moving averages—all of which are rising and offering dynamic support.

The MACD indicator reinforces the bullish outlook, showing a solid crossover early in the session, followed by positive divergence and a widening histogram.

Although momentum has cooled slightly, the MACD lines are beginning to flatten—suggesting a potential continuation of the uptrend if buying pressure resumes.

US dollar under pressure as Fed faces policy crossroads

There has been a sharp reversal in sentiment towards the dollar, with markets unwinding long positions.

The greenback has fallen 2.7% against the yen and 3% versus the Swiss franc, as investors respond to increasing uncertainty around US economic policy and structural challenges.

Fed funds futures now reflect expectations of nearly 100 basis points in rate cuts by December, indicating market belief that rising unemployment will compel the Federal Reserve to act—even as inflationary pressures rise due to increased import costs.

This presents a significant dilemma: the Fed may be forced to choose between containing inflation or preventing a recession, all while the dollar’s reputation as a safe-haven currency continues to erode.

Outlook: More gains possible, but risks remain

The EUR/USD outlook remains tilted to the upside, particularly if instability in US policymaking persists.

However, heightened volatility is expected around upcoming comments from Fed Chair Jerome Powell, which could signal the central bank’s strategic direction.

If Powell adopts a dovish stance—prioritising growth risks over inflation—the euro may extend its rally. Conversely, a hawkish tone could trigger a retracement toward the 1.1030–1.1000 range.

Traders are also closely monitoring developments in tech stocks, particularly Apple and firms tied to global supply chains, as well as shifts in broader equity flows.

For now, the euro is benefitting from the dollar’s weakness—but its momentum will likely hinge on policy signals from Washington in the days ahead.

Click here to open account and start trading.

Dividend Adjustment Notice – Apr 04 ,2025

Dear Client,

Please note that the dividends of the following products will be adjusted accordingly. Index dividends will be executed separately through a balance statement directly to your trading account, and the comment will be in the following format “Div & Product Name & Net Volume”.

Please refer to the table below for more details:

Dividend Adjustment Notice

The above data is for reference only, please refer to the MT4/MT5 software for specific data.

If you’d like more information, please don’t hesitate to contact info@vtmarkets.com.

How to trade UAE stocks with VT Markets: A beginner’s guide

Ever dreamed of trading in a booming market? The UAE’s thriving economy is your chance!

In March 2025, VT Markets launched 20 new Middle East stock CFDs, letting you tap into this dynamic region. Known for energy, finance, and innovation, the UAE is a global hotspot, making its stocks a smart addition to your portfolio.

This beginner’s guide will show you what these stocks are, why they are worth trading, and how to start with VT Markets. Let’s get started!

What are UAE stock CFDs?

First things first—what exactly are stock CFDs? Stock CFDs, or Contracts for Difference, let you trade on UAE stock price movements without owning the shares. You can profit whether the price rises or falls, as long as you predict correctly.

VT Markets offers these CFDs on the Abu Dhabi Securities Exchange (ADX) with a 5:1 leverage, so your 1 USD can control a 5 USD position.

The minimum trade value is just 1 USD, making it beginner-friendly. For example, if you think ADNOC Distribution’s stock will rise, buy a CFD to profit from the increase—or sell if it drops. It’s a flexible way to trade!

Why trade UAE stocks?

The UAE’s booming economy, driven by oil, tourism, and diversification into tech and healthcare, makes its stocks a promising choice. Global interest in the Middle East is growing, with international investors increasing liquidity and opportunities.

Adding UAE stocks to your portfolio also diversifies your investments, reducing reliance on Western markets and spreading risk.

High-potential sectors include energy (e.g., ADNOC Gas, which thrives when oil prices rise), finance (e.g., ADCB, benefiting from economic stability), and healthcare (e.g., Burjeel Holdings, meeting medical demand).

For example, an oil price surge could boost ADNOC Gas, offering a profitable trade.

Plus, VT Markets provides flexible trading hours: Monday to Friday, 9:00 AM – 1:44 PM (GMT+3), fitting your schedule. UAE stocks are a smart way to grow your portfolio.

Meet the UAE stocks: A snapshot of the companies

Let’s take a closer look at the 20 UAE stocks you can trade with VT Markets. These companies span various sectors, offering something for every trader. Here’s a quick snapshot:

Energy & Oil and Gas

This sector is the UAE’s backbone, and several stocks stand out. ADNOC Distribution is the retail and marketing arm of ADNOC (Abu Dhabi National Oil Company), operating thousands of fuel stations and convenience stores—a stable choice during energy booms.

ADNOC Drilling provides oilfield drilling services, while ADNOC Gas focuses on gas processing and distribution. Borouge, a petrochemicals producer, is a joint venture between ADNOC and Borealis.

Lastly, Dana Gas operates across the Middle East, specialising in natural gas production.

Bank & Financial Services

The UAE’s financial sector is robust, with leading players like ADCB (Abu Dhabi Commercial Bank) and ADIB (Abu Dhabi Islamic Bank) offering banking services.

Alpha Dhabi Holding and Eshraq Investments focus on diversified investments, including healthcare and real estate.

IHC (International Holding Company) is a conglomerate with interests in health and tech, known for its rapid growth.

Multiply Group invests in technology, media, and utilities, making it a tech-savvy option.

Construction & Infrastructure

Aldar Properties is a major real estate developer behind iconic projects like Yas Island, benefiting from the UAE’s tourism push.

NMDC (National Marine Dredging Company) specialises in marine construction, while AD Ports manages logistics and port operations, supporting the UAE’s trade hub status.

Leisure

ADNH (Abu Dhabi National Hotels) operates hotels, catering, and transportation services, thriving on the UAE’s tourism boom.

Americana Restaurants runs fast-food franchises like KFC and Pizza Hut across the region. ESG likely focuses on sustainability, aligning with global trends.

Medical & Sports

Burjeel Holdings is a leading healthcare provider, operating premium hospitals to meet the UAE’s growing medical demand.

Palm Sports specialises in sports training and management, tapping into the region’s focus on fitness and events.

These companies offer a mix of stability and growth, making them ideal for traders looking to explore the UAE market.

How to start trading UAE stocks with VT Markets

Ready to get started? Trading UAE stocks with VT Markets is simple, even if you are new to the game. Here’s a step-by-step guide:

Step 1: Open a live account

Head to VT Markets’ website and sign up for a live account. The process is quick and user-friendly, designed for beginners.

Step 2: Download MetaTrader 5

VT Markets uses MetaTrader 5, a powerful platform for trading these CFDs. Download it to your device, and you are ready to trade.

Step 3: Deposit funds

Add money to your account. The minimum contract size is just 10 USD, so you don’t need a big budget to start. With 5:1 leverage, your 100 USD can control a 500 USD position, amplifying your potential gains (but also your risks, so be cautious).

Step 4: Choose a stock and trade

Pick a stock CFD, like ADNOC Drilling. If you think its price will rise, buy the CFD. If you expect a drop, sell it. For example, if you invest 100 USD in ADNOC Drilling and the stock rises by 5%, you could make a 25 USD profit thanks to leverage.

Conclusion

Ready to diversify your portfolio? The UAE’s thriving stock market is the perfect place to start! VT Markets launched 20 new CFDs, making trading easy with just a 10 USD minimum and the MetaTrader 5 platform.

For success, research the companies—oil prices can lift energy stocks, while tourism boosts real estate. Stay updated with UAE news for market opportunities, and use MetaTrader 5 to spot trends.

Don’t wait—open your live account with VT Markets today, explore the UAE’s exciting stocks, and start your trading journey with confidence!

Forex market analysis: 3 April 2025

Global markets were shaken after a sudden tariff announcement reignited fears of economic uncertainty. Investors reacted swiftly, triggering sharp market movements as concerns over rising costs, disrupted supply chains, and potential retaliation took centre stage. With recession risks back in focus and volatility surging, traders are bracing for what could be a turbulent period ahead.

S&P 500 plunges as tariff announcement sparks market turmoil

The S&P 500 saw a sharp downturn on Wednesday following a surprise announcement from US President Donald Trump regarding extensive tariffs on key global trade partners.

The index tumbled from an intraday peak of 5,733.48 to a low of 5,443.45 before recovering slightly to close at 5,519.13.

Market charts highlight this sudden shift: after a period of relative stability, the index surged early in the session but quickly reversed course after the tariff news.

The MACD (12,26,9) confirmed the bearish momentum, with the indicator crossing below the signal line and the histogram expanding into negative territory, reinforcing the selling pressure.

Global markets react to tariff shock

Trump’s announcement included substantial tariff hikes—34% on Chinese imports, 20% on goods from the European Union, and up to 46% on Vietnamese products, alongside measures targeting Japan and Taiwan.

The news triggered immediate declines in global markets: Asian stocks fell by 3%, European futures dropped 1.7%, and Apple’s stock plummeted 7% in after-hours trading.

These tariffs directly impact the technology sector, particularly in Asia, where many components for US electronics are manufactured. Companies such as Apple and Intel are bracing for higher production costs and shrinking profit margins.

Analysts warn that these measures could increase recession risks, drawing comparisons to the damaging effects of the 1930s Smoot-Hawley Tariff Act.

US consumer prices are projected to rise, with the auto industry facing cost increases of between USD 6,000 and USD 10,000 per vehicle.

Recession concerns grow

The bond market reacted immediately, with Treasury yields hitting multi-month lows as investors sought safe-haven assets.

Fed funds futures now indicate expectations of 80 basis points in interest rate cuts by year-end, even as inflation concerns mount.

The Federal Reserve faces a challenging scenario—balancing inflation risks with the potential for economic slowdown.

While the White House insists that these tariffs are part of a negotiation strategy, uncertainty is already weighing on business confidence.

Many companies are holding off on capital investments until more clarity emerges, while the European Union and other trade partners are expected to introduce retaliatory measures.

Technical analysis

On a 15-minute chart, the S&P 500 exhibited a strong early rally, reaching 5,733.48, supported by short-term moving averages (5,10,30).

Dollar index tanks hard—bearish momentum dominates with signs of a technical bounce brewing, as seen on the VT Markets app.

However, the momentum quickly faded, leading to a sharp drop to 5,443.45. This sell-off was reflected in a steep MACD decline and a bearish crossover.

Following the low, the index stabilised near 5,519.13, showing early signs of consolidation.

The MACD histogram has begun shifting to green, indicating a potential recovery, but downward-tilted moving averages suggest caution in the near term.

Outlook: Volatility ahead

The S&P 500’s dip below 5,500 signals heightened uncertainty and potential volatility in upcoming sessions.

If the index fails to reclaim the 5,600 mark soon, a deeper correction towards 5,400 or lower remains a possibility.

Investors are closely watching for further developments, policy responses, and the broader economic fallout. With market sentiment rattled, this tariff-driven turbulence could be just the beginning.

Click here to open account and start trading.

Dividend Adjustment Notice – Apr 03 ,2025

Dear Client,

Please note that the dividends of the following products will be adjusted accordingly. Index dividends will be executed separately through a balance statement directly to your trading account, and the comment will be in the following format “Div & Product Name & Net Volume”.

Please refer to the table below for more details:

Dividend Adjustment Notice

The above data is for reference only, please refer to the MT4/MT5 software for specific data.

If you’d like more information, please don’t hesitate to contact info@vtmarkets.com.

Notification of Trading Adjustment – Apr 03 ,2025

Dear Client,

The trading hours of some MT4/MT5 products will change due to the upcoming Daylight Saving Time change in the AU. Please refer to the table below outlining the affected instruments:

Notification of Trading Adjustment

The above information is provided for reference only; please refer to the MT4/MT5 software for specific data.

If you’d like more information, please don’t hesitate to contact info@vtmarkets.com.

Back To Top
server

Hello there 👋

How can I help you?

Chat with our team instantly

Live Chat

Start a live conversation through...

  • Telegram
    hold On hold
  • Coming Soon...

Hello there 👋

How can I help you?

telegram

Scan the QR code with your smartphone to start a chat with us, or click here.

Don’t have the Telegram App or Desktop installed? Use Web Telegram instead.

QR code