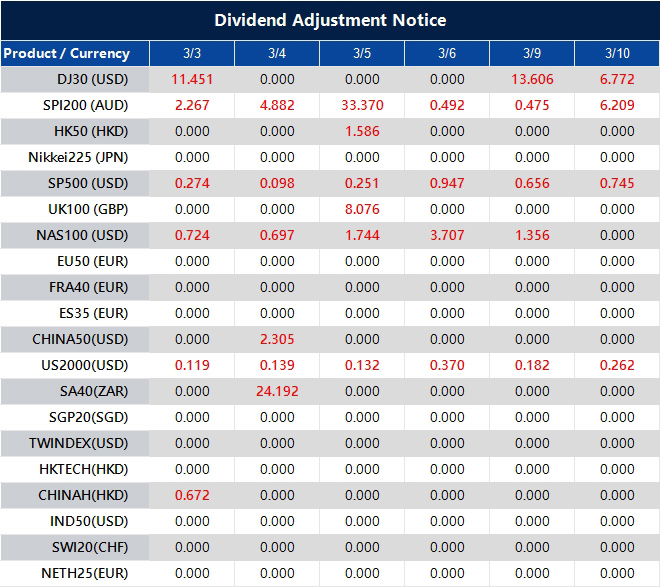
Please note that the dividends of the following products will be adjusted accordingly. Index dividends will be executed separately through a balance statement directly to your trading account, and the comment will be in the following format “Div & Product Name & Net Volume”.
Please refer to the table below for more details:
The above data is for reference only, please refer to the MT4/MT5 software for specific data.
If you’d like more information, please don’t hesitate to contact info@vtmarkets.com.
XAUUSD, USOil, USDX and SP500 enter the week driven by Fed rate cut expectations, with geopolitics adding an inflation shock channel through energy.
Crude oil is holding a massive risk premium at $72–$79/bbl; a breach of $80 could trigger a fast move toward $100 if the Strait of Hormuz remains restricted.
Friday’s Nonfarm Payrolls (NFP) forecast of 58K–60K (down from 130K) creates a dilemma: cooling jobs favour rate cuts, but sticky 0.4% wage growth plus surging oil could force the Fed to stay hawkish.
Gold Above $5,300 Amidst Sticky US Data and Safe Haven Demands
The macro backdrop is simple, but it is not comfortable. Traders want weaker labour demand without a fresh inflation pulse. This week’s releases decide whether Fed rate cut expectations gain conviction or drift back into doubt.
The labour market has already shown signs of cooling at the margin. US job openings fell to a more than five-year low in December, which supports the idea that demand for workers has softened. That puts extra weight on Friday’s payrolls and wages mix.
US job openings unexpectedly fell in December to the lowest level since 2020 and layoffs edged up https://t.co/hq05MuUTxp
Markets also keep one eye on inflation timing. Even when CPI is a week away, traders often position early if the jobs report gives them a directional push.
Why it matters: Fed rate cut expectations set the tone for USDX, and USDX tends to steer XAUUSD and risk appetite.
Oil Jumps Over $80 as Hormuz Blockade Fear Escalates
This is the part of the week when the market can feel jumpy. Oil does not need a confirmed supply hit to move. Traders only need to believe disruption risk has risen, and that belief can keep USOil supported for longer than the headlines feel “new”.
Rising oil prices risk delivering a fresh inflation shock to Japan, complicating Prime Minister Sanae Takaichi’s efforts to ease cost-of-living pressures, according to Monex Group’s Jesper Koll https://t.co/1yZ4fMrtHG
A firmer oil price matters because it leaks into inflation expectations and financial conditions. It can also change how traders price Fed rate cut expectations, even if the labour data softens.
Gold reacts differently. XAUUSD trades as insurance. When uncertainty rises, gold often attracts flow even before the data lands. If the dollar stays contained, that support can persist.
The most immediate impact from the escalating Middle East conflict is through market reaction as investors take flight to safe havens such as the dollar and gold, while stocks slump https://t.co/1wMSxKx47N
XAUUSD bid on geopolitics, with 5455 defining extension risk.
XAUUSD may pause if USDX breaks above 98.651 after wages surprise.
XAUUSD reacts hardest to NFP as Fed rate cut expectations reset into next week.
Oil (USOUSD)
USOUSD holds a risk premium, with 71.181 the breakout level on Iran headlines.
USOUSD volatility stays elevated while traders price disruption risk through the Strait of Hormuz.
USOUSD strength can tighten conditions and complicate Fed rate cut expectations into payrolls.
US Dollar Index (USDX)
USDX rejected 98.10 and now ranges, with 98.50 the next area on a push higher.
USDX above 98.651 invalidates bearish setups and can pressure XAUUSD intraday.
USDX direction will follow payrolls and wages as Fed rate cut expectations stay sensitive.
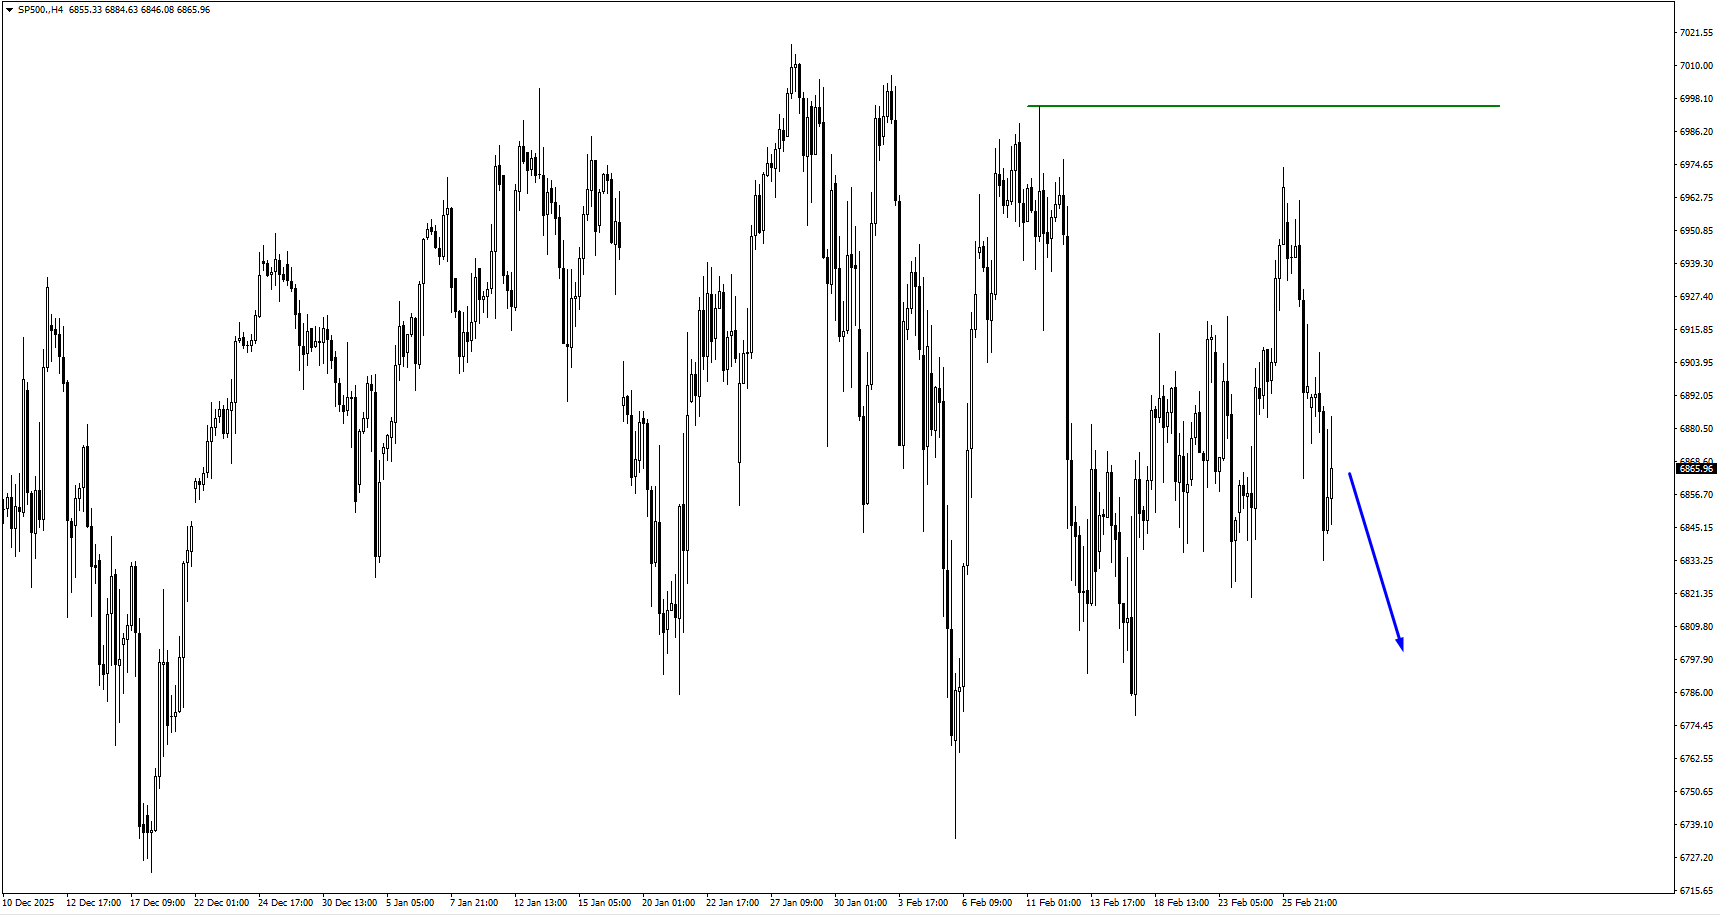
S&P 500 (SP500)
SP500 downside opens if 6777.90 breaks during NFP volatility.
SP500 can struggle if USOil stays bid and the market trims Fed rate cut expectations.
SP500 weakness can keep XAUUSD supported through hedge demand.
Bottom Line
XAUUSD starts the week supported by geopolitics and a market that still wants protection. The next pte cut expectations strengthen after the US jobs report, or whether wages keep the Fed cautious.
Oil is the swing factor. If USOUSD holds a premium, it can keep inflation pressure alive and make the ma timing of the first cut, even if payrolls slow.
Create a live VT Markets account today to access our platform features, including market insights and educational content.
Frequently Asked Questions
1. How does the Iran–US–Israel situation affect gold prices? Rising geopolitical tension usually lifts safe-haven demand, which can support XAUUSD, especially if the US dollar does not surge at the same time.
2. Why is oil so important for Fed rate cut expectations right now? Higher oil prices can feed into inflation expectations, making the Fed more cautious and slowing the path toward rate cuts.
3. Can US Non-Farm Payrolls move gold and the dollar this week? Yes. A softer jobs report and cooler wages can weaken USDX and support XAUUSD, while stronger data can do the opposite.
4. What should traders watch on XAUUSD in the current environment? Traders are watching whether XAUUSD can hold above key support and challenge the 5,455 region, while tracking USDX and US data for confirmation.
5. How does VT Markets’ Week Ahead help traders? VT Markets’ Week Ahead gives a concise view of macro themes, key technical levels, and upcoming events, helping traders plan their positions for the week.
Gold advanced for a fifth consecutive session, trading near four-week highs.
Iran’s reported closure of the Strait of Hormuz heightened supply and inflation concerns.
The US dollar remains firm, yet safe-haven flows continue to support bullion.
Rising oil prices are heightening inflation risks and complicating expectations for Fed rate moves.
Gold prices extended gains on Tuesday, marking a fifth consecutive session of advances as geopolitical tensions in the Middle East intensified.
An Iranian Revolutionary Guard commander said the Strait of Hormuz is closed, Reuters reported, citing Iranian media. Iran vowed to set any ship trying to pass through the strait on fire, the outlet reported.
Spot gold traded near $5,363 per ounce, while US futures approached $5,377. The rally follows sustained military escalation between the United States, Israel and Iran, with markets increasingly pricing the risk of a prolonged regional conflict.
The safe-haven bid has strengthened as uncertainty around the duration and scope of the conflict remains elevated.
Strait of Hormuz Closure Raises Structural Risk
Iranian media reported that a senior official from the Islamic Revolutionary Guard Corps stated that the Strait of Hormuz has been closed, warning that ships attempting passage would be targeted.
The Strait handles roughly one-fifth of global oil flows. Even temporary disruption significantly tightens energy supply expectations and introduces broader macroeconomic risk.
Senior gas executives say China is pressuring Iranian officials to avoid action that would disrupt Qatari gas exports or other energy shipments making their way through the Strait of Hormuz, a key maritime chokepoint https://t.co/6G7vLejynz
Oil market stress feeds directly into inflation expectations, which in turn influences real yields — a critical driver for gold pricing.
While the full operational status of shipping lanes remains fluid, the market response reflects heightened sensitivity to energy supply risk.
Gold and the Dollar Rising Together
The US dollar remains near a more than five-week high, reflecting its own safe-haven status.
Although a stronger dollar typically acts as a headwind for gold, that inverse relationship weakens during periods of acute geopolitical stress. Traders often accumulate both assets simultaneously as defensive positioning increases.
This concurrent strength suggests that capital preservation, rather than currency dynamics, is driving flows.
Inflation Pressures and Policy Implications
Escalating oil prices and reduced shipping volumes through the Strait of Hormuz are reinforcing inflation concerns.
If energy prices remain elevated, inflation expectations may rise as markets reassess the timing of Federal Reserve rate cuts.
Gold’s current rally reflects both:
Immediate geopolitical risk
Broader concerns around inflation persistence
The interaction between these forces will shape near-term volatility.
Technical Positioning
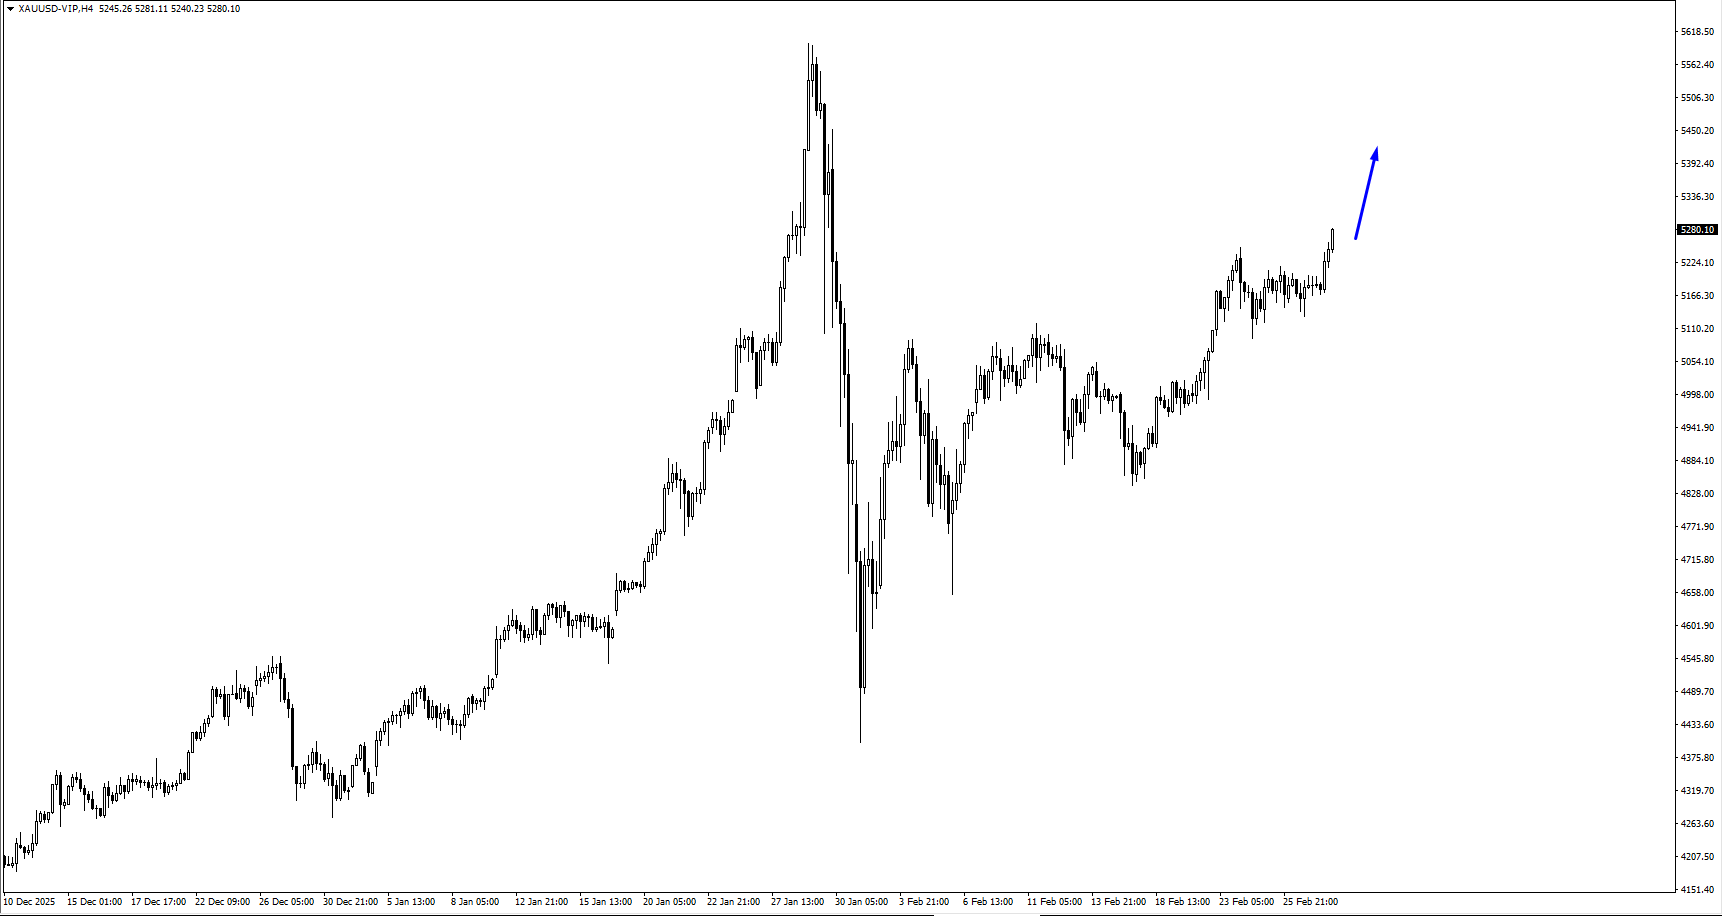
Gold (XAUUSD) is trading near 5,365, up roughly 0.8% on the session, as the metal continues its steady advance toward the prior high at 5,598.60. The broader daily structure remains firmly bullish, with price maintaining a clear sequence of higher highs and higher lows since the February pullback.
Price is comfortably above the key moving averages. The 5-day (5,264) and 10-day (5,177) are sloping higher, while the 20-day (5,074) and 30-day (5,057) remain well below current levels and trending upward. This alignment confirms strong upside momentum and reinforces the prevailing uptrend.
Immediate resistance sits near the 5,550–5,600 zone, where the previous peak capped gains. A sustained break above 5,600 would confirm fresh bullish expansion and could open the path toward the 5,750 region.
On the downside, initial support is seen around 5,250–5,300, followed by stronger structural support near 5,100. As long as price holds above the 20-day average, the broader bullish structure remains intact, with pullbacks likely to be viewed as corrective rather than trend-changing.
Why is gold rising for a fifth straight session? Gold is benefiting from sustained safe-haven demand as US-Israel military action against Iran intensifies and uncertainty around the Strait of Hormuz increases.
How does the Strait of Hormuz affect gold prices? The Strait handles roughly 20% of global oil shipments. Disruption raises oil prices, which can fuel inflation concerns. Higher inflation expectations often support gold by pressuring real yields.
Why is gold rising even though the US dollar is strong? During periods of heightened geopolitical stress, traders often buy both gold and the US dollar as defensive assets. The typical inverse correlation can weaken under such conditions.
Could rising oil prices push gold higher? Yes. Sustained increases in energy costs can reinforce inflation expectations and complicate central bank policy decisions, creating a supportive environment for bullion.
What would limit gold’s upside from here? A credible de-escalation in Middle East tensions, stabilisation in oil markets or a sharp rise in real yields could reduce safe-haven demand and prompt consolidation.
Start trading now – Click here to create your real VT Markets account
The US dollar index (USDX) stabilised near 98.5 after rising nearly 1% in the previous session.
Escalating US-Israel military activity against Iran boosted safe-haven demand.
Rising energy prices are reinforcing inflation concerns and pushing back Fed rate-cut expectations.
Markets now expect the next Fed cut in September rather than July.
Dollar Supported by Global Risk Premium
The US dollar index hovered around 98.5 after surging nearly 1% in the prior session, as investors sought safety amid intensifying Middle East tensions.
Reports that Washington may significantly ramp up military action against Iran by targeting missile production, drone programmes and naval assets have reinforced risk aversion across markets.
Prediction markets have spent the past year courting Wall Street money and Washington legitimacy with an ambitious pitch: markets that let people bet on real-world events can produce better, faster information than any alternative. https://t.co/xk74qzq8gX
In periods of geopolitical stress, the dollar typically benefits from its reserve currency status and the depth of US Treasury markets. That dynamic was evident as capital rotated defensively.
Energy Shock Complicates Rate-Cut Outlook
The dollar’s strength is not solely a safe-haven reaction.
Rising oil prices, driven by escalating conflict, have renewed inflation concerns. Higher energy costs feed into transportation, manufacturing and consumer pricing channels, potentially slowing progress toward the Federal Reserve’s inflation target.
The war in Iran has pushed the world to the brink of an energy crisis, but oil traders are keeping calm — for now https://t.co/sQcC8jmfdz
Markets have consequently pushed back expectations for the next Fed rate cut to September, from earlier projections of July. However, approximately two 25-basis-point cuts remain priced in for the year.
The repricing reflects growing uncertainty around how persistent energy-driven inflation could influence policy timing.
Pressure on Energy-Importing Economies
Elevated oil prices are weighing more heavily on major energy-importing economies, particularly in Europe and Japan.
Japan is monitoring financial markets with vigilance and will take any necessary action in response to sharp movements, Finance Minister Satsuki Katayama said, as volatility intensifies following the US and Israeli attack on Iran https://t.co/6Jbpyf6B4e
Higher energy costs can widen trade deficits, pressure corporate margins and dampen growth expectations. This dynamic has contributed to relative weakness in the euro and yen compared with the US dollar.
The divergence highlights how commodity shocks can alter currency performance through both inflation and trade channels.
Technical Outlook for USDX
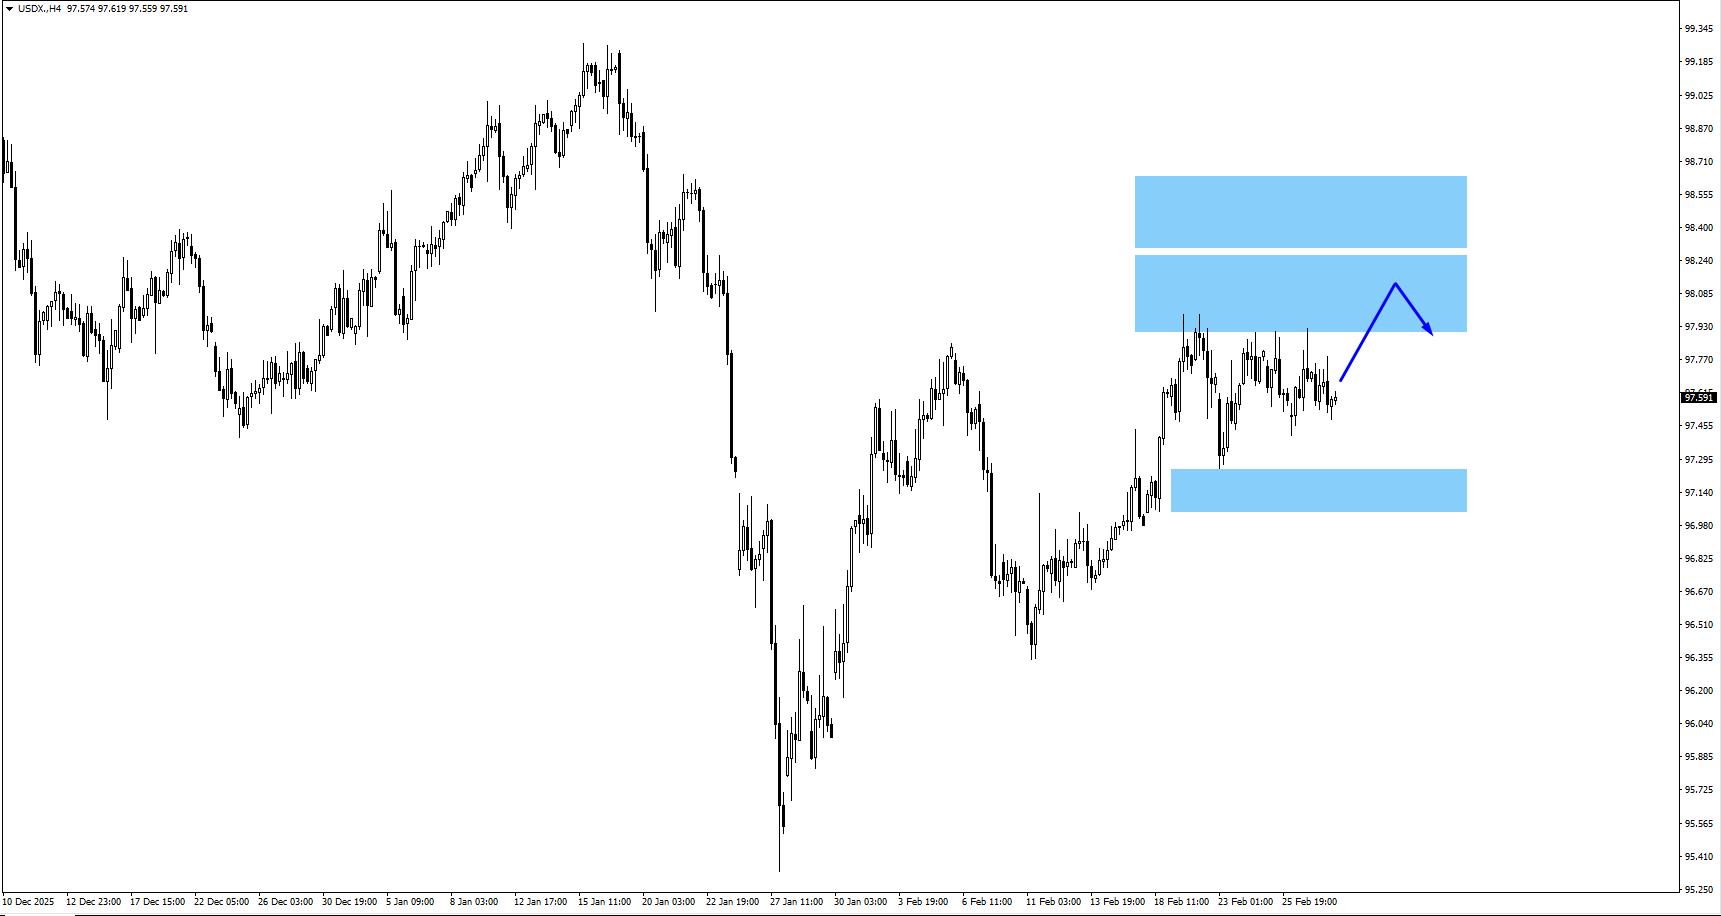
The US Dollar Index (USDX) is trading near 98.52, marginally higher on the session, as the dollar continues to stabilise following its rebound from the 95.34 January low. The broader structure shows a recovery phase underway after the sharp mid-winter decline.
On the daily chart, price is now holding above the short-term moving averages. The 5-day (97.97) and 10-day (97.84) are turning higher, while the 20-day (97.45) and 30-day (97.30) sit just below current price and are beginning to flatten.
This alignment suggests improving short-term momentum, with the dollar attempting to build a higher base.
Immediate resistance lies near 98.80–99.30, where previous consolidation and rejection occurred. A sustained break above 99.30 would strengthen the recovery narrative and open the path toward the psychological 100.00–100.30 region.
On the downside, initial support is seen around 97.80, followed by stronger support near 97.30–97.50. A move back below 97.30 would weaken the rebound structure and could shift momentum back to the downside.
Why is the US dollar rising? The dollar is strengthening due to safe-haven demand amid escalating Middle East tensions and expectations that higher energy prices could delay Federal Reserve rate cuts.
How do rising oil prices support the dollar? Higher oil prices can reinforce inflation pressures in the US, potentially reducing the urgency for the Fed to cut interest rates. Fewer expected rate cuts generally support the dollar through yield differentials.
Why are the euro and yen under pressure? Europe and Japan are major energy importers. Rising oil prices increase their import costs and can weaken growth prospects, placing downward pressure on their currencies relative to the dollar.
Have Fed rate-cut expectations changed? Yes. Markets have shifted expectations for the next Fed rate cut to September from July, although two rate reductions are still broadly priced in for the year.
What would weaken the dollar from here? A rapid de-escalation in geopolitical tensions, a decline in energy prices or significantly weaker US economic data could reduce safe-haven flows and revive earlier rate-cut expectations.
Start trading now – Click here to create your real VT Markets account
Please note that the dividends of the following products will be adjusted accordingly. Index dividends will be executed separately through a balance statement directly to your trading account, and the comment will be in the following format “Div & Product Name & Net Volume”.
Please refer to the table below for more details:
The above data is for reference only, please refer to the MT4/MT5 software for specific data.
If you’d like more information, please don’t hesitate to contact info@vtmarkets.com.
Markets now balance geopolitical risk against evolving US rate-cut expectations.
Gold rose nearly 2% as escalating US-Israel strikes on Iran increased geopolitical risk.
The rally occurred despite a stronger US dollar, signalling firm safe-haven demand.
Sustained energy price gains could reinforce inflation pressures globally.
Spot gold rose around 1.9% to $5,376 per ounce, after touching its highest level in more than four weeks. US gold futures gained roughly 2.7% to $5,389.
The advance followed major US and Israeli strikes on Iran, including the reported killing of Supreme Leader Ayatollah Ali Khamenei, and continued missile exchanges across the region.
Following the killing of Iran's Supreme Leader Ayatollah Ali Khamenei on March 1, many senior US officials remain skeptical that the US and Israeli military operation against the Islamic Republic will lead to a regime change in the near term https://t.co/ILvIEKq6oE
Markets are now assessing the probability of a prolonged period of instability rather than a contained escalation.
Geopolitical Risk and Safe-Haven Allocation
Unlike earlier flare-ups, the latest developments materially shift the regional political landscape. Leadership uncertainty increases the risk of miscalculation and sustained military engagement.
Gold’s reaction reflects more than a single headline. It represents a broader reassessment of geopolitical risk.
Cash and gold are expected to be winners when markets reopen after US-Israeli strikes in Iran. Hear more on Reuters Morning Bid podcast https://t.co/DSHmSWTgX6
Safe-haven flows were evident across assets, with gold rising despite a firmer US dollar. The dollar index gained 0.27%, which would normally temper bullion’s advance. The fact that gold strengthened alongside the dollar suggests that defensive positioning is currently outweighing currency headwinds.
Inflation and Rate Expectations in Focus
Friday’s US producer price data surprised to the upside, indicating that inflation pressures may remain persistent.
A sustained rise in oil prices due to Middle East tensions could reinforce that inflation risk. Higher energy costs feed directly into transportation and production chains, potentially complicating the Federal Reserve’s policy path.
Markets are currently pricing a meaningful probability of rate cuts later this year. However, if inflation expectations rise alongside geopolitical risk, that pricing may become more volatile.
Gold’s outlook will therefore depend on how these two forces — inflation persistence and rate expectations — evolve in tandem.
Technical Outlook
Gold (XAUUSD) is trading near 5,391, up more than 2% on the session, as the metal accelerates higher and approaches the previous swing high at 5,598.60. The daily structure shows a strong bullish continuation move following the recent consolidation phase.
Price has cleanly broken above the short-term moving averages, with the 5-day (5,234) and 10-day (5,135) turning sharply higher. The 20-day (5,056) and 30-day (5,039) remain well below current levels and continue to slope upward, reinforcing the strength of the broader uptrend.
The widening gap between price and the longer-term averages signals strong upside momentum, though it also increases the likelihood of short-term volatility.
Immediate resistance now sits at the prior high near 5,600. A decisive break above that level would confirm fresh bullish expansion and potentially open the path toward the 5,750–5,800 zone. On the downside, former resistance around 5,250–5,300 becomes first support, followed by stronger support near 5,100. As long as price holds above the 20-day average, the broader bullish structure remains intact, with pullbacks likely to be viewed as corrective within the prevailing uptrend.
What to Watch This Week
Markets will monitor upcoming US labour data, including ADP employment figures, weekly jobless claims and the non-farm payrolls report.
Stronger data could temper rate-cut expectations and introduce short-term volatility. Conversely, softer readings alongside continued geopolitical strain would likely reinforce gold’s defensive appeal.
At present, gold is responding to a broad repricing of global risk rather than a single catalyst.
Why did gold prices rise so sharply? Gold advanced following major US and Israeli strikes on Iran that significantly escalated geopolitical tensions. The market is now pricing a higher probability of sustained regional instability rather than a short-lived exchange. In periods of elevated uncertainty, gold typically attracts defensive capital flows.
Why did gold rise even though the US dollar strengthened? The US dollar index gained modestly, which would normally cap bullion’s upside. However, gold rose alongside the dollar, indicating that safe-haven demand outweighed currency headwinds. When both assets strengthen simultaneously, it often signals broader risk aversion rather than simple FX dynamics.
How does Middle East conflict affect gold prices structurally? Escalation in the Middle East increases geopolitical risk premiums across global markets. Gold benefits as investors seek liquidity and capital preservation. Prolonged instability can also disrupt energy markets, raising inflation expectations — another supportive factor for bullion.
Could higher oil prices further support gold? Yes. Sustained increases in oil prices can reinforce inflation pressures. If energy costs remain elevated, central banks may face a more complex policy environment. Gold tends to perform well when inflation risks rise or when real yields come under pressure.
Is this rally purely geopolitical, or are structural drivers still in place? The current move is geopolitical in catalyst, but structural drivers remain supportive. Central bank reserve accumulation, ETF inflows and expectations of eventual Federal Reserve easing have underpinned gold’s broader uptrend in 2025. These factors provide a base beyond short-term headlines.
What economic data could influence gold next? Upcoming US labour market readings — including ADP employment, jobless claims and non-farm payrolls — could shift rate-cut expectations. Stronger data may temper easing bets and introduce volatility, while softer data combined with geopolitical strain could reinforce gold’s defensive appeal.
What technical levels matter for gold? Immediate resistance sits near the recent high around $5,600. A sustained break above that level would likely open the path toward fresh record territory. On the downside, initial support lies in the $5,200–$5,250 region.
What would cause gold to pull back meaningfully? A rapid de-escalation in geopolitical tensions, combined with stronger-than-expected economic data and a rise in real yields, could reduce safe-haven demand and prompt consolidation.
Start trading now – Click here to create your real VT Markets account
Written on March 2, 2026 at 12:11 am, by josephine
Brent crude surged 6.4% to $77.57, briefly topping $82.
WTI jumped 6.2% to $71.17 amid escalating Middle East conflict.
Around 20% of global oil and LNG flows through the Strait of Hormuz.
Prolonged disruption could reignite global inflation pressures.
Markets now face a heavy US data week including ISM, retail sales, and payrolls.
Oil Prices Spike on Strait of Hormuz Supply Threat
Oil (CL-OIL) prices surged sharply on Monday as military conflict in the Middle East intensified, raising concerns over supply disruptions through the Strait of Hormuz — a critical artery for global energy trade.
Brent crude climbed 6.4% to $77.57 per barrel, briefly topping $82, while US WTI crude rose 6.2% to $71.17.
Roughly 20% of global seaborne oil trade and 20% of LNG shipments pass through the Strait. Reports of halted or delayed tanker traffic triggered fears of a supply bottleneck.
Oil producers in the Middle East could likely sustain output for “no more than 25 days” if the Strait of Hormuz were to shut completely due to conflict in the region, according to analysts from JPMorgan https://t.co/ZhYkdEstkX
Analysts warn that if traffic through the Strait is effectively halted, up to 15 million barrels per day could be temporarily removed from global markets.
Unless de-escalation emerges swiftly, markets may continue repricing oil higher.
Inflation Risk Returns to the Forefront
A sustained oil spike acts as:
A tax on consumers
A cost shock to businesses
A driver of renewed inflation
Historically, prolonged Middle East supply disruptions have triggered multi-month price rallies. Analysts have drawn comparisons to the 1970s oil embargo, adjusted for modern price levels.
Trump called Cuba a 'failed nation', as a continuous oil embargo further cripples the country's flights and airport operations pic.twitter.com/mFMFKz1Tfr
In the event of sustained Strait disruptions, incremental production increases may not meaningfully offset supply risks.
In short: output capacity exists, but logistics matter.
Oil Technical Outlook
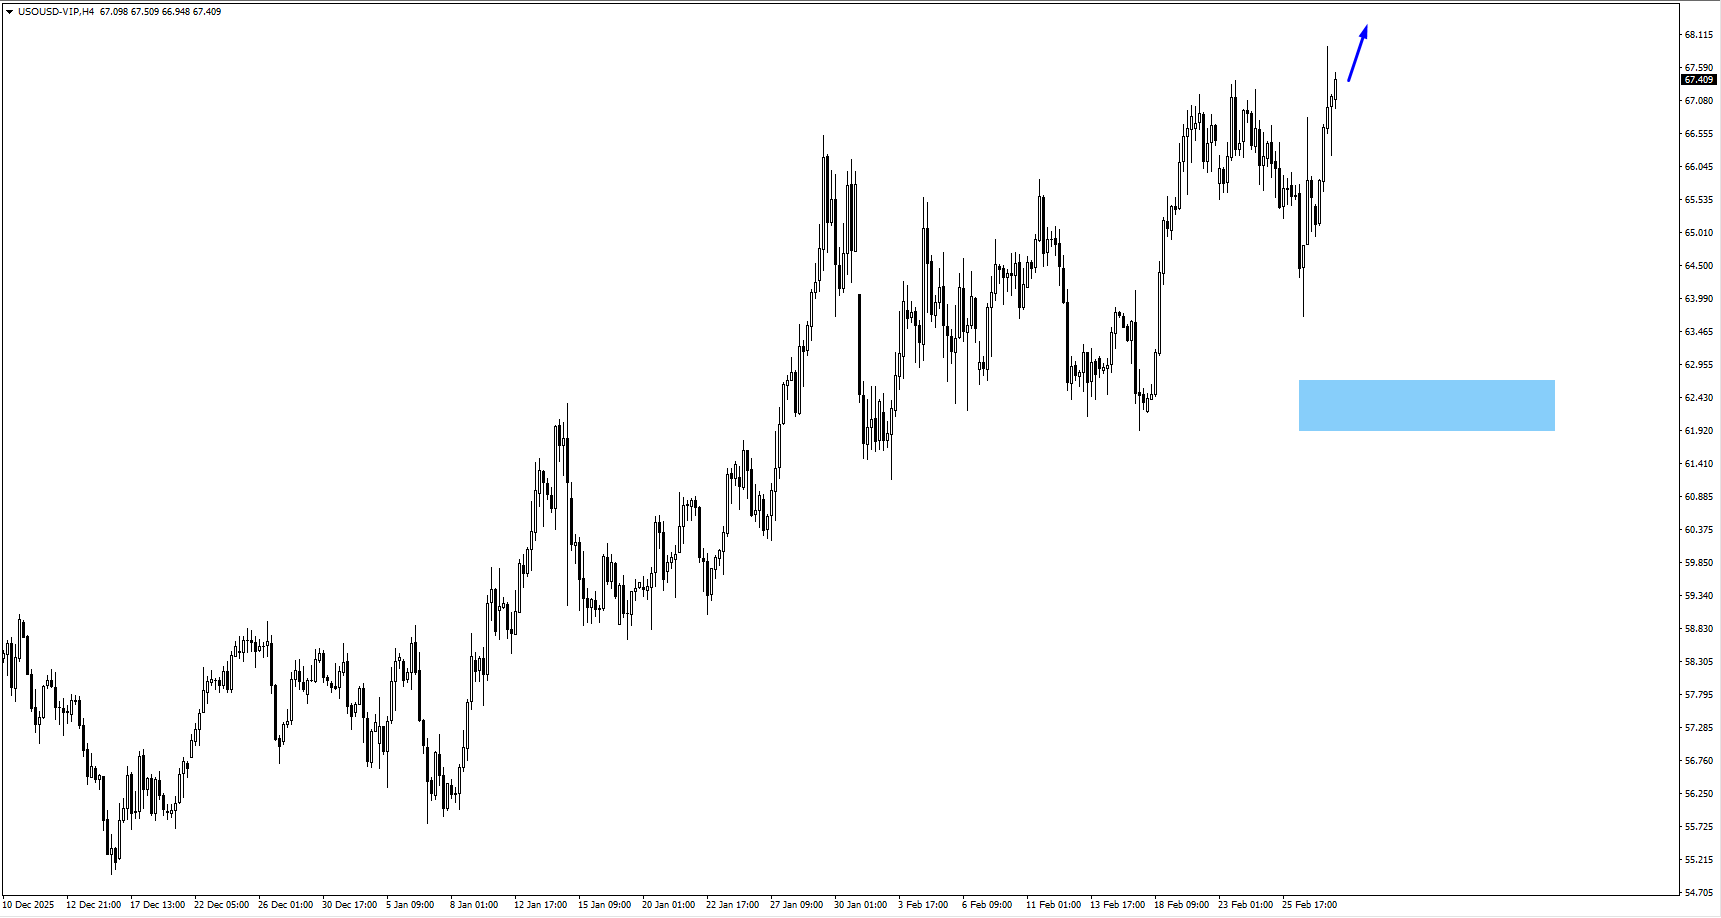
Crude oil (CL) is trading near 71.61, up more than 6% on the session, marking a decisive breakout above the recent consolidation range and pushing into fresh recovery highs.
The daily chart shows a strong bullish expansion candle, with price surging through the prior resistance zone around 67.00–69.00 and briefly testing the 74.96 high. This move extends the rebound from the January low at 54.87, confirming a clear sequence of higher highs and higher lows.
From a moving average perspective, momentum is firmly constructive. The 5-day (67.19) and 10-day (66.23) are accelerating higher, while the 20-day (64.98) and 30-day (64.03) remain well below price and trending upward.
The widening separation between price and the longer-term averages reflects strong upside momentum, though it also raises the probability of short-term pullbacks after such an aggressive move.
Immediate resistance now sits near 74.90–76.60, with 76.60 marking the next visible upside level. On the downside, former resistance around 69.00–70.00 now becomes first support.
A pullback toward that zone would be technically healthy within the current bullish structure. As long as price holds above the 20-day average near 65.00, the broader recovery trend remains intact.
Learn more about trading Energies on VT Markets here.
Frequently Asked Questions
Why are oil prices rising sharply? Oil prices surged due to escalating military conflict in the Middle East and concerns that supply flows through the Strait of Hormuz could be disrupted. Around 20% of global seaborne oil passes through the strait, making it a critical chokepoint for energy markets.
How high did Brent and WTI crude rise? Brent crude jumped over 6% to around $77.50 per barrel, briefly topping $82. US West Texas Intermediate (WTI) climbed more than 6% to trade near $71 per barrel.
Why is the Strait of Hormuz important for oil markets? The Strait of Hormuz handles roughly one-fifth of global seaborne oil trade and a significant portion of LNG exports. Any disruption can remove millions of barrels per day from global supply, triggering sharp price spikes.
Could oil prices rise further from here? Yes. If the conflict escalates or tanker traffic remains restricted, oil could continue repricing higher. Sustained disruption could push prices toward $80–$90 per barrel or beyond, depending on the scale and duration of supply losses.
How does rising oil impact inflation? Higher oil prices increase transportation, manufacturing, and energy costs. This can feed into consumer prices and potentially reignite inflation pressures globally, complicating central bank policy decisions.
What is OPEC+ doing to stabilise oil prices? OPEC+ agreed to a modest production increase of around 206,000 barrels per day for April. However, additional supply may not fully offset disruptions if shipping through the Middle East remains constrained.
Why did stock markets fall when oil surged? Higher oil prices act like a tax on businesses and consumers, reducing disposable income and raising input costs. Equity markets often decline when energy shocks threaten economic growth and corporate margins.
What should traders watch next in the oil market? Key developments include updates on military activity in the Middle East, tanker traffic through the Strait of Hormuz, OPEC+ production decisions, and major US economic data such as ISM, retail sales, and nonfarm payrolls.
Start trading now – Click here to create your real VT Markets account
Written on March 1, 2026 at 10:53 pm, by josephine
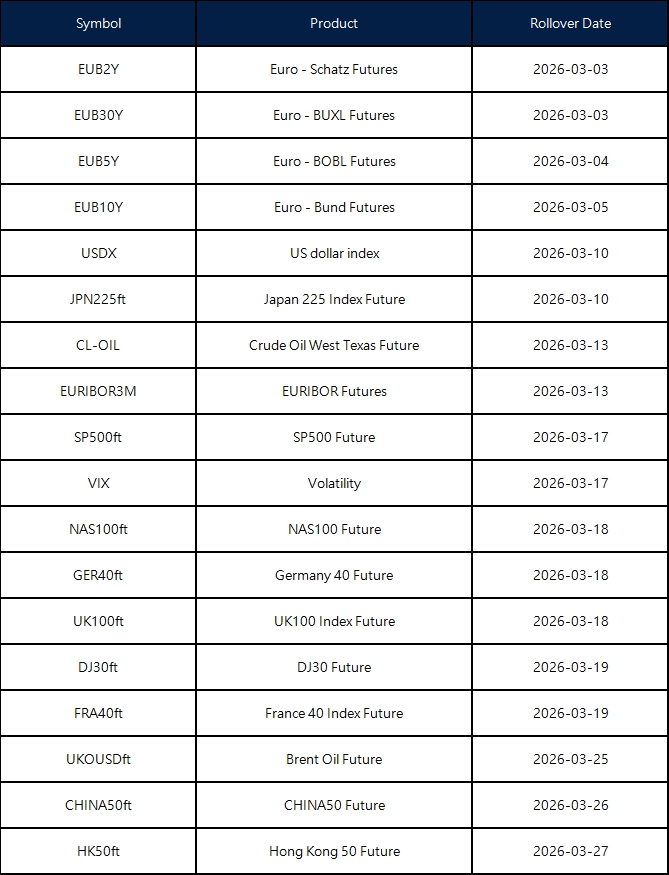
New contracts will automatically be rolled over as follows:
Please note:
• The rollover will be automatic, and any existing open positions will remain open.
• Positions that are open on the expiration date will be adjusted via a rollover charge or credit to reflect the price difference between the expiring and new contracts.
• To avoid CFD rollovers, clients can choose to close any open CFD positions prior to the expiration date.
• Please ensure that all take-profit and stop-loss settings are adjusted before the rollover occurs.
• All internal transfers for accounts under the same name will be prohibited during the first and last 30 minutes of the trading hours on the rollover dates.
The above data is for reference only. The actual rollover date shall be subject to the Liquidity Provider’s determination.
If you’d like more information, please don’t hesitate to contact info@vtmarkets.com.
Written on February 28, 2026 at 3:13 am, by anakin
As part of our commitment to provide the most reliable service to our clients, there will be maintenance this weekend.
Maintenance Details:
Please note that the following aspects might be affected during the maintenance:
1. The price quote and trading management will be temporarily disabled during the maintenance. You will not be able to open new positions, close open positions, or make any adjustments to the trades.
2. There might be a gap between the original price and the price after maintenance. The gaps between Pending Orders, Stop Loss, and Take Profit will be filled at the market price once the maintenance is completed. It is suggested that you manage the account properly.
3. During the maintenance period, VT Markets APP will not be available. It is recommended that you avoid using it during the maintenance.
The above data is for reference only. Please refer to the MT4/MT5 software for the specific maintenance completion and marketing opening time.
Thank you for your patience and understanding about this important initiative.
If you’d like more information, please don’t hesitate to contact info@vtmarkets.com.
Written on February 27, 2026 at 10:03 am, by anakin
Affected by international holidays, the trading hours of some VT Markets products will be adjusted. Please check the following link for the affected products:


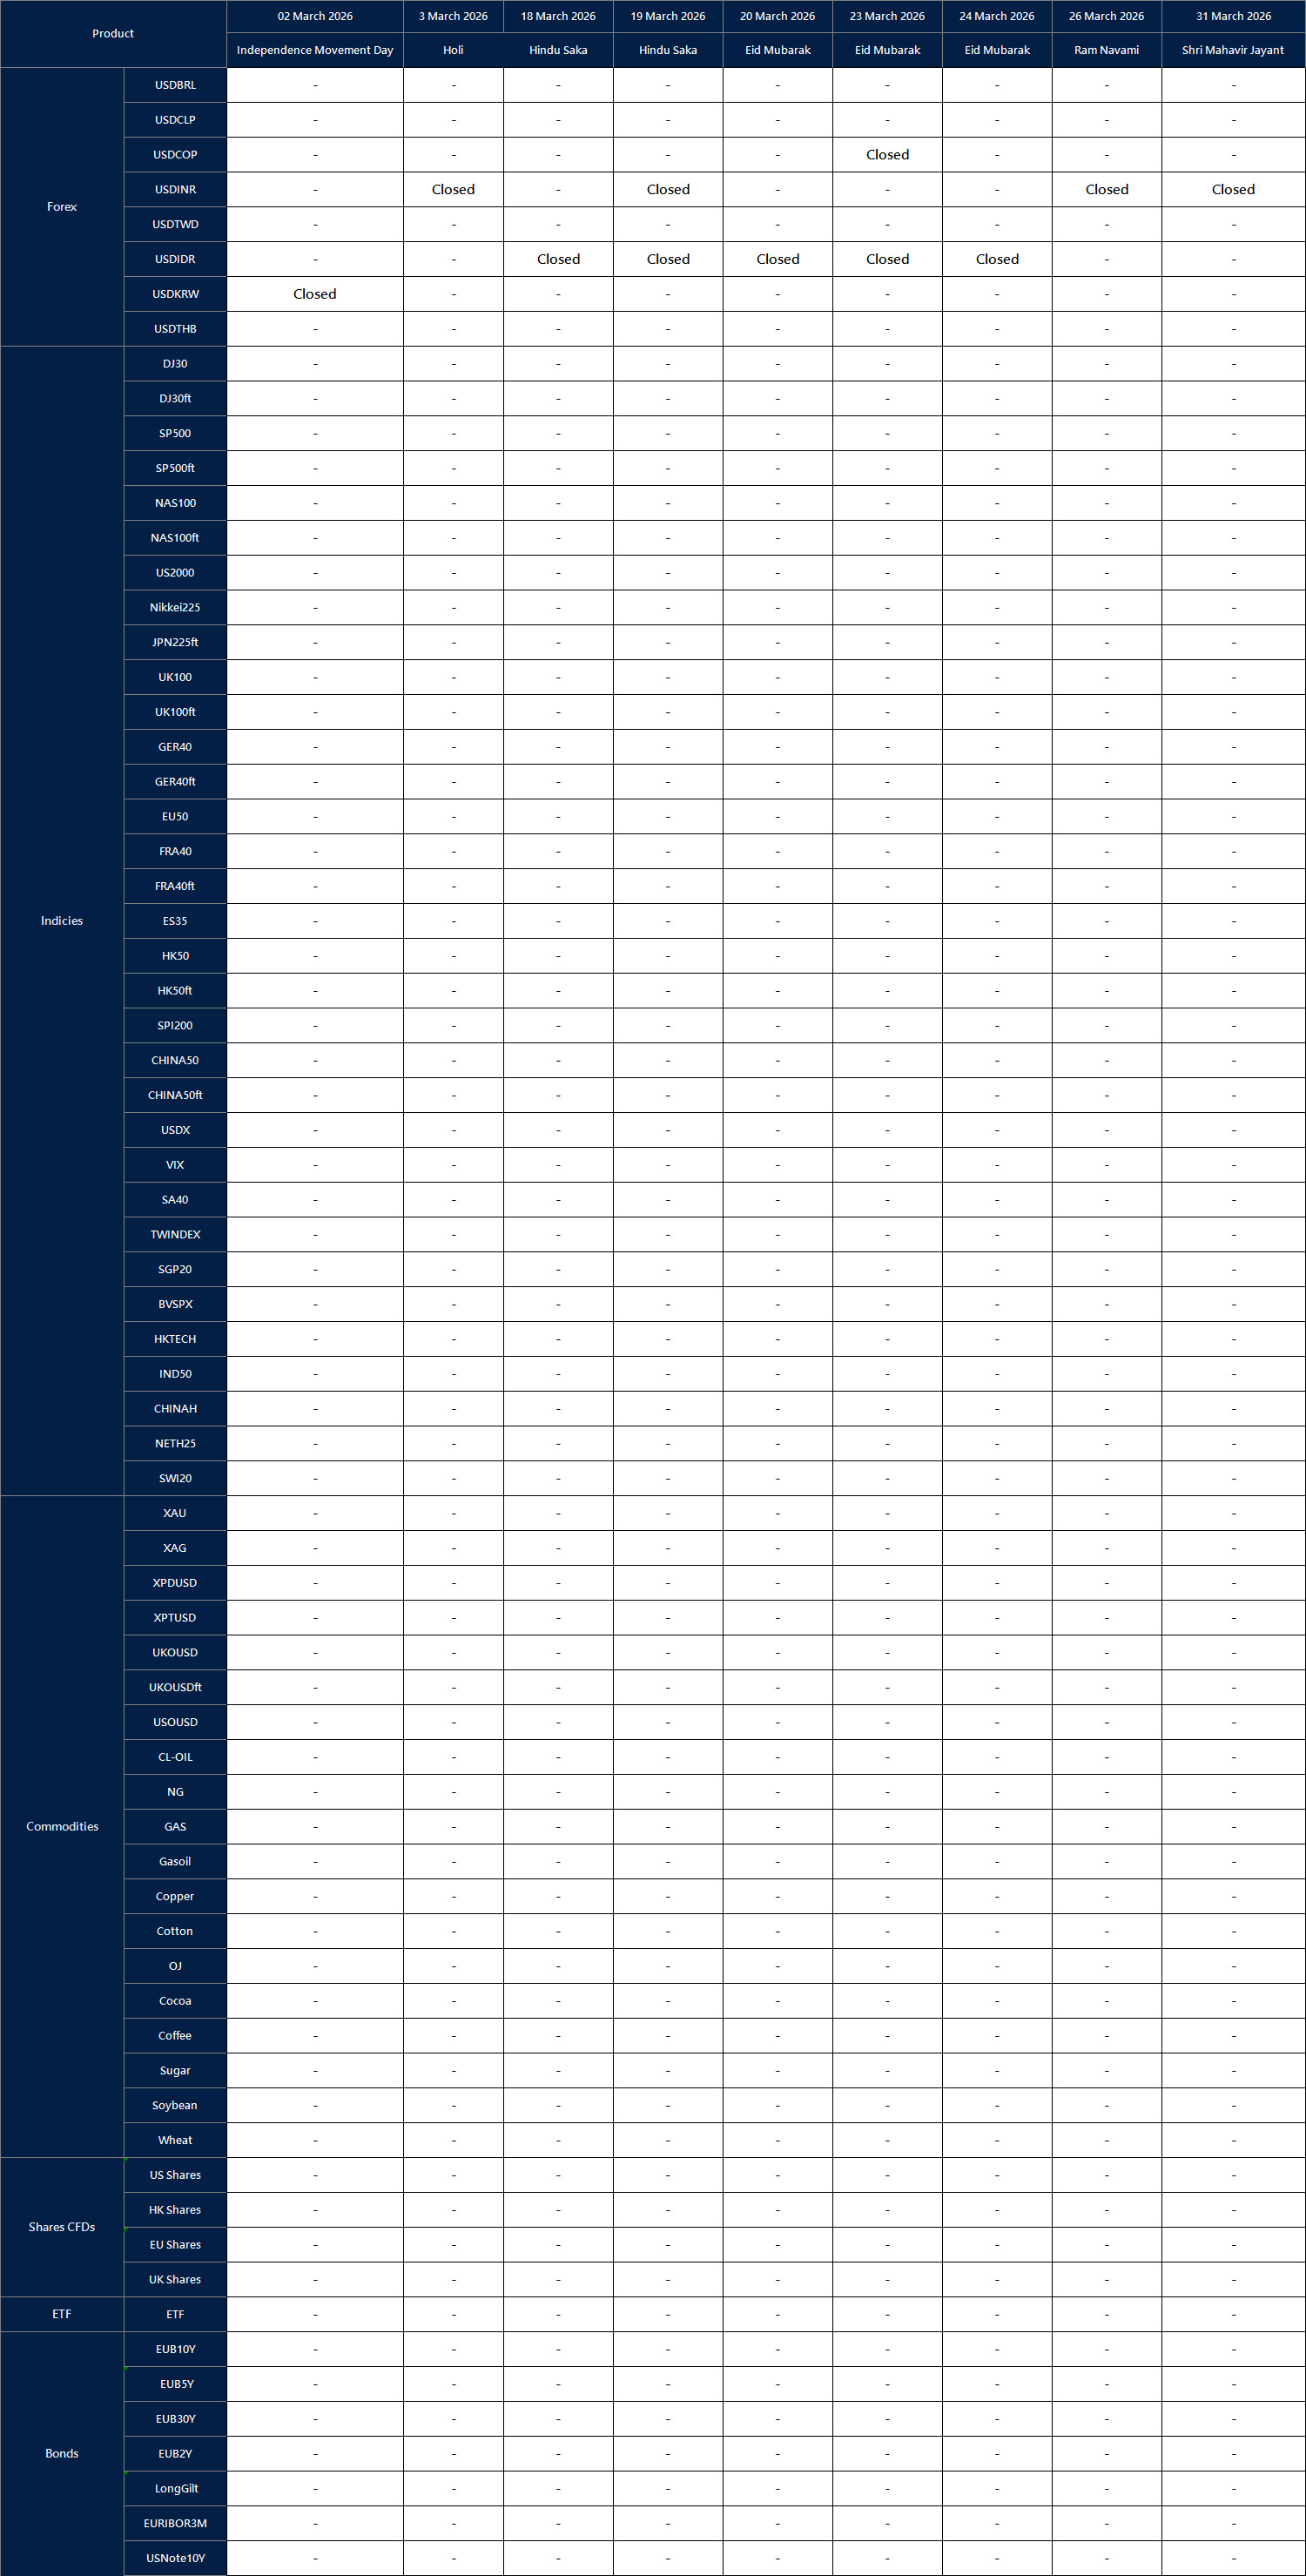