Please note that the dividends of the following products will be adjusted accordingly. Index dividends will be executed separately through a balance statement directly to your trading account, and the comment will be in the following format “Div & Product Name & Net Volume”.
Please refer to the table below for more details:
The above data is for reference only, please refer to the MT4/MT5 software for specific data.
If you’d like more information, please don’t hesitate to contact info@vtmarkets.com.
Middle East conflict keeps USOil elevated and may delay Fed rate cut expectations.
XAUUSD tests downside liquidity near 4,996 as USDX consolidates.
BOJ policy decision could move USDJPY as price approaches 160.
FOMC press conference may reset Fed rate expectations.
Markets are now reacting to a geopolitical confrontation that began with Operation Epic Fury on 28 February 2026. What initially started as targeted US strikes has expanded into a broader regional conflict with no clear timeline for resolution.
Bloomberg's Jeff Mason, Joumanna Bercetche and Ethan Bronner discuss US, Israel launch of 'Operation Epic Fury' in Iran on Bloomberg This Weekend.
The conflict has quickly moved beyond military headlines and into macroeconomics. Traders are now focused on how long the US economy can absorb the shock of rising energy prices and geopolitical risk.
Brent crude surged from roughly $70 to above $110 per barrel, signalling a sharp repricing of geopolitical risk. Analysts warn that if oil prices remain above $130, global GDP growth could fall by about 0.6% in the first half of 2026.
If oil prices continue to rise, inflation expectations could climb again and delay Fed rate cuts.
The Market “Crack” Point
Energy markets influence consumer spending faster than most macro variables.
Historically, US gasoline prices approaching $4.00 per gallon have triggered sharp declines in consumer spending. That level is often where the broader economy begins to feel the full impact of rising oil prices.
If consumer demand slows while inflation remains elevated, the Federal Reserve faces a difficult choice between supporting growth and controlling prices.
For traders, this creates a two-sided risk environment.
Equities and crypto tend to weaken if economic growth slows, while gold can benefit from uncertainty and geopolitical demand.
Consumer stress from energy prices can drive volatility across XAUUSD, BTCUSD and SP500.
The Strait of Hormuz and Global Oil Supply
Energy supply risk has become another major concern.
Roughly 20% of the world’s oil supply passes through the Strait of Hormuz, making it one of the most important energy chokepoints in global trade.
Any threat to shipping routes or tanker traffic in that region can immediately push oil prices higher.
The US Navy can attempt to secure shipping lanes, but maintaining that protection requires a large and sustained military presence. Strategic petroleum reserves can cushion short-term disruptions, but they cannot fully offset a prolonged supply shock.
President Donald Trump said he is “demanding” that other countries contribute to the defense of Strait of Hormuz as it remains effectively closed to oil tankers https://t.co/ARQXPCyWw2
Continued threats to the Strait of Hormuz could keep oil elevated and sustain inflation pressure.
If you’d like to read more about how wars affect oil prices, check out our Opinion article here.
The Stagflation Risk
The most dangerous scenario for markets is stagflation.
Rising oil prices increase inflation while also reducing consumer spending and corporate profitability. That combination slows economic growth while keeping prices elevated.
This creates a policy dilemma for the Federal Reserve. Under normal circumstances, the Fed would keep rates high to control inflation. However, a sharp slowdown or market sell-off could increase pressure on policymakers to ease financial conditions.
The geopolitical context adds another layer to the debate. Some analysts believe that a severe market downturn during a national security crisis could push political pressure on the Fed to cut rates aggressively.
Stagflation would create volatility across currencies, commodities and equities.
Strategic Endurance and Market Psychology
The conflict also introduces a strategic endurance element that markets must consider.
Iran has built a decentralised defence structure designed to withstand sustained attacks. Instead of relying on a single command centre, the country operates through multiple regional zones that can continue functioning even if leadership structures are disrupted.
This strategy is designed to prolong the conflict and increase the economic cost for its opponents.
The longer the conflict continues, the greater the pressure on oil prices, inflation and financial markets.
A prolonged conflict increases the probability of persistent oil volatility and macro instability.
Key Symbols to Watch
XAUUSD | BTCUSD | USDX | SP500 | USDJPY
Upcoming Events
Date
Currency
Event
Forecast
Previous
Analyst Remarks
Mar 17
AUD
RBA Press Conference
—
—
RBA tone may affect risk sentiment across Asia
Mar 18
CAD
BOC Press Conference
—
—
Guidance on inflation outlook may influence oil-linked currencies
USDJPY near 160 increases intervention sensitivity
Mar 19
GBP
Official Bank Rate
—
—
UK policy outlook may influence GBP volatility
Mar 19
EUR
ECB Press Conference
—
—
ECB commentary may affect EURUSD and USDX direction
For a full view of upcoming economic events, check out VT Markets’ Economic Calendar.
Key Movements Of The Week
Gold (XAUUSD)
XAUUSD continues drifting lower with 4,996.04 acting as the key downside trigger.
Buyers may reappear near 4,842 if geopolitical risk increases.
Bitcoin (BTCUSD)
BTCUSD consolidating below 74,041 resistance.
62,502 remains the last structural defence for bullish momentum.
US Dollar Index (USDX)
USDX completed a five-wave advance.
100.321 remains the next upside target if dollar strength continues.
S&P 500 (SP500)
SP500 erased more than 50% of weekly gains during Friday’s session.
6,517 becomes the key downside trigger for sellers.
USDJPY
USDJPY broke above the 159.45 high, signalling continued yen weakness.
Traders now watch 160.00 as the next psychological level ahead of the BOJ press conference.
Bottom Line
The central market theme this week revolves around the interaction between geopolitics, oil prices and monetary policy. Rising energy prices from the Middle East conflict increase inflation risk just as traders anticipate potential Fed easing.
That tension creates a volatile backdrop for XAUUSD, BTCUSD and SP500, while USDJPY approaches the psychologically important 160 level ahead of the BOJ decision.
Central bank communication from the FOMC and BOJ may therefore determine whether markets stabilise or enter another phase of macro-driven volatility.
Create a live VT Markets account today to access our platform features, including market insights and educational content.
Trader FAQs
Why are oil prices driving markets this week?
Oil sits at the centre of the macro story because the Middle East conflict has turned energy supply risk into an inflation risk. If crude stays elevated, traders may push Fed rate cut expectations further out, which can ripple through XAUUSD, USDX, BTCUSD and SP500.
Why does the Strait of Hormuz matter so much to traders?
The Strait of Hormuz handles a large share of global oil flows, so any threat there can keep crude prices bid. For traders, that means higher inflation pressure, more uncertainty around central bank policy, and wider volatility across commodities, currencies and equities.
How do higher oil prices affect Fed rate cut expectations?
Higher oil prices can keep headline inflation sticky even if broader growth begins to soften. That makes it harder for the Fed to sound dovish, because cutting too soon could risk another inflation push.
Why is XAUUSD under pressure if geopolitical risk is rising?
Gold usually benefits from fear, but it also reacts to the dollar and interest rate expectations. If traders respond to war-driven inflation by buying USDX and pushing back Fed rate cut expectations, XAUUSD can struggle even in a tense geopolitical backdrop.
What is the key level to watch on XAUUSD this week?
The first downside level is 4,996.04. If that gives way, traders may start looking for a deeper move, while 4,842 remains the area where buyers could step back in.
18 March, Sydney, Australia – VT Markets, a leading global multi-asset broker, has been honoured with the prestigious “Best Global Football Sponsor – Newcastle United F.C” and “Best Commercial Spot – Together, Into Tomorrow” awards at the Forex Sports Awards 2026. The double accolades recognise the brand’s high-impact partnership with Newcastle United, celebrating excellence in global brand alignment and fan engagement.
The Forex Sports Awards, organised by Sports Media Gaming Limited, recognise outstanding sports sponsorships within the financial industry. Winners are determined through a comprehensive process involving public voting and an independent panel of industry experts from the sports and media sectors.
The second year of VT Markets’ partnership with Newcastle United as its Official Financial Trading Partner has been marked by the “Together, Into Tomorrow” brand film and a series of successful community initiatives across Asia, including football equipment donations for youth development in Indonesia, Vietnam, and Thailand.” Seeing our synergy with Newcastle United recognised on a global stage is a testament to the strength of our partnership,” said Dandelyn Koh, Head of Global Marketing at VT Markets.”. This recognition belongs to the fans and our clients who have joined us on this journey. We look forward to continuing our mission of empowering the community and bringing the excitement of the game to our audiences worldwide.”
Tis milestone marks a new chapter for VT Markets as the company continues to push the boundaries of what a sports partnership can achieve by delivering tangible value and excitement to sports fans and a wider a global audience.
About VT Markets
VT Markets is a regulated multi-asset broker with a presence in over 160 countries as of today. It has earned numerous international accolades including Best Online Trading and Fastest Growing Broker. In line with its mission to make trading accessible to all, VT Markets offers comprehensive access to over 1,000 financial instruments and clients benefit from a seamless trading experience via its award-winning mobile application.
USDX trades near 99.26, down -0.03%, extending its recent pullback.
Easing oil prices have supported risk appetite, weighing on safe-haven demand for the dollar.
Markets now focus on Federal Reserve and global central bank meetings for policy direction.
The U.S. dollar softened on Wednesday, giving back some of its recent safe-haven gains as oil prices eased and market sentiment improved ahead of a pivotal week for global central banks.
The US Dollar Index (USDX) is trading near 99.26, down -0.03%, marking a third consecutive session of declines. The move follows a strong rally last week that pushed the dollar to a 10-month high, driven by escalating geopolitical tensions and surging energy prices.
The dollar and US stocks are at their most inversely correlated in nearly a year, reasserting the typical relationship between the assets associated with the greenback’s haven status https://t.co/4hXPEzhmdD
However, with oil prices pausing and pulling back modestly, markets have begun to reintroduce risk exposure, reducing demand for the dollar.
If oil continues to stabilise or decline, the dollar may face further short-term pressure as risk sentiment improves.
Oil Pullback Eases Safe-Haven Demand
The key driver behind the dollar’s recent weakness has been the easing in oil prices. Crude declined after Iraqi and Kurdish authorities agreed to resume exports via Turkey’s Ceyhan port, helping to ease immediate supply concerns.
Iraq has halted oil exports from its semi-autonomous Kurdistan region to the port of Ceyhan in Turkey, according to people with direct knowledge of the situation. https://t.co/wQxdCmEeaE
While Brent crude remains above $100 per barrel, the pause in its upward momentum has been enough to shift market positioning, at least temporarily.
Lower oil prices can reduce inflation fears and ease pressure on global growth, encouraging traders to move away from defensive assets like the U.S. dollar.
If oil resumes its upward trend, safe-haven demand for the dollar could return quickly.
Central Banks Take Centre Stage
Markets are now firmly focused on a series of central bank meetings, starting with the Federal Reserve, followed by the European Central Bank, Bank of England, and Bank of Japan.
All are widely expected to keep interest rates unchanged, but traders will be closely watching for forward guidance, particularly regarding inflation and growth risks stemming from the ongoing Middle East conflict.
The key question for policymakers is whether the energy shock will primarily slow economic activity or lead to more persistent inflation.
A more hawkish tone from central banks could limit further dollar weakness, while a cautious or balanced outlook may support risk assets and weigh on the greenback.
Technical Analysis
The US Dollar Index (USDX) is trading near 99.26, marginally lower on the session (-0.03%), as the recent recovery rally begins to lose momentum just below the psychological 100 level. After rebounding strongly from the 95.33 low, the dollar has entered a phase of consolidation, suggesting the market is reassessing directional conviction.
From a technical standpoint, short-term momentum is starting to soften. The 5-day moving average (99.52) has begun to turn lower, while the 10-day (99.17) sits just beneath current price, acting as near-term support.
The 20-day (98.58) and 30-day (98.08) remain upward sloping, indicating that the broader recovery structure is still intact despite the current pause.
Immediate support is seen around 99.00–99.10, with a break below this zone potentially exposing downside toward 98.50, where the 20-day average aligns.
On the upside, resistance is firmly positioned at 100.30–100.70, a region that has repeatedly capped bullish attempts and remains a key barrier for further upside continuation.
Overall, the USDX appears to be consolidating below major resistance, with the broader bias still constructive following its recovery from February lows.
However, failure to reclaim the 100 level may lead to further sideways movement or a modest pullback, especially if macro catalysts—such as shifting rate expectations—begin to weigh on dollar strength.
What Traders Should Watch Next
The dollar now sits at a crossroads between geopolitical risk and improving sentiment. Key drivers to monitor include:
Movements in oil prices, particularly whether Brent holds above $100
Outcomes and guidance from major central bank meetings
Developments in the Middle East conflict
Currency moves in USDJPY and EURUSD
For now, the dollar’s pullback appears to be a reaction to easing oil prices rather than a full reversal, with broader trends still dependent on how geopolitical and macroeconomic risks evolve.
The US dollar is weakening because oil prices have eased, reducing safe-haven demand and allowing investors to shift back into risk assets ahead of central bank decisions.
What is Causing USD Weakness Right Now?
A combination of lower oil prices, improved market sentiment, and positioning ahead of central bank meetings is putting short-term pressure on the dollar.
Is the Dollar Still in an Uptrend?
Yes, the broader trend remains supported by geopolitical risks and earlier safe-haven demand. However, the current pullback suggests a short-term correction or consolidation phase.
How Do Oil Prices Affect the US Dollar?
Rising oil prices tend to support the dollar due to its safe-haven status and the U.S. being a net energy exporter. When oil falls, this support weakens, and the dollar can decline.
Why is the Yen Strengthening Against the Dollar?
The yen is gaining as risk sentiment improves and as USDJPY moves away from the 160 level, where markets had expected potential intervention from Japanese authorities.
Why is the Euro Rising Against the Dollar?
The euro is strengthening ahead of the European Central Bank meeting, as traders position for policy guidance and potential shifts in inflation outlook.
What Are Markets Expecting From the Federal Reserve?
Markets widely expect the Federal Reserve to keep interest rates unchanged, but are focused on forward guidance regarding inflation and future rate cuts.
Start trading now – Click here to create your real VT Markets account
Written on March 17, 2026 at 11:44 pm, by josephine
China’s digital yuan is evolving beyond payments into a core financial asset.
Digital Yuan 2.0 integrates with banking systems and offers deposit-like features.
Cross-border settlement via mBridge reduces reliance on the US dollar.
Global CBDC development is accelerating in response to China’s progress.
The FX market is shifting toward a more decentralised, multi-currency structure.
The Rise of the Digital Yuan
China’s digital yuan (e-CNY) remains the world’s most advanced large-economy central bank digital currency, having transitioned in 2026 from a retail pilot to a core pillar of the national financial system. By early 2026, cumulative transactions had surged to over RMB 16.7 trillion (≈US$2.3 trillion), with the currency now integrated into the deposit insurance system and supporting high-value cross-border trade through the mBridge platform.
If payment infrastructure remained in private hands, the system could become too large to fail while lacking transparency. The digital yuan emerged as a strategic response, allowing the state to reclaim control over the financial backbone.
Since pilot programmes began in 2019, adoption has expanded rapidly. Today, the digital yuan is widely used across China for daily transactions.
But its significance goes far beyond payments. Its rise signals a structural shift in the global foreign exchange system, with implications for trade, capital flows, and monetary sovereignty.
Digital Yuan Adoption Progress (Official PBOC Data)
Digital Yuan 2.0: From Payment Tool to Financial Asset
The transition from Digital Yuan 1.0 to 2.0 marks a fundamental shift in its role.
Previously, it functioned as digital cash. Now, under new regulations introduced in 2026, it has evolved into a hybrid monetary instrument that combines characteristics of deposits and currency.
Key changes include:
Integration into commercial bank balance sheets and reserve systems
Legal protection equivalent to traditional bank deposits
Ability for verified wallets to earn interest similar to demand deposits
This transformation blurs the line between bank accounts and digital wallets. Users can spend directly without manual top-ups, while individuals without bank accounts can still participate in the financial system through wallet-based access.
The addition of programmability introduces another layer of control. Funds can carry conditions through smart contracts, enabling targeted spending, improved compliance, and automated financial flows.
At the same time, the development of mBridge has extended the digital yuan into cross-border settlement, allowing it to move beyond domestic payments into global trade infrastructure.
A New Cross-Border Settlement System
The global financial system remains heavily anchored to the US dollar and the legacy SWIFT network. While effective, this structure creates friction, including multi-day settlement delays, intermediary costs, and geopolitical vulnerabilities where financial access can be restricted.
China’s response has not been to replace SWIFT directly, but to develop a parallel infrastructure. Through mBridge, a multi-CBDC platform built with the BIS Innovation Hub, participating central banks can settle transactions peer-to-peer on a shared ledger, enabling real-time cross-border payments without relying on correspondent banking networks.
By the end of 2025, digital yuan transactions had surpassed US$2.3 trillion, while mBridge processed more than 4,000 cross-border transactions worth over US$55 billion. The digital yuan accounted for roughly 95% of activity, highlighting its central role in the system.
The significance of this development lies in its ability to enable direct settlement between local currencies, removing the need to convert through a vehicle currency such as the US dollar. This reduces settlement costs and dramatically increases transaction speed.
For global markets, this shift signals the emergence of a more multi-channel financial architecture, where cross-border capital flows can operate through networks that are increasingly independent of traditional Western-led systems.
A Catalyst for Global Monetary Change
The rise of the digital yuan is accelerating the global race toward central bank digital currencies.
Countries such as India, Brazil, and the Bahamas are already operational
The EU and UK are progressing through regulatory and technical phases
The United States is focusing on regulating private stablecoins instead of issuing a CBDC
While stablecoins still dominate digital transactions, they lack sovereign backing and deposit protection. This creates a structural difference between privately issued digital dollars and state-backed currencies like the digital yuan.
As more countries adopt CBDCs, cross-border financial systems are likely to become cheaper, faster, and more transparent, gradually reducing reliance on the dollar in certain sectors.
mBridge Performance
Feature
Legacy SWIFT System
Project mBridge (MVP 2025)
Total Settlement Volume
N/A
$55.49 Billion
Transaction Count
N/A
4,047 High-Value Trades
e-CNY Share of Volume
0%
95.30%
Settlement Time
2–5 Days
Real-time (Seconds)
Primary Use Cases
General Banking
Energy & Commodities
Source: Atlantic Council / BIS Innovation Hub / PYMNTS (Jan 2026).
Over time, these features could reshape parts of the FX market, especially in commodity trade, regional partnerships, and emerging market transactions.
The long-term outcome is likely a multi-currency system, where efficiency and political alignment determine usage rather than legacy dominance alone.
Not in the near term. The dollar remains dominant, but the digital yuan introduces an alternative system that reduces reliance over time.
Why is mBridge important?
It allows direct cross-border settlement without using the dollar, lowering costs and improving efficiency.
How is Digital Yuan 2.0 different?
It functions more like a bank deposit than cash, offering interest, legal protection, and integration into the banking system.
Why are other countries developing CBDCs?
China’s progress is accelerating global competition, pushing countries to modernise their monetary systems.
What is the biggest impact on FX markets?
The shift toward faster, cheaper, and decentralised settlement systems that reduce reliance on traditional intermediaries.
What is the difference between Digital Yuan 1.0 and 2.0?
The transition to Digital Yuan 2.0 in 2026 marks its evolution from a simple retail payment tool into a core financial asset. While version 1.0 functioned as digital cash, 2.0 is integrated into commercial bank balance sheets and reserve systems, offering legal protections and interest-bearing features similar to traditional demand deposits.
How does mBridge reduce reliance on the US Dollar?
mBridge enables direct, peer-to-peer cross-border settlement between participating central banks without the need for an intermediary currency like the US dollar. Bypassing the traditional SWIFT network, it reduces settlement costs, increases transaction speeds, and limits the effectiveness of international financial sanctions.
Is the Digital Yuan a threat to global monetary sovereignty?
The e-CNY introduces a parallel financial infrastructure that allows for decentralised, multi-currency trade. While it does not replace the dollar overnight, it provides an alternative for commodity trade and emerging markets, allowing nations to settle transactions based on political alignment and efficiency rather than legacy dominance.
What are the benefits of “Programmable Money” in FX markets?
The digital yuan uses smart contracts to add a layer of programmability to financial flows. This allows for targeted spending and automated compliance, ensuring that funds are used for their intended purpose and reducing the risks associated with manual settlement and currency conversion.
What is the current adoption rate of the Digital Yuan in 2026?
By early 2026, the digital yuan became the world’s most advanced large-economy CBDC, with cumulative transactions surging over RMB 16.7 trillion (approx. US$2.3 trillion).
Start trading now – Click here to create your real VT Markets account
Written on March 17, 2026 at 9:47 pm, by josephine
WTI crude trades near 93.83, down -1.398 (-1.47%), as oil pauses after a sharp rally.
Brent crude slips to $102.28, offering temporary relief to global equity markets.
Markets now turn to the Federal Reserve decision, with risks of a more hawkish outlook amid persistent inflation pressures.
Oil prices pulled back slightly on Wednesday, offering a brief reprieve to global markets after a period of intense volatility driven by escalating tensions in the Middle East.
WTI crude is trading at 93.83, down -1.47%, while Brent crude eased 1% to $102.28 per barrel. The decline reflects a temporary pause rather than a structural shift, as underlying supply risks remain firmly in place.
Despite the pullback, the broader narrative has not changed. The Strait of Hormuz remains largely shut, and geopolitical tensions continue to disrupt energy flows, keeping markets on edge.
The Strait of Hormuz remains effectively shut with no real conclusion to the Iran war in sight. What does this mean for trade and foreign policy?
If disruptions persist, oil prices may resume their upward trajectory after this consolidation phase.
Geopolitical Escalation Keeps Supply Tight
The latest developments in the Middle East continue to reinforce supply concerns. Israel has intensified its military actions, while Iran has renewed strikes on oil infrastructure in the United Arab Emirates.
At the same time, signals from Iranian leadership suggest no near-term de-escalation, increasing the likelihood of a prolonged disruption to global energy markets.
Iran has stepped up attacks on Saudi Arabia in recent days, signaling it’s targeting the oil-rich kingdom more aggressively than earlier in the war https://t.co/1ygjEMiht7
The Strait of Hormuz, a critical artery for global oil shipments, remains a key focal point. Any sustained closure or restriction of traffic through the strait could tighten supply conditions significantly.
According to JPMorgan, the current stability in oil prices may reflect temporary buffers such as regional inventories and policy interventions. However, if the strait remains constrained, markets may need to reprice oil higher as global inventories are drawn down.
Focus Shifts to Federal Reserve Outlook
With oil volatility dominating recent market moves, attention has now turned to the Federal Reserve’s policy decision, which is expected later in the day.
The Fed is widely expected to keep interest rates unchanged, but the key focus will be on updated economic projections and the “dot plot,” which could signal fewer or no rate cuts in the near term.
The Fed issues its latest interest rate decision Wednesday. Here's what to expect https://t.co/iCgRzS9EFN
Markets are particularly sensitive to how policymakers interpret the oil shock. The key question is whether it will primarily slow economic growth or drive persistent inflation.
Analysts warn that if the Fed leans toward the inflation narrative, it could adopt a more hawkish stance, reinforcing higher interest rates for longer.
A hawkish shift in Fed expectations could strengthen the dollar and weigh on commodities, including oil, in the near term.
Technical Outlook
Crude oil (CL-OIL) is trading around $93.83, down roughly 1.47% on the session, as the market pauses following an aggressive rally that pushed prices to a recent high near $119.43.
The pullback appears corrective rather than structural at this stage, with price action still well-supported above prior breakout levels.
Technically, the trend remains firmly bullish despite the near-term retracement. Price is holding above the 10-day moving average (90.56) and well above the 20-day (79.55) and 30-day (74.23), indicating that the broader uptrend remains intact.
The 5-day moving average (95.15) is now starting to flatten and roll slightly lower, reflecting short-term exhaustion after the sharp vertical move.
In terms of key levels, immediate support is seen around $90–91, aligning with the 10-day average and recent consolidation.
A deeper pullback could test $87–88, where prior breakout structure sits. On the upside, resistance remains near $100–105, followed by the spike high at $119.43, which now acts as a major technical ceiling.
Overall, oil appears to be entering a consolidation phase after a parabolic rally, with momentum cooling but the underlying trend still supported by elevated risk premiums.
As long as prices hold above the $90 region, the bullish structure remains valid, though further sideways movement or short-term pullbacks are likely before any attempt to retest recent highs.
What Traders Should Watch Next
Markets remain highly sensitive to both geopolitical and policy developments. Traders should monitor:
Updates on the Strait of Hormuz and Middle East conflict
The Federal Reserve decision and forward guidance
Whether oil can hold above the 90–95 range
Signs of renewed supply disruption or inventory drawdowns
For now, oil’s pullback appears to be a pause rather than a reversal, with geopolitical risks still firmly anchoring the market’s upside bias.
Learn more about trading Energies on VT Markets here.
Frequently Asked Questions
Why Did Oil Prices Pull Back After Rallying? Oil prices eased as markets paused after a sharp rally driven by geopolitical tensions. The pullback reflects short-term profit-taking and temporary stability rather than a shift in the broader bullish trend.
Where is Oil Trading Right Now? WTI crude is trading around 93.83, down -1.47%, while Brent crude has slipped to $102.28 per barrel.
Is the Oil Rally Over? Not necessarily. The broader trend remains supported by supply risks, particularly with disruptions linked to the Middle East conflict and restricted flows through the Strait of Hormuz.
Why is the Strait of Hormuz So Important? The Strait of Hormuz is a key global energy route, handling roughly 20% of the world’s oil shipments. Any disruption can significantly tighten global supply and push prices higher.
How Are Geopolitical Tensions Affecting Oil? Escalating conflict, including attacks on energy infrastructure, increases uncertainty and raises the risk of supply disruptions, which tends to support higher oil prices.
Start trading now – Click here to create your real VT Markets account
Written on March 17, 2026 at 7:03 pm, by josephine
Please note that the dividends of the following products will be adjusted accordingly. Index dividends will be executed separately through a balance statement directly to your trading account, and the comment will be in the following format “Div & Product Name & Net Volume”.
Please refer to the table below for more details:
The above data is for reference only, please refer to the MT4/MT5 software for specific data.
If you’d like more information, please don’t hesitate to contact info@vtmarkets.com.
To ensure fair trading conditions and manage market volatility during major economic announcements, VT Markets will apply temporary leverage adjustments on certain trading products during specific news periods and market opening/closing.
This mechanism will be introduced in phases starting from 19 March 2026, with full implementation across all servers and clients by 20 March 2026.
These adjustments are designed to protect clients from abnormal market fluctuations, sudden liquidity changes, and extreme price movements that may occur during high-impact news releases.
1. Products Affected
The temporary leverage adjustment may apply to the following products:
• Forex
• Gold
• Silver
• Oil
• Indices
• Commodities (including XPT and XPD)
2. Adjusted Leverage During News Releases and Market Opening/Closing
During the specified news period, maximum leverage will be adjusted as follows:
Forex: 200
Gold: 200
Silver: 50
Oil: 20
Indices: 50
Commodities: 5
Please note that each product with leverage already below the above will not be affected.
3. News Events That Can Trigger the Adjustment
Leverage adjustments may be applied during major economic announcements including:
• FOMC Interest Rate Decisions
• CPI (Consumer Price Index)
• GDP
• PMI / NMI
• PPI
• Retail Sales
• Non-Farm Payroll (NFP)
• ADP Employment Data
• Crude Oil Inventories
The above data is for reference only. Other significant macroeconomic releases from major economies may also be included.
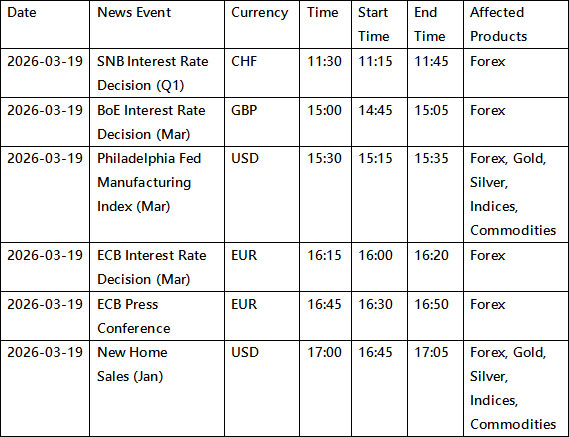
Please refer to the table below for details of the upcoming events and affected instruments:
All dates and times are stated in GMT+3 (MT4/MT5 server time).
4. Affected Period of News Releases and Market Opening/Closing
Temporary leverage adjustments apply during the following periods: Economic News Period
• 15 minutes before the announcement
• 5 minutes after the announcement Market Opening / Closing Period
• 3 hours before the weekly market closing (Friday)
• 30 minutes after market reopening (Monday)
• 30 minutes before daily market closing (Monday – Thursday)
After the above period ends, leverage will automatically return to the original leverage.
5. Important Rules
• The adjustment only affects new positions open during the adjustment period.
• Positions opened before the adjustment period will not be affected.
• Once the adjustment period ends, original leverage will resume automatically.
6. Example Scenarios
Example 1 – Position Opened Before the Adjustment Period
A client opens a Gold position at $3,000 before the news period.
Account leverage: 1:500
Margin required:
3000 × 100 ÷ 500 = $600
Since the position was opened before the news period, the leverage remains unchanged.
Example 2 – Position Opened During the News Period
A client opens a Gold position during the news period.
Leverage is temporarily reduced from 1:500 to 1:200
Margin required:
3000 × 100 ÷ 200 = $1500
Once the news period ends, the leverage setting will revert to the original level.
Example 3 – Product With Lower Default Leverage
A client trades an index product with leverage 1:20.
Since the leverage is already below 1:50, the news-period adjustment does not apply, and margin requirements remain unchanged.
We strongly encourage clients to take these temporary leverage adjustments into account when planning trading strategies during high-impact economic events.
If you have any questions, please contact our support team: info@vtmarkets.com
AUDUSD climbed to around 0.7088, extending gains after a 1.3% rally overnight.
The RBA raised rates to 4.10%, with a narrow 5–4 split vote, signalling ongoing inflation concerns.
Markets now price a 40% chance of another hike in May, with 4.35% expected by August.
The Australian dollar pushed higher on Tuesday, building on recent momentum as markets reacted to a more hawkish-than-expected tone from the Reserve Bank of Australia.
AUDUSD rose toward 0.7088, adding to a strong rally from the previous session, as traders reassessed the path of interest rates following the RBA’s latest policy decision.
Australia’s central bank raised its key interest rate for a second straight meeting on Tuesday, stepping up its battle against stubborn inflation https://t.co/luLi5ZrJ76
While the central bank’s 25 basis point hike to 4.10% was widely expected, the reaction was driven by forward guidance rather than the move itself. The decision revealed a narrow 5–4 split, highlighting growing urgency among policymakers to address persistent inflation.
Hawkish Messaging Supports the Currency
RBA Governor Michele Bullock emphasised that the disagreement within the board was not about direction, but timing. The key question was whether to raise rates immediately or wait until May.
This distinction reinforced expectations that further tightening remains likely, especially with inflation still running above target. Core inflation at 3.4% continues to exceed the RBA’s 2%–3% target band, keeping pressure on policymakers to act.
Australia’s central bank is set to deliver back-to-back interest-rate increases on Tuesday driven by the war in Iran and a deterioration in the economy’s supply of workers, according to James McIntyre at Bloomberg Economics https://t.co/oH4HZHtyq8
Markets responded quickly. The probability of a May rate hike increased to 40%, up from 25%, while a move to 4.35% is now fully priced by August.
If inflation remains sticky, AUDUSD may stay supported. However, any signs of easing price pressures could temper expectations for further hikes and cap upside.
Yield Differentials Add Support
The Australian dollar is also benefiting from supportive yield dynamics. Australian 10-year bond yields are holding near 4.961%, having recently tested the 5.0% level, the highest since mid-2011.
The spread between Australian and U.S. yields has widened to 72 basis points, making Australian assets more attractive to global traders and supporting capital inflows into the currency.
This yield advantage is a key pillar for AUD strength, particularly in a global environment where central banks are reassessing their policy stance.
Technical Analysis
The AUDUSD pair is trading near 0.7067, holding relatively steady despite a slight intraday dip of around 0.05%. Price action suggests the pair is entering a consolidation phase after a sustained uptrend that began in late December, where it rallied from lows near 0.6421 to a recent high of 0.7187.
From a technical perspective, the short-term structure remains supported but is beginning to lose momentum. The 5-day (0.7070) and 10-day (0.7065) moving averages are tightly clustered around the current price, indicating a lack of directional conviction. Meanwhile, the 20-day (0.7071) and 30-day (0.7066) averages are also converging, reinforcing the view that the market is compressing and preparing for a potential breakout.
Immediate support is seen around the 0.7040–0.7050 region, where recent pullbacks have stabilised. A break below this zone could open the door toward 0.7000, a key psychological level. On the upside, resistance remains at 0.7180–0.7200, marking the recent swing high and a barrier that bulls have yet to decisively clear.
Overall, AUDUSD appears to be range-bound in the near term, with the broader bullish structure still intact as long as price holds above 0.7000.
However, the current compression in moving averages suggests that a decisive breakout—either higher or lower—may be approaching, depending on macro catalysts such as US dollar strength or shifts in risk sentiment.
What Traders Should Watch Next
The near-term direction for AUDUSD will likely depend on whether markets continue to price in further RBA tightening.
Key catalysts include upcoming inflation data, RBA commentary, and shifts in global risk sentiment. Traders will also monitor whether the pair can sustain momentum above the 0.7080 area and challenge the 0.7122 resistance level.
For now, the Australian dollar appears supported by a combination of hawkish policy expectations, strong yields, and resilient technical structure, though global uncertainties remain a key risk to the outlook.
Why is AUDUSD Rising Right Now? The Australian dollar is gaining strength after the Reserve Bank of Australia (RBA) delivered a rate hike and signalled that further tightening remains likely due to persistent inflation risks.
What Did the RBA Decide at Its Latest Meeting? The RBA raised its cash rate by 25 basis points to 4.10%, reaching a 10-month high. The decision was closely contested, with a 5–4 split vote among policymakers.
Why Did Markets View the RBA as Hawkish? Governor Michele Bullock indicated the debate was about timing rather than direction, suggesting further rate hikes are still on the table if inflation does not return to target.
What Are Markets Pricing for Future RBA Policy? Markets have increased expectations for another rate hike, with around a 40% probability of a move in May, and a rate of 4.35% fully priced by August.
How is Inflation Affecting the Australian Dollar? Core inflation remains elevated at 3.4%, above the RBA’s target range of 2% to 3%. Persistent inflation supports a hawkish policy outlook, which tends to strengthen the currency.
Start trading now – Click here to create your real VT Markets account
Written on March 16, 2026 at 10:22 pm, by josephine
Nikkei 225 rose 0.3% in broader market trading, even as the chart shows 54,053.15, down 368.00 (-0.68%) on the session snapshot.
Brent crude climbed 2.7% to $102.89 per barrel, keeping pressure on Japan as a major energy importer.
The yen weakened 0.2% to 159.415 per dollar, staying close to the 160 level despite official verbal warnings.
The Nikkei 225 is trying to recover, but the backdrop remains difficult. Broader Asian equities moved higher on Tuesday, and Japan’s Nikkei 225 rose 0.3% as traders pushed for a second day of gains. Still, the wider tone remains cautious as markets try to price the economic damage from the US-Iran war and the policy response it may trigger.
Japan’s defense minister said the US hadn’t made a specific demand to send ships to the Middle East, following media reports that Tokyo has started to explore that possibility ahead of Takaichi’s summit with Trump this week https://t.co/nsFshGSVFW
This is not a clean risk-on move. Chris Weston of Pepperstone said the rally still feels like a positioning squeeze rather than the start of a fresh directional trend. That fits the Nikkei well. The index is trying to bounce, but traders still face high oil prices, a weak yen, and a packed week of central bank meetings.
If global risk sentiment improves and oil stops climbing, the Nikkei may extend its rebound. If energy prices stay high and markets keep doubting the bounce, upside may remain limited.
Oil Above $100 Keeps Pressure on Japan
For the Nikkei, oil is one of the biggest macro risks. Brent crude rose 2.7% to $102.89 a barrel after several US allies rejected calls to send warships to escort tankers through the Strait of Hormuz. Since about one-fifth of global energy shipments move through that route, any prolonged disruption matters.
A policy hold by the Bank of Japan this week is a foregone conclusion for most economists, but the deliberations will still be highly significant as authorities start to mull whether surging oil prices might warrant preemptive action https://t.co/6ISoQ3V6Zc
Japan is highly exposed to higher imported energy costs. That can hurt margins for manufacturers, transport firms, and consumer-facing businesses. It can also weigh on household spending if energy bills rise.
This is why the Nikkei can lag even when some global markets recover. Higher oil is not just an inflation story for Japan. It is also a growth headwind.
If Brent stays above $100, the Nikkei may continue to face pressure from weaker earnings expectations and tighter financial conditions.
Yen Near 160 Adds Another Layer of Stress
The currency picture also matters. The Japanese yen weakened 0.2% to 159.415 per dollar, staying just shy of the 160 level despite verbal warnings from Japanese authorities.
A weaker yen can help exporters in normal times, but this situation is less straightforward. When oil prices are high, the weaker currency also makes imported energy more expensive. That weakens one of the Nikkei’s usual supports from yen depreciation.
Bank of Japan Governor Kazuo Ueda said underlying inflation was gradually accelerating toward the bank’s 2% target. Even so, analysts expect the bar for intervention to be higher because of rising oil prices. That leaves the market in a difficult spot, where the yen stays weak while inflation risks rise.
If USDJPY pushes closer to 160, volatility in Japanese equities may increase, especially if traders start to question whether authorities will step in.
Central Bank Week Could Drive the Next Nikkei Move
This week’s central bank calendar is packed, and that matters for the Nikkei. The Reserve Bank of Australia was first up, with economists expecting a second hike this year to 4.1%. After that, attention turns to the Federal Reserve, European Central Bank, Bank of England, and Bank of Japan.
The Fed funds market shows a 99.1% probability that the Federal Reserve will remain on hold at the end of its two-day meeting on Wednesday. That suggests traders expect caution rather than a strong policy shift.
This month’s surge in oil prices and the market’s move to ratchet back expectations for Federal Reserve policy easing have generated a $10 million profit for one options bet in short-term interest rates https://t.co/pDFGfMzi1a
For Japanese equities, the issue is not just what the BoJ says. It is how all major central banks respond to an energy shock that could lift inflation and slow growth at the same time. If policymakers turn more hawkish, equities may struggle. If they sound calm and patient, the Nikkei may find some relief.
If central banks emphasise inflation risk over growth concerns, the Nikkei may remain under pressure. If they signal patience and avoid hawkish surprises, the index may stabilise.
Nikkei 225 Technical Outlook
The Nikkei 225 is trading near 54,053, down roughly 0.68% on the session as the index continues to struggle after failing to hold above the 60,077 peak reached earlier in the quarter. The recent pullback suggests the market remains in a corrective phase following the strong rally seen earlier in the year.
Technically, the index remains below several key moving averages. The 5-day moving average (53,977) is close to the current price but flattening, while the 10-day (54,392) sits slightly above the market and continues to trend lower. Meanwhile, the 20-day moving average (56,020) and 30-day (56,228) remain significantly above current levels, reinforcing the near-term bearish pressure as the index trades beneath this cluster of resistance.
Immediate support appears around the 53,800–54,000 region, where prices are currently attempting to stabilise. A break below this area could expose further downside toward 52,500–53,000, where previous buying interest has emerged. On the upside, initial resistance is located near 54,400, followed by stronger resistance around 56,000, where the 20-day moving average sits.
Overall, the Nikkei appears to be consolidating after the sharp rejection near 60,000, with the broader trend turning cautious in the short term. Unless the index can reclaim the 54,400–56,000 region, momentum may remain limited, leaving the market vulnerable to further downside consolidation before a clearer directional move develops.
What Traders Should Watch Next
The Nikkei now sits at the intersection of three major forces: oil above $100, USDJPY near 160, and central banks trying to respond to a war-driven inflation shock without overreacting.
That makes the next move less about one headline and more about whether all three start easing at once. If oil cools, the yen stabilises, and central banks avoid a hawkish tilt, the Nikkei may recover further. If those pressures stay in place, the index may keep trading with a fragile tone.
What is Driving the Nikkei 225 Right Now? The Nikkei 225 is being driven by a mix of rising oil prices, a weaker yen, and global central bank expectations, all of which are shaping investor sentiment.
Why Does Higher Oil Pressure the Nikkei? Japan is a major energy importer. When oil prices rise above $100 per barrel, it increases costs for businesses and consumers, which can weigh on corporate earnings and economic growth.
How Does a Weak Yen Affect the Nikkei? A weaker yen can support exporters by making Japanese goods cheaper overseas. However, when oil prices are high, it also increases import costs, which can offset those benefits.
Why is USDJPY Near 160 Important? The 160 level is seen as a key psychological threshold. If the yen weakens further, it could increase volatility and raise the risk of intervention from Japanese authorities.
What Role Do Central Banks Play in the Nikkei’s Outlook? Global central bank decisions influence liquidity, interest rates, and risk appetite. A more hawkish stance could pressure equities, while a cautious or neutral tone may support the Nikkei.
Start trading now – Click here to create your real VT Markets account
Written on March 16, 2026 at 7:35 pm, by josephine