Back

Gold trading strategies for beginners

A Gold Trading Guide For Beginners

For centuries, gold has captivated humanity with its lustrous allure and enduring value. From ancient civilisations to modern economies, this precious metal has retained its status as a symbol of wealth and stability. Today, gold isn’t just for kings and central banks – it’s an accessible and potentially lucrative market for traders like you.

In this guide, we’ll unlock the secrets of gold trading, exploring its unique role in the financial world and providing you with practical strategies to navigate this market. Whether you’re looking to diversify your portfolio, hedge against economic uncertainty, or simply try your hand at a fascinating form of trading, this article will equip you with the knowledge you need to get started.
The benefits of gold trading

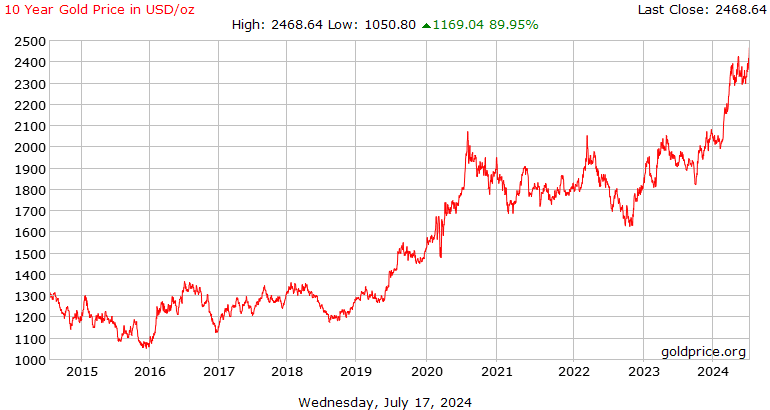
Gold’s journey from ancient currency to modern financial powerhouse is a testament to its enduring appeal. Throughout history, gold has served as a reliable store of value, often shining brightest during times of economic turmoil. Today, it continues to play a crucial role in global finance, offering unique benefits to traders and investors alike.

One of gold’s most attractive features is its ability to hedge against inflation. As the purchasing power of paper currencies erodes over time, gold often retains its value, making it a popular choice for those looking to protect their wealth from the ravages of rising prices.

Gold also acts as a safe haven asset during periods of economic or geopolitical uncertainty. When stock markets tumble or geopolitical tensions rise, investors often flock to gold, driving up its price and potentially providing profits for savvy traders.

For portfolio managers and individual investors alike, gold offers valuable diversification benefits. Its price movements often have a low or negative correlation with other asset classes like stocks and bonds, potentially reducing overall portfolio risk.

Forms of gold trading

The good news for aspiring gold traders is that you don’t need a vault to get started. There are several ways to gain exposure to gold prices:

1. Physical gold: This includes coins, bars, and jewellery. While owning tangible gold can be satisfying, it comes with storage and security concerns.

2. Gold ETFs: Exchange-traded funds offer an easy way to track gold prices without the hassle of physical ownership. They’re traded like stocks and typically have lower fees than many other gold investments.

3. Gold stocks: Investing in gold mining companies can provide indirect exposure to gold prices. However, these stocks are also influenced by company-specific factors and broader market trends.

4. Gold futures and options: These derivative products are typically used by more experienced traders due to their complexity and higher risk profile.

Understanding gold price movements

To trade gold effectively, you need to understand what drives its price. Several key factors come into play:

1. Interest rates: When interest rates are low, the opportunity cost of holding non-yielding gold decreases, often boosting its price.

2. Inflation: Rising inflation often drives investors towards gold as a store of value.

3. Economic growth: Slow growth or recessions can increase gold’s appeal as a safe haven.

4. Geopolitical events: International conflicts or political instability can spark a flight to safety, benefiting gold.

5. Supply and demand: Changes in gold production or consumption can impact prices, though usually to a lesser extent than the above factors.

For advanced traders, technical analysis can provide insights into short-term price movements. Concepts like trend lines, support and resistance levels, and moving averages can help identify potential entry and exit points for trades.

Gold trading strategies

As a non-professional trader, it’s best to start with straightforward strategies:

1. Buy-and-hold: This long-term approach involves purchasing gold and holding it for an extended period. It’s simple and can be effective, but may not capitalise on short-term price movements. Ideal for patient investors with a long-term outlook.

2. Swing trading: This strategy aims to capture medium-term trends in gold prices. Traders might hold positions for days or weeks, trying to profit from price swings. It requires more active market monitoring and basic technical analysis skills.

3. Dollar-cost averaging (DCA): With this approach, you invest a fixed amount in gold at regular intervals, regardless of price. This can help smooth out the impact of price volatility over time. It’s great for risk-averse investors or those with regular income to invest.

4. Value investing: This involves buying gold when you believe it’s undervalued, with the expectation that its price will eventually rise to its “true” value. It requires patience and some skill in fundamental analysis to determine when gold might be undervalued.

Each strategy has its own risk-reward profile, so choose one that aligns with your goals, available time, and risk tolerance. Consider starting with a demo account to practice before risking real money.

Practical tips for successful gold trading

1. Do your homework: Stay informed about economic indicators, geopolitical events, and gold market analysis from reputable sources.

2. Learn basic technical analysis: Understanding how to read price charts and interpret simple indicators can enhance your trading decisions.

3. Practice risk management: Always use stop-loss orders to limit potential losses, and never risk more than you can afford to lose on a single trade.

4. Master your emotions: Fear and greed can lead to poor decisions. Develop a trading plan and stick to it, regardless of short-term market movements.

5. Start small: Begin with a small amount of capital as you learn the ropes of gold trading.

In conclusion, gold trading offers a unique opportunity for traders. By understanding gold’s role in the economy, learning basic strategies, and avoiding common pitfalls, you can embark on this exciting journey.

For beginners, platforms like VT Markets provide an excellent starting point. With user-friendly tools, educational resources, and gold CFD trading options, it’s ideal for newcomers. The demo account feature allows you to practice risk-free before committing real funds. Remember, successful trading develops over time. Start small, keep learning, and utilise demo accounts to hone your skills. With persistence, gold trading could become a valuable addition to your financial toolkit.

Gold trading strategies for beginners

For centuries, gold has captivated humanity with its lustrous allure and enduring value. From ancient civilisations to modern economies, this precious metal has retained its status as a symbol of wealth and stability. Today, gold isn’t just for kings and central banks – it’s an accessible and potentially lucrative market for traders like you.

In this guide, we’ll unlock the secrets of gold trading, exploring its unique role in the financial world and providing you with practical strategies to navigate this market. Whether you’re looking to diversify your portfolio, hedge against economic uncertainty, or simply try your hand at a fascinating form of trading, this article will equip you with the knowledge you need to get started.

The benefits of gold trading

Gold’s journey from ancient currency to modern financial powerhouse is a testament to its enduring appeal. Throughout history, gold has served as a reliable store of value, often shining brightest during times of economic turmoil. Today, it continues to play a crucial role in global finance, offering unique benefits to traders and investors alike.

One of gold’s most attractive features is its ability to hedge against inflation. As the purchasing power of paper currencies erodes over time, gold often retains its value, making it a popular choice for those looking to protect their wealth from the ravages of rising prices.

Gold also acts as a safe haven asset during periods of economic or geopolitical uncertainty. When stock markets tumble or geopolitical tensions rise, investors often flock to gold, driving up its price and potentially providing profits for savvy traders.

For portfolio managers and individual investors alike, gold offers valuable diversification benefits. Its price movements often have a low or negative correlation with other asset classes like stocks and bonds, potentially reducing overall portfolio risk.

Forms of gold trading

The good news for aspiring gold traders is that you don’t need a vault to get started. There are several ways to gain exposure to gold prices:

1. Physical gold: This includes coins, bars, and jewellery. While owning tangible gold can be satisfying, it comes with storage and security concerns.

2. Gold ETFs: Exchange-traded funds offer an easy way to track gold prices without the hassle of physical ownership. They’re traded like stocks and typically have lower fees than many other gold investments.

3. Gold stocks: Investing in gold mining companies can provide indirect exposure to gold prices. However, these stocks are also influenced by company-specific factors and broader market trends.

4. Gold futures and options: These derivative products are typically used by more experienced traders due to their complexity and higher risk profile.

Understanding gold price movements

To trade gold effectively, you need to understand what drives its price. Several key factors come into play:

1. Interest rates: When interest rates are low, the opportunity cost of holding non-yielding gold decreases, often boosting its price.

2. Inflation: Rising inflation often drives investors towards gold as a store of value.

3. Economic growth: Slow growth or recessions can increase gold’s appeal as a safe haven.

4. Geopolitical events: International conflicts or political instability can spark a flight to safety, benefiting gold.

5. Supply and demand: Changes in gold production or consumption can impact prices, though usually to a lesser extent than the above factors.

For advanced traders, technical analysis can provide insights into short-term price movements. Concepts like trend lines, support and resistance levels, and moving averages can help identify potential entry and exit points for trades.

Gold trading strategies

As a non-professional trader, it’s best to start with straightforward strategies:

1. Buy-and-hold: This long-term approach involves purchasing gold and holding it for an extended period. It’s simple and can be effective, but may not capitalise on short-term price movements. Ideal for patient investors with a long-term outlook.

2. Swing trading: This strategy aims to capture medium-term trends in gold prices. Traders might hold positions for days or weeks, trying to profit from price swings. It requires more active market monitoring and basic technical analysis skills.

3. Dollar-cost averaging (DCA): With this approach, you invest a fixed amount in gold at regular intervals, regardless of price. This can help smooth out the impact of price volatility over time. It’s great for risk-averse investors or those with regular income to invest.

4. Value investing: This involves buying gold when you believe it’s undervalued, with the expectation that its price will eventually rise to its “true” value. It requires patience and some skill in fundamental analysis to determine when gold might be undervalued.

Each strategy has its own risk-reward profile, so choose one that aligns with your goals, available time, and risk tolerance. Consider starting with a demo account to practice before risking real money.

Practical tips for successful gold trading

1. Do your homework: Stay informed about economic indicators, geopolitical events, and gold market analysis from reputable sources.

2. Learn basic technical analysis: Understanding how to read price charts and interpret simple indicators can enhance your trading decisions.

3. Practice risk management: Always use stop-loss orders to limit potential losses, and never risk more than you can afford to lose on a single trade.

4. Master your emotions: Fear and greed can lead to poor decisions. Develop a trading plan and stick to it, regardless of short-term market movements.

5. Start small: Begin with a small amount of capital as you learn the ropes of gold trading.

In conclusion, gold trading offers a unique opportunity for traders. By understanding gold’s role in the economy, learning basic strategies, and avoiding common pitfalls, you can embark on this exciting journey.

For beginners, platforms like VT Markets provide an excellent starting point. With user-friendly tools, educational resources, and gold CFD trading options, it’s ideal for newcomers. The demo account feature allows you to practice risk-free before committing real funds. Remember, successful trading develops over time. Start small, keep learning, and utilise demo accounts to hone your skills. With persistence, gold trading could become a valuable addition to your financial toolkit.

Dividend Adjustment Notice – July 17,2024

Dear Client,

Please note that the dividends of the following products will be adjusted accordingly. Index dividends will be executed separately through a balance statement directly to your trading account, and the comment will be in the following format “Div & Product Name & Net Volume ”.

Please refer to the table below for more details:

The above data is for reference only, please refer to the MT4/MT5 software for specific data.

If you’d like more information, please don’t hesitate to contact info@vtmarkets.com.

Dividend Adjustment Notice – July 16,2024

Dear Client,

Please note that the dividends of the following products will be adjusted accordingly. Index dividends will be executed separately through a balance statement directly to your trading account, and the comment will be in the following format “Div & Product Name & Net Volume ”.

Please refer to the table below for more details:

The above data is for reference only, please refer to the MT4/MT5 software for specific data.

If you’d like more information, please don’t hesitate to contact info@vtmarkets.com.

Dividend Adjustment Notice – July 15,2024

Dear Client,

Please note that the dividends of the following products will be adjusted accordingly. Index dividends will be executed separately through a balance statement directly to your trading account, and the comment will be in the following format “Div & Product Name & Net Volume ”.

Please refer to the table below for more details:

The above data is for reference only, please refer to the MT4/MT5 software for specific data.

If you’d like more information, please don’t hesitate to contact info@vtmarkets.com.

A Complete Guide To Trading Indicators for CFD Bonds

Trading Indicators for CFD Bonds

The world of bonds can seem complex, especially when leveraging their price movements through Contracts for Differences (CFDs). Fear not, aspiring traders! This guide delves into the best trading indicators for CFD bonds, equipping you with valuable tools for both day trading and long-term strategies. Buckle up, and let’s navigate the bond market with confidence!

Understanding CFD Bonds

Before diving into indicators, it’s essential to understand that CFDs track the price movements of underlying assets like bonds without actual ownership. This allows speculation on price fluctuations, offering potential profit in both rising and falling markets. However, CFDs come with inherent risks, so responsible trading practices are crucial.

Choosing the Right Indicators

Now, onto the exciting part: indicators! These visual tools analyze price and volume data, offering insights into potential market trends and entry/exit points. But with numerous options available, which ones are best for CFD bonds?

Day Trading Gems

For day traders seeking quick wins, consider these indicators:

Moving Averages (MA):

Moving averages smooth out price fluctuations, revealing underlying trends. A short-term MA (e.g., 10-day) crossing above a long-term MA (e.g., 50-day) suggests an upward trend, potentially indicating a buying opportunity. Conversely, a downward crossover might signal a selling opportunity.

Example: When the 10-day MA crosses above the 50-day MA on a government bond CFD chart, it could suggest a potential short-term uptrend, prompting a day trader to buy.

Relative Strength Index (RSI):

This indicator measures price momentum, oscillating between 0 and 100. Readings below 30 indicate an oversold market, potentially signaling a buying opportunity. Values above 70 suggest overbought conditions, hinting at a potential selling opportunity.

Example: An RSI reading of 28 on a corporate bond CFD chart might signal an oversold situation, encouraging a day trader to enter a long position.

Long-Term Strategies

For long-term investors, these indicators offer valuable insights:

Support and Resistance Levels:

These represent areas where the price tends to bounce back (support) or encounter selling pressure (resistance). Identifying these levels can help with entry and exit points.

Example: Imagine a government bond CFD chart consistently finding support around 100 and resistance around 105. A long-term investor might buy near the support level and sell close to the resistance level.

MACD (Moving Average Convergence Divergence):

This indicator combines multiple MAs to identify trend direction and strength. When the MACD line (blue) crosses above the signal line (red), it suggests a potential uptrend. A downward crossover might indicate a downtrend.

Example: A MACD crossover above the signal line on a corporate bond CFD chart could signal a potential long-term uptrend, prompting a long-term investor to buy and hold.

Key Points to Remember

  • Indicators are Tools: They are not guarantees of success. Always consider fundamental factors and risk management strategies.
  • Back Test Indicators: Use historical data to assess their effectiveness in different market conditions.
  • Start Simple: Don’t get overwhelmed by too many indicators. Start with a few and gradually incorporate more as you gain experience.

FAQ

Q: What types of CFD bonds can I trade on VT Markets?

A: VT Markets offers CFDs on various bonds, including US Treasury Bonds and German Bunds. These allow traders to speculate on the price movements of government bonds from different countries.

Q: What are the most useful indicators for CFD bond trading?

A: Useful indicators include Moving Averages (MA), Relative Strength Index (RSI), support and resistance levels, and MACD.

Q: Can beginners use these indicators for trading CFDs?

A: Yes, beginners can use these indicators. Start with basic ones like Moving Averages and RSI, and gradually explore more complex indicators as you gain experience.

Q: How do I choose the right indicator for my trading strategy?

A: Choose indicators based on your trading goals. Day traders might prefer Moving Averages and RSI, while long-term investors might use support/resistance levels and MACD.

Q: Are there risks associated with using these indicators?

A: Yes, all indicators come with risks. They are tools to aid in decision-making and not foolproof methods. Always use them in conjunction with other analysis and risk management strategies.

Q: How often should I review my chosen indicators?

A: Regularly review and adjust your indicators based on market conditions and personal trading performance to ensure they remain effective.

Q: What are the most popular CFDs to trade on VT Markets?

A: Popular CFDs on VT Markets include major stock indices, commodities, and forex pairs. Bond CFDs, including US Treasury Bonds and German Bunds, are also available for trading.

Q: What is the best strategy for CFD trading?

A: The best strategy depends on your trading style and goals. Common strategies include trend following, range trading, breakout trading, scalping, and swing trading. Develop a strategy that fits your risk tolerance and market knowledge.

Q: How much capital do I need to start trading CFD bonds on VT Markets?

A: The amount of capital needed varies. It’s advisable to start with an amount you can afford to lose, considering the leverage and margin requirements of the broker.

Q: Can I trade CFD bonds on a demo account with VT Markets?

A: Yes, VT Markets offers a demo account where you can practice trading CFD bonds with virtual funds before committing real money.

Ready to start your journey in CFD bond trading? Explore our trading platform and open a demo account today to practice with virtual funds and gain confidence before trading in real markets. Visit VT Markets for more information on trading strategies and tools.

How the US election impacts the stock market

As the 2024 US presidential election approaches, investors are wondering how this pivotal event might affect their portfolios. With candidates presenting diverse economic platforms and the media amplifying every twist and turn of the campaign, it’s natural to feel concerned about potential market volatility.

This article aims to provide a clear perspective on how the 2024 election could impact the stock market, offering insights for individual investors navigating these uncertain waters.

While elections can indeed cause short-term market fluctuations, it’s crucial to remember that long-term market trends are primarily driven by economic fundamentals. Understanding this relationship can help you make more informed investment decisions during this election cycle and beyond.

Historical perspective

Looking back at previous election cycles provides valuable context for what we might expect in 2024.

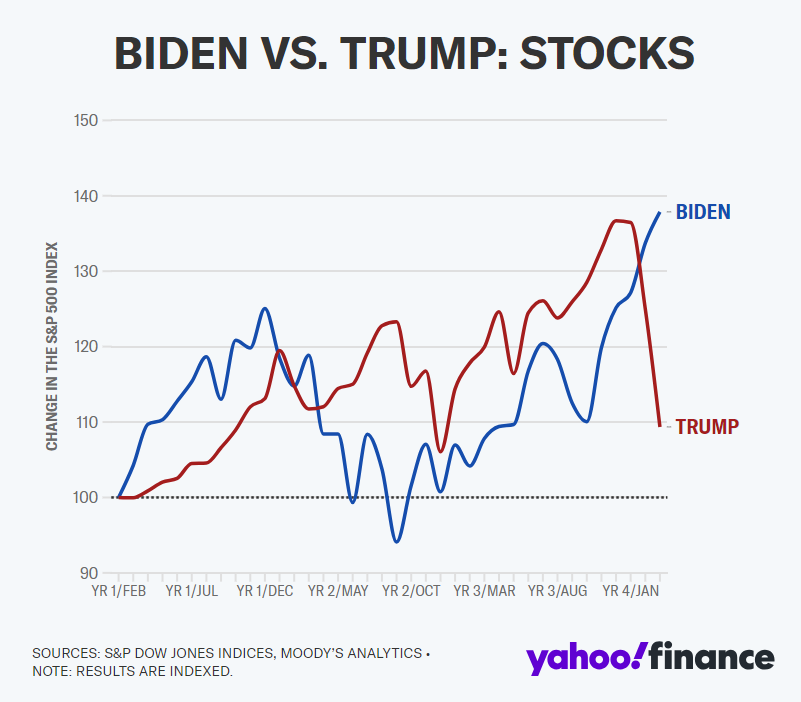
Election years have typically been favourable for the US stock market. Since 1960, the S&P 500 Index has increased in nearly every election year, with the notable exceptions of 2000 and 2008 due to the dotcom bust and the great financial crisis, respectively. In the three election years since 2008 — 2012, 2016, and 2020 — the benchmark index has risen by at least 10%.

During the 2016 election, markets initially reacted negatively to Donald Trump’s unexpected victory but quickly rebounded, with many sectors seeing significant gains in the following months.

The 2020 election, occurring amidst the global COVID-19 pandemic, saw increased volatility leading up to Election Day, followed by a rally as Joe Biden’s win became clear and vaccine developments boosted economic optimism.

It’s worth noting that pre-election market predictions often miss the mark. For instance, many analysts in 2016 predicted a market downturn if Trump won, which didn’t materialise as expected. This serves as a reminder that while historical data is relevant, it’s not definitively predictive of future market behaviour.

Short-term market volatility

The 2024 campaign has already demonstrated its potential to spark market volatility. We’ve seen sharp movements in response to major campaign events, debates, and shifts in polling data.

For example, since Biden’s poor debate performance on 27 June, the S&P 500 has risen approximately 1.5%. During the same period, the tech-focused Nasdaq has surged around 3%, and the Dow Jones Industrial Average has gained 1%.

These modest increases across the major stock indexes align with a slight uptick in the likelihood of a Trump victory in the upcoming November election.

This kind of volatility stems from several factors:

1. Uncertainty about future policies of major candidates.

2. Emotional reactions of investors to campaign rhetoric.

3. Media coverage amplifying market sentiment.

4. Speculation about potential winners and their impact on various sectors.

Sectors most affected by the 2024 election

Certain sectors are particularly sensitive to election outcomes due to potential policy changes. In 2024, we’re seeing this play out in several key areas:

Healthcare: The contrasting healthcare policies of the major candidates have led to fluctuations in healthcare stocks. Proposals ranging from expanding the Affordable Care Act to implementing a “Medicare for All” system have caused uncertainty in this sector.

Energy: The stark contrast between candidates supporting renewable energy expansion and those advocating for traditional fossil fuel industries has created a seesaw effect in energy stocks throughout the campaign.

Technology: With increased focus on data privacy and antitrust concerns, tech stocks have reacted to various regulatory proposals put forth by the candidates.

Defence: Different military spending proposals have influenced defence contractor stocks, with fluctuations corresponding to changes in candidates’ polling numbers.

The sectors most affected by a Biden win include renewable energy, electric vehicles, healthcare, infrastructure, technology, and consumer goods. For a Trump win, the impacted sectors are fossil fuels, aerospace and defence, real estate, traditional infrastructure, technology, finance, and telecommunications.

Long-term market trends

While the election dominates headlines, it’s crucial to remember that long-term market performance is more heavily influenced by fundamental economic factors such as GDP growth, unemployment rates, inflation, and global economic conditions. The actual impact of election results often proves less significant over time than initially anticipated.

For instance, regardless of who wins in 2024, factors like ongoing global supply chain restructuring, technological advancements, and demographic shifts will continue to shape market trends well beyond the election cycle.

Practical tips for traders

Given the potential for election-related market volatility, here are some practical tips for traders:

1. Maintain a long-term perspective: Don’t let short-term election noise derail your long-term investment strategy.

2. Diversify your portfolio: This can help mitigate risks associated with potential policy changes affecting specific sectors.

3. Avoid emotional decision-making: Try not to make investment choices based solely on campaign rhetoric or short-term market movements.

4. Focus on your financial goals: Your personal financial objectives should guide your investment decisions more than election outcomes.

5. Stay informed, but don’t overreact: While it’s important to understand candidates’ economic policies, avoid making drastic portfolio changes based on campaign promises alone.

The role of fiscal and monetary policy

It’s important to understand that while presidents can influence economic policy, their power is not absolute. Congress plays a significant role in shaping fiscal policy, and the Federal Reserve operates independently to manage monetary policy.

The Fed, in particular, has historically worked to maintain economic stability during political transitions. Its decisions on interest rates and other monetary tools can have a more immediate impact on markets than many presidential policies.

Conclusion

As we navigate the 2024 election season, it’s natural to feel concerned about potential market impacts. However, history shows that while elections can cause short-term volatility, long-term market trends are driven by broader economic factors.

Stay informed about the candidates’ economic policies, but avoid making hasty investment decisions based on campaign rhetoric or short-term market fluctuations. Instead, focus on your long-term financial goals, maintain a diversified portfolio, and remember that the U.S. economy and stock market have shown resilience through many election cycles.

By keeping these principles in mind, you can approach the 2024 election—and its potential market impacts—with greater confidence and a clearer perspective.

How the US election impacts the stock market

As the 2024 US presidential election approaches, investors are wondering how this pivotal event might affect their portfolios. With candidates presenting diverse economic platforms and the media amplifying every twist and turn of the campaign, it’s natural to feel concerned about potential market volatility.

This article aims to provide a clear perspective on how the 2024 election could impact the stock market, offering insights for individual investors navigating these uncertain waters.

While elections can indeed cause short-term market fluctuations, it’s crucial to remember that long-term market trends are primarily driven by economic fundamentals. Understanding this relationship can help you make more informed investment decisions during this election cycle and beyond.

Historical perspective

Looking back at previous election cycles provides valuable context for what we might expect in 2024.

Election years have typically been favourable for the US stock market. Since 1960, the S&P 500 Index has increased in nearly every election year, with the notable exceptions of 2000 and 2008 due to the dotcom bust and the great financial crisis, respectively. In the three election years since 2008 — 2012, 2016, and 2020 — the benchmark index has risen by at least 10%.

During the 2016 election, markets initially reacted negatively to Donald Trump’s unexpected victory but quickly rebounded, with many sectors seeing significant gains in the following months.

The 2020 election, occurring amidst the global COVID-19 pandemic, saw increased volatility leading up to Election Day, followed by a rally as Joe Biden’s win became clear and vaccine developments boosted economic optimism.

It’s worth noting that pre-election market predictions often miss the mark. For instance, many analysts in 2016 predicted a market downturn if Trump won, which didn’t materialise as expected. This serves as a reminder that while historical data is relevant, it’s not definitively predictive of future market behaviour.

Short-term market volatility

The 2024 campaign has already demonstrated its potential to spark market volatility. We’ve seen sharp movements in response to major campaign events, debates, and shifts in polling data.

For example, since Biden’s poor debate performance on 27 June, the S&P 500 has risen approximately 1.5%. During the same period, the tech-focused Nasdaq has surged around 3%, and the Dow Jones Industrial Average has gained 1%.

These modest increases across the major stock indexes align with a slight uptick in the likelihood of a Trump victory in the upcoming November election.

This kind of volatility stems from several factors:

1. Uncertainty about future policies of major candidates.

2. Emotional reactions of investors to campaign rhetoric.

3. Media coverage amplifying market sentiment.

4. Speculation about potential winners and their impact on various sectors.

Sectors most affected by the 2024 election

Certain sectors are particularly sensitive to election outcomes due to potential policy changes. In 2024, we’re seeing this play out in several key areas:

Healthcare: The contrasting healthcare policies of the major candidates have led to fluctuations in healthcare stocks. Proposals ranging from expanding the Affordable Care Act to implementing a “Medicare for All” system have caused uncertainty in this sector.

Energy: The stark contrast between candidates supporting renewable energy expansion and those advocating for traditional fossil fuel industries has created a seesaw effect in energy stocks throughout the campaign.

Technology: With increased focus on data privacy and antitrust concerns, tech stocks have reacted to various regulatory proposals put forth by the candidates.

Defence: Different military spending proposals have influenced defence contractor stocks, with fluctuations corresponding to changes in candidates’ polling numbers.

The sectors most affected by a Biden win include renewable energy, electric vehicles, healthcare, infrastructure, technology, and consumer goods. For a Trump win, the impacted sectors are fossil fuels, aerospace and defence, real estate, traditional infrastructure, technology, finance, and telecommunications.

Long-term market trends

While the election dominates headlines, it’s crucial to remember that long-term market performance is more heavily influenced by fundamental economic factors such as GDP growth, unemployment rates, inflation, and global economic conditions. The actual impact of election results often proves less significant over time than initially anticipated.

For instance, regardless of who wins in 2024, factors like ongoing global supply chain restructuring, technological advancements, and demographic shifts will continue to shape market trends well beyond the election cycle.

Practical tips for traders

Given the potential for election-related market volatility, here are some practical tips for traders:

1. Maintain a long-term perspective: Don’t let short-term election noise derail your long-term investment strategy.

2. Diversify your portfolio: This can help mitigate risks associated with potential policy changes affecting specific sectors.

3. Avoid emotional decision-making: Try not to make investment choices based solely on campaign rhetoric or short-term market movements.

4. Focus on your financial goals: Your personal financial objectives should guide your investment decisions more than election outcomes.

5. Stay informed, but don’t overreact: While it’s important to understand candidates’ economic policies, avoid making drastic portfolio changes based on campaign promises alone.

The role of fiscal and monetary policy

It’s important to understand that while presidents can influence economic policy, their power is not absolute. Congress plays a significant role in shaping fiscal policy, and the Federal Reserve operates independently to manage monetary policy.

The Fed, in particular, has historically worked to maintain economic stability during political transitions. Its decisions on interest rates and other monetary tools can have a more immediate impact on markets than many presidential policies.

Conclusion

As we navigate the 2024 election season, it’s natural to feel concerned about potential market impacts. However, history shows that while elections can cause short-term volatility, long-term market trends are driven by broader economic factors.

Stay informed about the candidates’ economic policies, but avoid making hasty investment decisions based on campaign rhetoric or short-term market fluctuations. Instead, focus on your long-term financial goals, maintain a diversified portfolio, and remember that the U.S. economy and stock market have shown resilience through many election cycles.

By keeping these principles in mind, you can approach the 2024 election—and its potential market impacts—with greater confidence and a clearer perspective.

A Complete Guide to the Best Hedging Strategies with ETFs

The Best Hedging Strategies for ETFs Trading

If you are an investor looking to reduce risk in a volatile market, consider hedging strategies with ETFs. Hedging protects your portfolio from adverse price movements by taking an opposite position in another asset.

ETFs, or exchange-traded funds, are collections of securities that track an index, sector, commodity, or theme. They offer low-cost, diversified, and liquid exposure to various markets. Let’s explore what hedging strategies with ETFs are, how they work, and some of the best strategies to protect your portfolio. We will also provide examples to illustrate how they can reduce risk and enhance returns.

What are Hedging Strategies with ETFs?

Hedging strategies with ETFs involve using ETFs to offset the risk of another investment. For example, if you own a portfolio of stocks sensitive to the US economy, you might hedge against a possible recession by buying an ETF that tracks US Treasury bonds. If the stock market declines due to a recession, the bond ETF should rise in value, cushioning your losses.

Hedging strategies with ETFs can be classified into two types: passive and active.

Passive Hedging

Passive hedging strategies involve buying and holding an ETF that has a negative correlation with your portfolio. This means the ETF tends to move in the opposite direction of your portfolio. For example, if you own a portfolio of technology stocks, you might buy an ETF that tracks gold, a safe-haven asset during uncertainty.

Active Hedging

Active hedging strategies involve adjusting your exposure to an ETF based on your market outlook and risk tolerance. You can increase or decrease the size of your hedge depending on your confidence in your portfolio. For example, if you own a portfolio of emerging market stocks, you might buy an ETF that tracks the US dollar, which tends to appreciate when emerging markets face challenges. You can reduce your exposure to the dollar ETF when you expect emerging markets to recover.

How Does It Work?

Hedging strategies with ETFs work by balancing your portfolio and the ETF used as a hedge. The goal is to reduce overall volatility and risk without sacrificing too much potential return. To achieve this, consider three factors: correlation, beta, and hedge ratio.

Correlation

Correlation measures how closely two assets move together. It ranges from -1 to 1:

  • -1: Perfect negative correlation (move in opposite directions)
  • 0: No correlation (move independently)
  • 1: Perfect positive correlation (move in the same direction)

Ideally, use an ETF with a negative correlation to your portfolio as a hedge.

Beta

Beta measures how sensitive an asset is to movements of another asset. It is calculated by dividing the covariance between the two assets by the variance of the other asset. For example, if an ETF has a beta of 0.5 relative to your portfolio, it moves 0.5% for every 1% movement in your portfolio. Use an ETF with a low beta relative to your portfolio as a hedge.

Hedge Ratio

Hedge ratio is the proportion of your portfolio you want to hedge with an ETF. It is calculated by multiplying the beta of the ETF by the value of your portfolio and dividing by the value of the ETF. For example, if you have a $10,000 portfolio with a beta of 1 relative to an ETF worth $100 with a beta of 0.5, your hedge ratio would be (0.5 x 10,000) / 100 = 50%. This means you need to buy 50 shares of the ETF to hedge 50% of your portfolio.

Best Hedging Strategies with ETFs

Here are some of the best hedging strategies with ETFs to consider:

Hedging Against Inflation

Inflation erodes the purchasing power of money and reduces the real value of your investments. To hedge against inflation, use ETFs that track commodities like gold, silver, oil, or agricultural products. These ETFs rise in value when inflation increases. Alternatively, use ETFs that track inflation-protected securities like Treasury Inflation-Protected Securities (TIPS).

Hedging Against Interest Rate Risk

Interest rate risk affects the value of bonds and other fixed-income securities. When interest rates rise, bond prices fall. Hedge against this risk using ETFs that track inverse or short-term bonds like ProShares Short 20+ Year Treasury ETF (TBF) or iShares 1-3 Year Treasury Bond ETF (SHY).

Hedging Against Currency Risk

Currency risk affects the value of foreign investments and earnings due to changes in exchange rates. When the US dollar weakens, foreign investments become more valuable in dollar terms. Hedge against currency risk using ETFs that track foreign currencies like Invesco CurrencyShares Euro Trust (FXE) or WisdomTree Japanese Yen Strategy Fund (JYF).

Hedging Against Market Risk

Market risk involves losing money due to changes in market conditions. Hedge against market risk using ETFs that track inverse or alternative assets like ProShares Short S&P500 ETF (SH) or Amplify BlackSwan Growth & Treasury Core ETF (SWAN).

Hedging Strategies Examples

To illustrate how hedging strategies with ETFs work, let’s look at two examples:

Example 1:
You have a $10,000 portfolio of US stocks with a beta of 1 relative to the S&P 500 index. You want to hedge 50% of your portfolio against a market downturn using an inverse S&P 500 ETF worth $50 with a beta of -1. Your hedge ratio would be (-1 x 10,000) / 50 = -200%. You need to buy 200 shares of the inverse S&P 500 ETF to hedge 50% of your portfolio. If the S&P 500 index drops by 10%, your portfolio loses $1,000, but your hedge gains $1,000, resulting in a net loss of $0.

Example 2:
You have a $10,000 investment in a European company paying dividends in euros. You want to hedge 100% of your investment against a US dollar appreciation using a euro ETF worth $100 with a beta of 1 relative to the euro/US dollar exchange rate. Your hedge ratio would be (1 x 10,000) / 100 = 100%. You need to buy 100 shares of the euro ETF to hedge 100% of your investment. If the euro/US dollar exchange rate drops by 10%, your investment loses $1,000, but your hedge gains $1,000, resulting in a net loss of $0.

Conclusion

Hedging strategies with ETFs provide a practical way to protect your portfolio from market volatility. By understanding and implementing these strategies, you can reduce risk and enhance returns. Consider your investment goals, risk tolerance, and market outlook when choosing the best hedging strategies for your needs.

FAQ

Q: What are the benefits of hedging with ETFs?

A: Hedging with ETFs offers diversification, liquidity, and cost-efficiency. It helps reduce portfolio risk and manage market volatility effectively.

Q: Can beginners use hedging strategies with ETFs?

A: Yes, beginners can use hedging strategies with ETFs. Start with simple strategies and gradually explore more complex ones as you gain experience.

Q: How do I choose the right ETF for hedging?

A: Choose an ETF that has a negative correlation or low beta relative to your portfolio. Consider the ETF’s performance, fees, and market conditions.

Q: Are there any risks associated with hedging with ETFs?

A: Yes, hedging with ETFs involves risks such as tracking errors, market risk, and potential costs. It’s essential to understand these risks and manage them effectively.

Q: How often should I review my hedging strategy?

A: Regularly review your hedging strategy, especially during market changes or when your investment goals shift. Adjust your hedges as needed to align with your objectives.

Q: What is the difference between passive and active hedging?

A: Passive hedging involves holding an ETF with a negative correlation to your portfolio, while active hedging adjusts ETF exposure based on market outlook and risk tolerance.

Q: Can I hedge against multiple risks with ETFs?

A: Yes, you can hedge against various risks such as inflation, interest rate, currency, and market risk using different ETFs tailored to each risk type.

Q: How do I calculate the hedge ratio?

A: Calculate the hedge ratio by multiplying the ETF’s beta by the value of your portfolio and dividing it by the value of the ETF.

Ready to explore hedging strategies with ETFs? Find out more on our ETFs Trading page. Visit VT Markets for information on FX Trading and more.

Dividend Adjustment Notice – July 12,2024

Dear Client,

Please note that the dividends of the following products will be adjusted accordingly. Index dividends will be executed separately through a balance statement directly to your trading account, and the comment will be in the following format “Div & Product Name & Net Volume ”.

Please refer to the table below for more details:

The above data is for reference only, please refer to the MT4/MT5 software for specific data.

If you’d like more information, please don’t hesitate to contact info@vtmarkets.com.

Back To Top
server

Hello there 👋

How can I help you?

Chat with our team instantly

Live Chat

Start a live conversation through...

  • Telegram
    hold On hold
  • Coming Soon...

Hello there 👋

How can I help you?

telegram

Scan the QR code with your smartphone to start a chat with us, or click here.

Don’t have the Telegram App or Desktop installed? Use Web Telegram instead.

QR code