Back

Forex market analysis: 24 April 2025

Global markets have been on edge as shifting trade headlines and political signals continue to sway investor sentiment. With talk of potential tariff changes and reassurances from the White House about the Federal Reserve’s independence, traders are navigating a landscape where policy developments can quickly shift the outlook for bonds and risk assets alike.

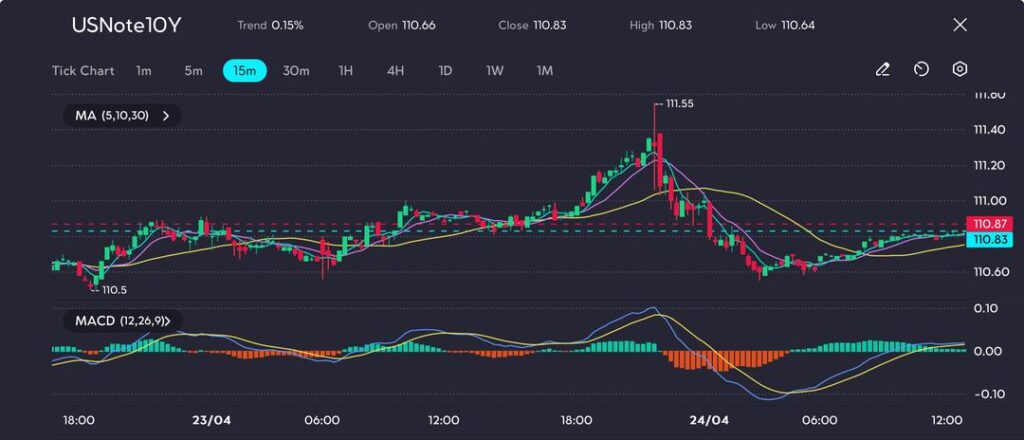
US 10-year note sees volatility amid trade speculation and Fed assurance

The US 10-year Treasury note opened Thursday’s session near 110.66, briefly rallying to 111.55 following early speculation that the Trump administration might relax tariffs on Chinese imports.

This development temporarily fuelled risk appetite, as lower trade barriers often reduce inflation concerns and drive demand for US government bonds.

However, the rally lost steam after Treasury Secretary Scott Bessent clarified that no official discussions with China had commenced and no decisions had been made regarding tariff adjustments.

This dampened initial optimism, leading to a pullback, with the note closing near 110.83.

Political cues and market sentiment

Investor sentiment also responded to President Trump’s reassurance that Federal Reserve Chair Jerome Powell would not be dismissed.

This move was interpreted as a signal of continued central bank independence, easing concerns that monetary policy might become politicised.

The confirmation helped restore some confidence among bondholders that interest rate decisions would remain grounded in economic data.

Technical analysis

Following a quiet open, the USNote10Y broke higher, reaching an intraday peak of 111.55.

This move was underpinned by steep inclines in the 5- and 10-period moving averages, suggesting strong bullish momentum.

US10Y spikes to 111.55 before retreating; eyes now on whether bulls can reclaim the upper band, as seen on the VT Markets app.

However, the rally proved short-lived. The price quickly reversed course, dropping below the 30-period moving average to a low of 110.64.

At present, the note is showing signs of modest recovery. The MACD indicator points to fading bearish momentum, with a potential bullish crossover forming above the signal line.

Price action is consolidating just above 110.80, testing short-term resistance.

A sustained push above 111.00 could trigger further upside, while failure to reclaim key averages might keep the note in a sideways pattern beneath 110.90.

Outlook: Trade developments and inflation data in focus

With tariff negotiations still uncertain and key US inflation figures due soon, Treasury yields are expected to remain highly sensitive to geopolitical headlines and macroeconomic updates.

Market participants will be monitoring closely for tangible developments in US-China trade relations, while Friday’s PCE inflation report could provide additional insight into the Federal Reserve’s rate outlook.

Click here to open account and start trading.

Forex market analysis: 23 April 2025

Japanese stocks bounced back this week as investors grew more confident about the outlook at home and abroad. Hopes for easier US monetary policy and improving trade relations helped lift market sentiment, while fresh signs of stability in Japan’s economy added to the positive tone. Although global risks remain, the mood has clearly shifted, with traders showing renewed interest in riskier assets like equities.

Japanese stocks rebound on improved sentiment and domestic strength

Japanese equities rallied sharply this week, with the Nikkei 225 index rising nearly 2% intraday, peaking at 35,447.13 before closing at 35,054.13.

The surge was driven by a blend of political clarity, positive economic data, and renewed global risk appetite.

Markets welcomed comments from former US President Donald Trump, who reversed his stance on replacing Federal Reserve Chair Jerome Powell.

Instead, he called for deeper interest rate cuts, signalling a dovish shift in US monetary policy. Additionally, Trump’s remarks on trade—suggesting a possible reduction in tariffs on Chinese goods—boosted export-reliant Japanese shares and broader Asian market sentiment.

On the domestic front, Japan’s flash Purchasing Managers’ Index (PMI) for April signalled the most robust economic momentum in recent months.

The Composite PMI rose to 51.1 from 48.9 in March, reflecting expanding activity. Notably, the services sector posted its fastest growth in three months, while the manufacturing sector remained steady—underpinning a narrative of gradual recovery.

However, the International Monetary Fund (IMF) offered a more measured outlook, trimming Japan’s GDP growth forecast to 0.6% for both 2025 and 2026, citing external headwinds such as weaker global demand and the potential impact of US trade policy.

Nikkei 225 technical analysis: Bullish bias remains intact

From a technical perspective, the Nikkei 225 displayed a strong bullish trend, rebounding from a low of 33,814.13 to an intraday high of 35,447.13, before retracing.

Nikkei pares gains after surging to 35,447, but buyers regroup as momentum starts to rebuild, as seen on the VT Markets app.

Price action stayed close to the 5- and 10-period moving averages during the climb—indicating sustained buying interest.

A brief pullback followed, but key support around the 30-period moving average (34,660–34,700) held firm.

The MACD histogram shows weakening bearish momentum, while the MACD lines are beginning to converge—hinting at a possible bullish crossover.

If buying interest continues above the 30-MA, a retest of 35,450 resistance is likely, with room for a further breakout.

However, if momentum stalls, the index may consolidate between 34,800 and 35,100.

Outlook: Modest optimism despite global uncertainties

While the IMF’s downgraded forecast introduces a note of caution, short-term sentiment has turned more constructive.

Traders appear hopeful about a dovish Fed, stronger Japanese data, and a potential easing in US-China trade tensions.

If momentum persists, the Nikkei 225 could break above recent highs to retest 35,500, with potential to climb towards the 36,000 level in the coming sessions.

Click here to open account and start trading.

Dividend Adjustment Notice – Apr 23 ,2025

Dear Client,

Please note that the dividends of the following products will be adjusted accordingly. Index dividends will be executed separately through a balance statement directly to your trading account, and the comment will be in the following format “Div & Product Name & Net Volume”.

Please refer to the table below for more details:

Dividend Adjustment Notice

The above data is for reference only, please refer to the MT4/MT5 software for specific data.

If you’d like more information, please don’t hesitate to contact info@vtmarkets.com.

Dividend Adjustment Notice – Apr 22 ,2025

Dear Client,

Please note that the dividends of the following products will be adjusted accordingly. Index dividends will be executed separately through a balance statement directly to your trading account, and the comment will be in the following format “Div & Product Name & Net Volume”.

Please refer to the table below for more details:

Dividend Adjustment Notice

The above data is for reference only, please refer to the MT4/MT5 software for specific data.

If you’d like more information, please don’t hesitate to contact info@vtmarkets.com.

Forex market analysis: 22 April 2025

Oil prices are moving in a tug of war between supply and demand concerns, as market participants weigh geopolitical tensions, central bank signals, and the potential return of Iranian crude. While recent volatility has triggered cautious buying, overall sentiment remains fragile, with traders keeping a close eye on global developments that could sway the market in either direction.

Oil prices rebound modestly amid fragile market sentiment

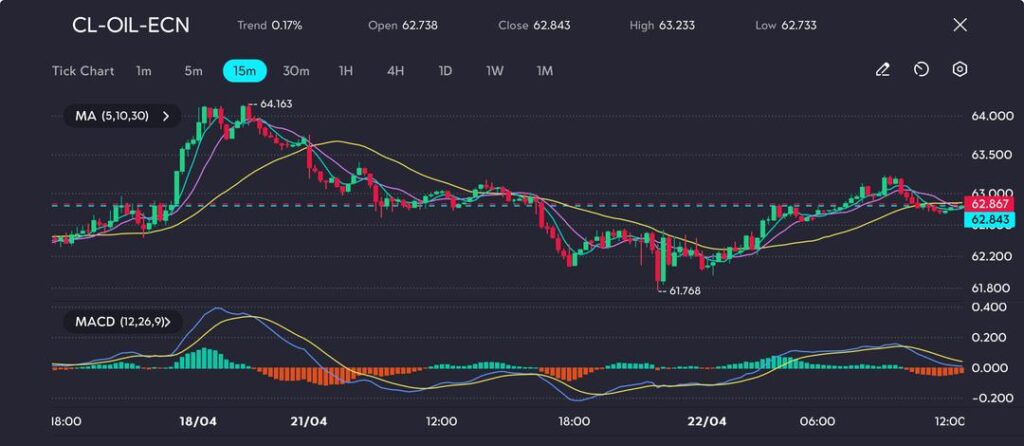
Crude oil prices saw a modest recovery on Tuesday, with West Texas Intermediate (WTI) June futures rising by 0.7% to USD 62.84 after experiencing a sharp 2% drop in the prior session.

The rebound was primarily driven by short covering, as traders locked in gains on bearish positions amid lingering concerns over global risk appetite.

Market outlook remains cautious, with fears of a potential recession fuelled by tariff tensions and uncertainty surrounding US monetary policy.

Comments from President Trump urging the Federal Reserve to cut interest rates have renewed concerns about the central bank’s independence.

As a result, US equity markets declined, and the dollar index fell to a three-year low, clouding the outlook for energy demand.

Meanwhile, progress in US–Iran nuclear negotiations continues to cap oil’s upside potential. If sanctions are lifted, the return of Iranian crude could increase global supply and weigh on prices.

Reflecting these concerns, Russia has revised its 2025 Brent crude forecast down by 17%, signalling expectations of a supply-heavy market environment.

Technical analysis: key levels in focus

WTI crude surged to a high of USD 64.16 before entering a corrective phase, retreating to a recent low of USD 61.77.

Oil prices consolidate below USD 63 as momentum fades, as seen on the VT Markets app.

The current price action, hovering near USD 62.84, shows a cautious attempt to reclaim lost ground, now testing resistance at key short-term moving averages.

Technical indicators reflect mixed momentum. The MACD shows diminishing bullish strength, with its histogram flattening and signal lines tightening—suggesting possible consolidation or a pause in direction.

Meanwhile, the convergence of 5-, 10-, and 30-day moving averages highlights indecision in the market, awaiting a fresh catalyst.

Key resistance is located at USD 63.23, while support lies between USD 62.00 and 61.77. A decisive move above resistance could revive bullish sentiment, while a breakdown below support might signal further downside.

Oil likely to trade sideways in near term

With WTI crude caught between weakening demand concerns linked to trade policies and supply-side risks from Iran, the market may remain range-bound between USD 61 and USD 64 in the short term.

Traders will closely monitor upcoming EIA and API inventory data, while broader price direction could be influenced by Federal Reserve signals and geopolitical developments.

Click here to open account and start trading.

Shorting Stocks: How to Short a Stock?

Shorting Stocks: Learn How to Short a Stock

In this article, we will provide a comprehensive guide to short selling stocks, a trading strategy that allows traders to profit from a decline in stock prices. Whether you’re a seasoned trader or new to the concept, we’ll break down how short selling works, the risks involved, and the key steps you need to take to start shorting stocks.

What is Short Selling?

Short selling is a trading strategy that allows market participants to profit from the decline in the price of a stock or other asset. Unlike traditional investing, where traders buy stocks with the expectation that their value will rise, short selling works in the opposite direction. The strategy involves borrowing a stock, selling it at the current market price, and then buying it back later at a lower price to return to the lender. If the stock price drops, the trader can repurchase it at a lower price, pocketing the difference as profit. Short selling offers traders the opportunity to capitalize on falling markets, but it comes with its own set of risks and complexities.

What is Shorting a Stock?

Shorting a stock, or short selling, is the act of selling borrowed shares of a stock that the trader does not own. The goal is to buy the shares back at a lower price in the future. Essentially, shorting stocks allows traders to profit from the decline in a stock’s value, which is the opposite of buying or going long on a stock. Traders typically engage in short selling when they believe that a stock’s price will fall based on factors such as negative company news, market trends, or broader economic conditions.

How Does Shorting a Stock Work?

Let’s break down how short selling works with both traditional and CFD approaches:

Traditional Short Selling:

  • Borrow Shares: A trader borrows shares from their broker.
  • Sell the Shares: The borrowed shares are sold in the market at the current price.
  • Wait for the Price to Drop: The trader monitors the stock, hoping the price decreases.
  • Buy Back at a Lower Price: If the price falls, the trader buys back the shares at the reduced price.
  • Return Shares to Broker: The trader returns the borrowed shares and keeps the profit from the price difference.

CFD Short Selling:

With CFD trading, you don’t actually own or borrow the asset. Instead, you enter into an agreement with your broker to settle the difference in price between the time the position is opened and closed.

In a short CFD position, you’re speculating that the asset’s price will fall. If the market moves in your favor, you can close the trade at a lower price, and the broker will pay you the difference as your profit.

Example: If a stock is priced at $100, and you open a short CFD position, expecting the price to drop, the stock falls to $90. You close the position, earning a $10 profit per share, depending on your position size.

How to Short a Stock?

Shorting a stock involves a few key steps that require careful planning and risk management. Here’s a step-by-step guide on how to short a stock:

Step 1: Understand How Shorting a Stock Works

Before diving into short selling, it’s crucial to understand the process. Shorting stocks involves borrowing shares of a stock from a broker, selling them on the market, and then buying them back at a later time, hoping the price will drop. If the stock price falls, you can repurchase it at a lower price, returning the shares to the lender and keeping the difference as profit.

Step 2: Research Stocks to Short

Identify stocks that you believe will decrease in value. Look for overvalued stocks, those with weak fundamentals, or companies facing negative news or market trends. Technical analysis can help spot price patterns that suggest a potential decline. Additionally, keep an eye on any upcoming events like earnings reports or regulatory changes that might affect a stock’s price.

Step 3: Select a Reliable Broker

Choose a reliable broker that supports short selling and offers the necessary tools to manage your trades effectively. Ensure the broker provides margin accounts, as this is required for borrowing shares. Look for a trading platform with competitive fees, fast execution, and access to real-time market data to make informed decisions.

Step 4: Create and Fund Your Trading Account

To begin shorting stocks, you’ll need to open a trading account with your broker. This account allows you to borrow funds or securities to engage in short selling. Ensure your account is funded with enough margin to cover potential losses, and understand the terms and requirements set by your broker before proceeding.

Step 5: Place a Short Sell Order

Once you’ve selected the stock, you can place a short sell order through your broker’s platform. When placing the order, you’ll be borrowing the stock to sell it at the current market price. It’s important to set the right parameters for your order to ensure your position is executed at the desired price.

Step 6: Monitor the Position

After opening the short position, closely monitor the stock’s price movement. Stay updated on market trends, news, and any events that could impact the stock. Depending on the market’s movements, you might need to adjust your strategy or prepare to close the position if the price moves unfavorably.

Step 7: Buy Back the Stock

When the stock price falls to your desired level, it’s time to buy back the shares. This step is known as “covering” the short position. You’ll buy the same number of shares that you borrowed, ideally at a lower price than what you sold them for. Once you purchase the shares, return them to the lender and pocket the profit from the price difference.

The Risk of Shorting a Stock

While short selling can be profitable, it comes with significant risks:

Unlimited Losses: The primary risk of shorting stocks is the potential for unlimited losses. Unlike buying a stock, where your losses are limited to the amount you invested, short selling has no ceiling. If the stock price rises dramatically, your losses can continue to grow.

Discover the difference between trading and investing

Short Squeeze: A short squeeze occurs when a heavily shorted stock suddenly experiences a sharp price increase, forcing short sellers to buy back shares to cover their positions. This can cause the price to rise even further, exacerbating losses.

Margin Calls: Since short selling involves borrowing shares, brokers require that traders maintain a margin in their accounts. If the stock price rises, and the trader’s margin falls below the required threshold, they may receive a margin call, requiring them to deposit more funds or close their position at a loss.

Market Volatility: Short selling in volatile markets can increase the risk of significant losses. In a highly volatile market, stock prices can swing unpredictably, making it more challenging to time the short sale and increasing the likelihood of losses. Rapid price fluctuations could trigger stop-loss orders or force traders to buy back stocks at a higher price than anticipated.

Discover the difference between going long and going short

Conclusion

Shorting stocks is a powerful strategy that allows traders to profit from falling stock prices. By borrowing and selling stocks they don’t own, traders can take advantage of market declines. However, shorting stocks comes with significant risks, including the potential for unlimited losses and short squeezes. It’s essential for traders to fully understand the mechanics of shorting a stock and to use appropriate risk management techniques, such as stop-loss orders, when engaging in this strategy.

Short a Stock Today with VT Markets

At VT Markets, we provide a seamless and efficient platform for shorting stocks with confidence. Our advanced trading tools, including MetaTrader 4 and MetaTrader 5, give you the flexibility to manage your positions with ease. With competitive spreads, fast execution, and real-time market data, you can take advantage of market movements quickly and efficiently. 

Whether you’re new to short selling or an experienced trader, VT Markets offers the resources you need to execute short stock trades effectively. You can also start with a VT Markets demo account to practice shorting stocks risk-free, allowing you to get comfortable with the platform and strategies before trading with real capital.

Start shorting stocks today with VT Markets and utilize our powerful platforms to enhance your trading experience.

Frequently Asked Questions (FAQs)

1. What is short selling in simple terms? 

Short selling is the process of borrowing a stock, selling it, and then buying it back later at a lower price to profit from the stock’s decline.

2. How can I start shorting stocks? 

To start shorting stocks, you’ll need a margin account with a broker that supports short selling. You can then choose a stock, borrow it, sell it, and buy it back when the price drops.

3. What are the risks of shorting stocks? 

The main risks include unlimited losses if the stock price rises, short squeezes, margin calls, and regulatory restrictions.

4. Can I make money shorting stocks? 

Yes, you can make money by shorting stocks if their price falls. However, it’s important to carefully manage risk since there are significant potential losses if the price rises.

Forex market analysis: 21 April 2025

Gold is once again capturing the spotlight as investors seek safety amid rising global uncertainty. Heightened geopolitical tensions, shifting trade policies, and weakening major currencies are fuelling renewed interest in the precious metal. As traditional assets face mounting pressure, gold stands out as a reliable store of value, drawing strong demand from those looking to protect their wealth in turbulent times.

Gold rallies above USD 3,390 amid trade tensions and US dollar weakness

Gold prices surged past USD 3,390 on Monday, climbing more than 1 percent and marking a new all-time high.

The rise was driven by heightened safe-haven demand, as global trade tensions intensified, and the US dollar continued to lose ground.

With uncertainty dominating the economic landscape, gold is becoming an increasingly attractive refuge for investors seeking stability.

Rising trade tensions fuel demand for gold

The latest boost in gold prices followed an announcement by former US President Donald Trump, who launched an investigation into the potential introduction of new tariffs on all critical mineral imports.

This step, viewed as a significant escalation in the ongoing trade friction—especially with China—has added to investor anxiety and reinforced the demand for defensive assets such as gold.

US dollar decline enhances gold’s appeal

The decline of the US dollar, which dropped to a three-year low, has further strengthened gold’s position.

As the value of the greenback falls, gold becomes more affordable to buyers using other currencies, thereby increasing global demand and supporting its role as a hedge against currency depreciation.

ECB rate cut contributes to bullish sentiment

In addition to geopolitical concerns, recent monetary policy actions have also supported gold’s ascent.

The European Central Bank’s decision to cut interest rates has made the low-yield environment even less appealing for traditional investments.

As a result, gold is drawing interest from investors seeking alternative stores of value.

Technical analysis remains bullish

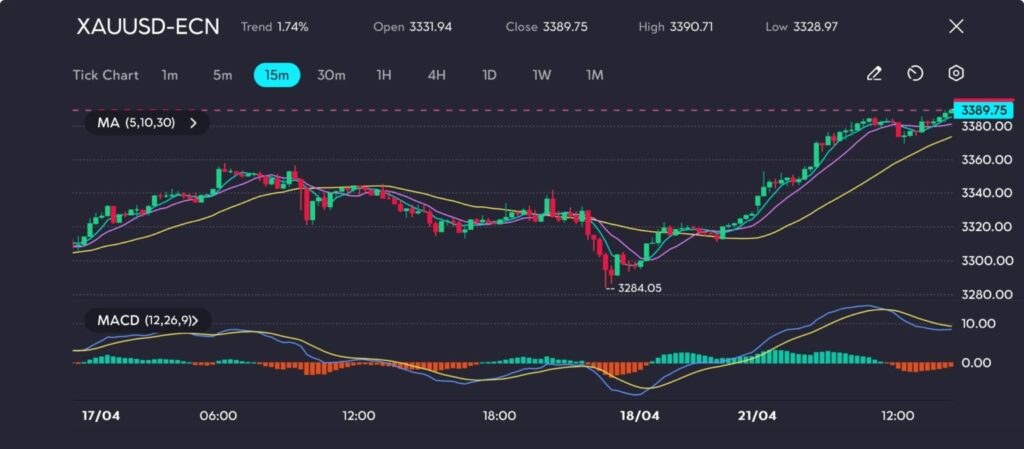
XAU/USD rose by 1.74 percent, ending the day at USD 3,389.75 after opening at USD 3,331.94.

Prices reached a high of USD 3,390.71 before slightly retreating.

The market’s technical structure remains strong, with short-term moving averages rising above longer-term ones, indicating ongoing upward momentum.

The MACD also signals a positive trend, as the MACD line remains above the signal line and the histogram stays in positive territory.

Outlook and levels to watch

With trade-related uncertainty lingering and the US dollar under pressure, gold may continue its upward trajectory.

XAU/USD surges past 3380 to test resistance at 3390.71, as seen on the VT Markets app.

Market participants are keeping a close eye on further developments in the US-China trade relationship and any additional moves from major central banks.

Immediate resistance is found near USD 3,390, and a breakout above this level could pave the way for further gains.

On the downside, support is currently observed around USD 3,320, with any easing in geopolitical tensions potentially triggering a short-term pullback.

Click here to open account and start trading.

Stops Level Adjustment Notice – Apr 21 ,2025

Dear Client,

To provide a better trading environment in accordance with the market conditions, VT Markets will adjust trading setting on April 21, 2025.

Please find the table below for more information:
1. Pending Stop Orders (Buy Stop / Sell Stop): The order price must not be set within the current spread range.
2. Stop Loss (S/L): The stop-loss price must not be set within the current spread range.
3. Pending Limit Orders (Buy Limit / Sell Limit) and Take Profit (T/P): The price is not restricted by the current spread range.

If you’d like more information, please don’t hesitate to contact info@vtmarkets.com.

Week ahead: Markets eye central bank signals

The upcoming week is poised to be pivotal for global financial markets as investors navigate a landscape marked by heightened volatility stemming from recent US tariff implementations.

Key corporate earnings reports, economic indicators, and central bank communications will be in focus as market participants assess the broader economic implications of escalating trade tensions.

KEY INDICATORS

Central bank communications

  • Market participants will closely monitor remarks from Federal Reserve officials for any indications on future monetary policy.
  • The release of the Federal Reserve’s Beige Book on Wednesday will provide a regional economic overview ahead of the upcoming policy meeting.

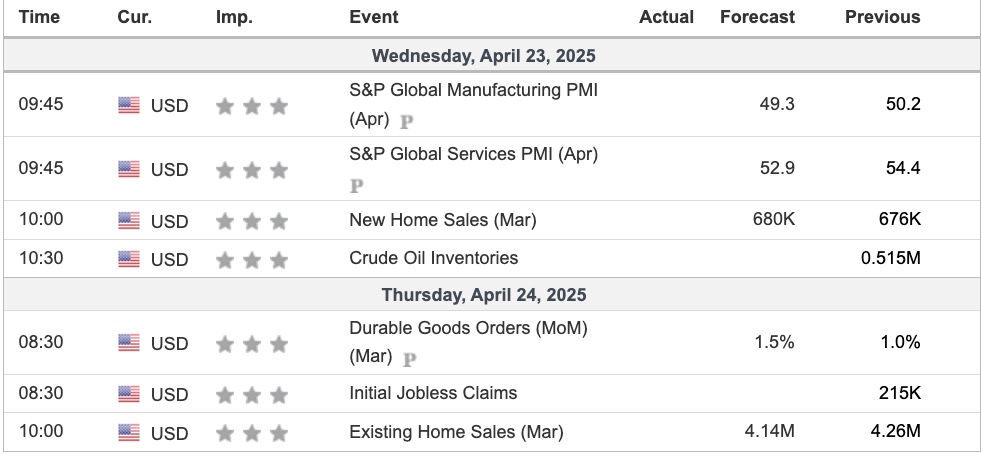
Wednesday, 23 April

  • US new home sales (March): Providing insights into the housing market’s response to current economic conditions.

Thursday, 24 April

  • US existing home sales (March): Further data on housing market trends.
  • Weekly jobless claims: Offering a snapshot of the labour market’s resilience.

Friday, 25 April

  • US durable goods orders (March): Indicating business investment trends.
  • University of Michigan consumer sentiment index (April final): Assessing consumer confidence amid economic uncertainties.

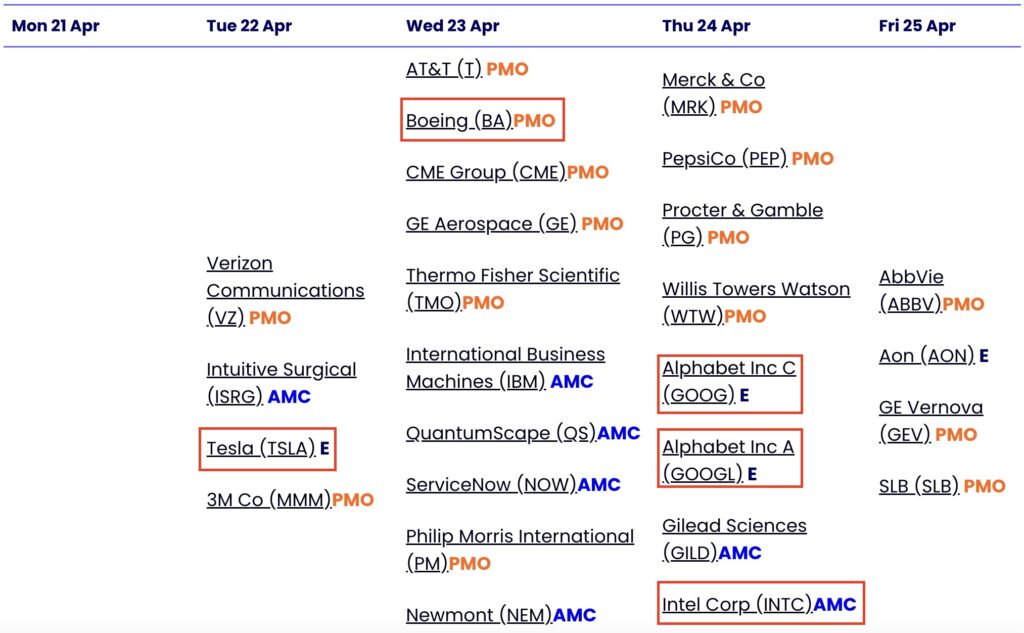
Economic events for the coming week include a slew of major companies set to report earnings, providing insights into how businesses are coping with the current economic climate.

MARKET MOVERS

European stocks pare losses following European Central Bank interest rate cut

European stock markets pared losses to close nearly flat on Thursday following the European Central Bank’s decision to cut interest rates.

  • The pan-European Stoxx 600 index provisionally closed 0.1% lower.
  • Regionally, the UK’s FTSE 100 was little changed for the session.
  • Germany’s DAX and France’s CAC 40 fell by 0.5%.

As widely expected, the European Central Bank trimmed interest rates for the third time this year by 25 basis points amid concerns over the eurozone’s economic growth outlook in a time of uncertainty over global trade and tariffs.

ECB cuts interest rates by 25 basis points

  • The ECB on Thursday cut interest rates by 25 basis points, as was widely expected ahead of the decision.
  • Markets had priced in around a 94% chance of such a cut, and around a 6% chance of a larger, 50 basis point reduction.
  • This takes the central bank’s deposit facility rate, its key rate, to 2.25% — down from highs of 4% in mid-2023.

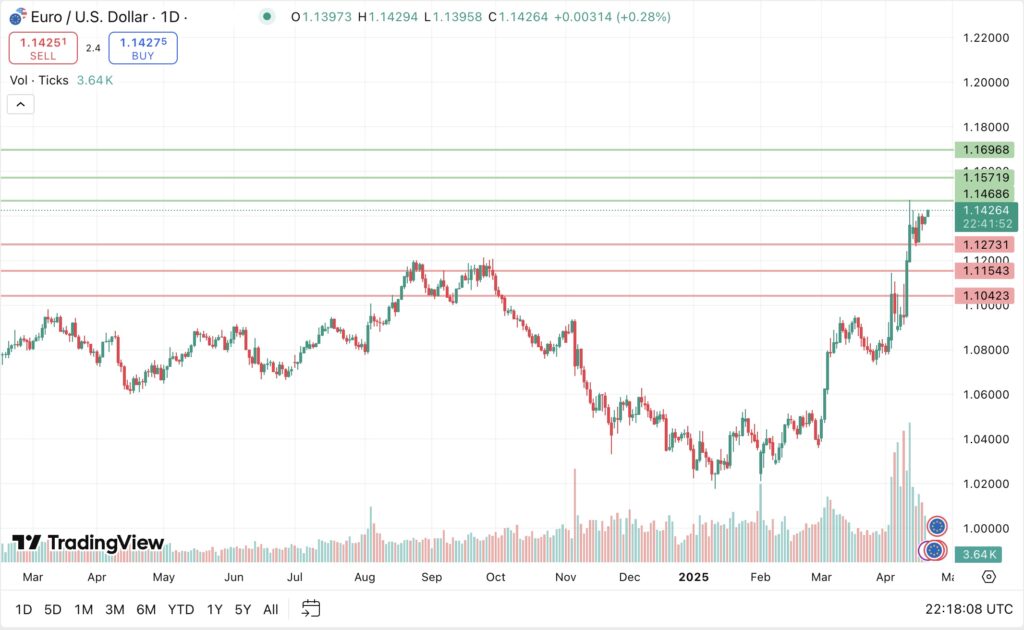
EUR/USD

Preferred long preference

Long positions above 1.14686 with targets at 1.15719 & 1.16963 in extension.

Alternative scenario

Above 1.12731 look for further upside with 1.11543 & 1.10423 as targets.

The RSI is above its neutrality area at 50. The MACD is above its signal line and negative. The MACD must break above its zero level to trigger further gains. Moreover, the price is above its 20 and 50 period moving average.

Earnings report news

First-quarter earnings season is due to begin during the second full week of April, led by banking giants JPMorgan Chase (JPM) and Wells Fargo (WFC).

Analysts at US financial data group FactSet estimate a year-on-year earnings growth rate of 7.3% for the S&P 500 companies, which would mark the seventh consecutive quarter of earnings growth reported by the index.

Companies are beating Q1 earnings estimates so far. Some big results are up next

  • The first-quarter earnings season is off to a softish start by some measures, according to new research, but another quarter of year-on-year growth still looks likely.
  • Based on preliminary results—just 12% of S&P 500 companies have reported so far, according to analysis released late Thursday by FactSet—70% of reporting companies in the benchmark index have come in above Street estimates.
  • Earnings have come in 6.1% above estimates, also below the five- and ten-year averages.
  • The S&P 500’s first-quarter results are still projected to grow for a seventh consecutive quarter.
  • A combination of reported results and estimates for those yet to report indicates growth of 7.2% so far.

Key: PMO = Pre-market open | AMC = After market close | E = Estimated

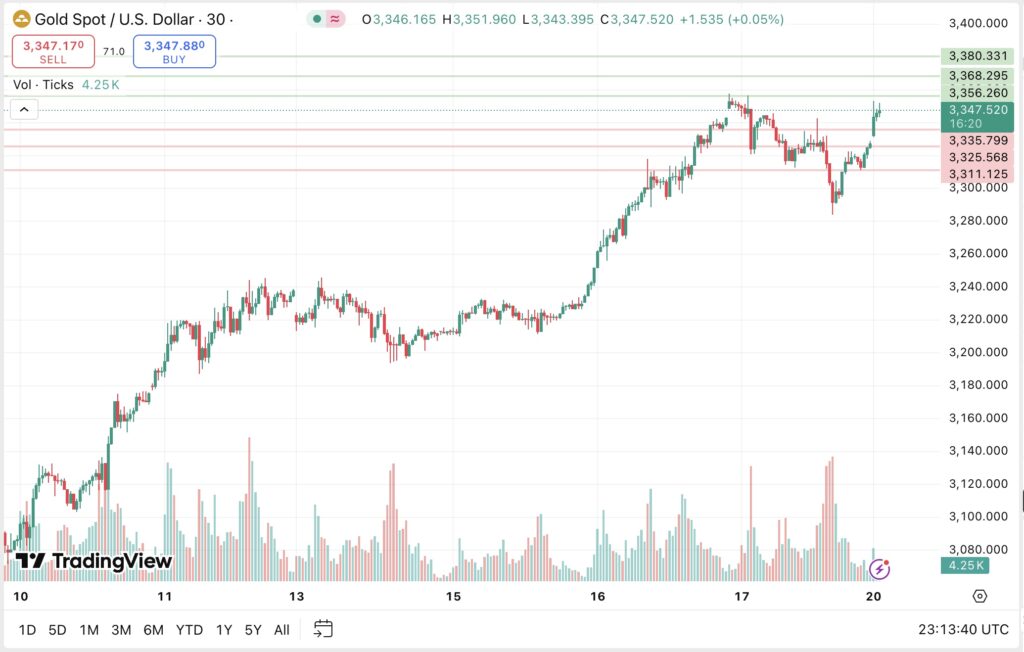
XAU/USD

Potential short preference

Short positions below 3335.79 with targets at 3325.56 & 3311.12 in extension.

Alternative scenario

Above 3356.26 look for further upside with 3368.29 & 3380.33 as targets.

The index currently faces a challenging resistance.

Gold starts coming back to Switzerland from US after exclusion from Trump’s tariffs

  • Gold, which traders had been flying to New York since December as a precaution against the possibility of broad US tariffs hitting bullion imports, is being shipped back to Switzerland, where it originated, official data shows.
  • Swiss customs data on Thursday showed that the country’s gold imports from the US rose to a thirteen-month high of 25.5 metric tonnes in March, from 12.1 tonnes in February.
  • Gold exports from Switzerland to the US fell 32% month-on-month to 103.2 tonnes.
  • Gold, silver, and platinum worth more than USD 80 billion were delivered to Comex warehouses in the December–March period, keeping logistics firms and Swiss refineries busier than usual.
  • Part of what is currently being delivered out of the US gold vaults is returning to Switzerland, the world’s biggest bullion refining and transit hub, said a source at a Swiss refinery.

NEWS HEADLINES

Oil prices slip 1% after progress in US-Iran talks

  • Oil prices fell more than 1% at Monday’s open in Asia after nuclear talks between the United States and Iran progressed, easing supply concerns.
  • Brent crude futures slipped 78 cents, or 1.15%, to USD 67.18 a barrel at 10:12 PM GMT.
  • US West Texas Intermediate crude was at USD 63.91 a barrel, down 77 cents, or 1.19%.
  • The two countries agreed on Saturday to begin drafting a framework for a potential nuclear deal, Iran’s foreign minister said, after talks that a US official described as yielding “very good progress.”

Japan seeks ‘fairness’ in currency talks with US, Prime Minister Ishiba says

  • Japan will emphasise “fairness” in any discussions with the US on exchange rates, Prime Minister Shigeru Ishiba said on Sunday, as bilateral trade talks gain global attention during President Donald Trump’s tariff offensive.
  • Trump has imposed 24% tariffs on Japanese exports to the US, although, like most of Trump’s levies, they have been paused until early July.
  • A 10% universal rate remains in place, as does a 25% duty on cars, a mainstay of Japan’s export-reliant economy.

Stock futures fall after Wall Street posts another losing week

  • Stock futures fell on Sunday evening following yet another negative trading week for Wall Street.
  • S&P 500 futures declined by 0.5%.
  • Nasdaq-100 futures dropped 0.5%.
  • Futures tied to the Dow Jones Industrial Average tumbled 214 points, or 0.5%.
  • These moves come after each of the three major averages logged a third weekly decline in the last four trading weeks.

Click here to open account and start trading.

Dividend Adjustment Notice – Apr 21 ,2025

Dear Client,

Please note that the dividends of the following products will be adjusted accordingly. Index dividends will be executed separately through a balance statement directly to your trading account, and the comment will be in the following format “Div & Product Name & Net Volume”.

Please refer to the table below for more details:

Dividend Adjustment Notice

The above data is for reference only, please refer to the MT4/MT5 software for specific data.

If you’d like more information, please don’t hesitate to contact info@vtmarkets.com.

Back To Top
server

Hello there 👋

How can I help you?

Chat with our team instantly

Live Chat

Start a live conversation through...

  • Telegram
    hold On hold
  • Coming Soon...

Hello there 👋

How can I help you?

telegram

Scan the QR code with your smartphone to start a chat with us, or click here.

Don’t have the Telegram App or Desktop installed? Use Web Telegram instead.

QR code